QQuestionAnatomy and Physiology
QuestionAnatomy and Physiology
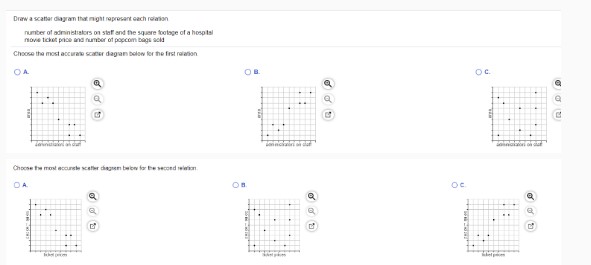
| Drain a scatter diagram that might represent each relation: | |
| --- | --- |
| Number of administrations on staff and the square footage of a hospital | |
| Home toilet price and number of popcorn bags sold | |
| Choose the most accurate scatter diagram below for the first relation: | |
| ☐ A. | ☐ B. |
| ☐ B. | ☐ C. |
| ☐ D. | ☐ E. |
| ☐ F. | ☐ G. |
| ☐ H. | ☐ I. |
| ☐ J. | ☐ J. |
| ☐ K. | ☐ L. |
| ☐ L. | ☐ M. |
| ☐ N. | ☐ O. |
| ☐ O. | ☐ P. |
| ☐ P. | ☐ Q. |
| ☐ Q. | ☐ R. |
| ☐ S. | ☐ T. |
| ☐ U. | ☐ V. |
| ☐ V. | ☐ W. |
| ☐ X. | ☐ Y. |
| ☐ Y. | ☐ Z. |
| ☐ Z. | ☐ Z. |
| ☐ Z. | ☐ Z. |
| ☐ Z. | ☐ Z. |
| ☐ Z. | ☐ Z. |
| ☐ Z. | ☐ Z. |
| ☐ Z. | ☐ Z. |
| ☐ Z. | ☐ Z. |
| ☐ Z. | ☐ Z. |
| ☐ Z. | ☐ Z. |
| ☐ Z. | ☐ Z. |
| ☐ Z. | ☐ Z. |
| ☐ Z. | ☐ Z. |
| ☐ Z. | ☐ Z. |
| ☐ Z. | ☐ Z. |
| ☐ Z. | ☐ Z. |
| ☐ Z. | ☐ Z. |
| ☐ Z. | ☐ Z. |
| ☐ Z. | ☐ Z. |
| ☐ Z. | ☐ Z. |
| ☐ Z. | ☐ Z. |
| ☐ Z. | ☐ Z. |
| ☐ Z. | ☐ Z. |
| ☐ Z. | ☐ Z. |
| ☐ Z. | ☐ Z. |
| ☐ Z. | ☐ Z. |
| ☐ Z. | ☐ Z. |
| ☐ Z. | ☐ Z. |
| ☐ Z. | ☐ Z. |
| ☐ Z. | ☐ Z. |
| ☐ Z. | ☐ Z. |
| ☐ Z. | ☐ Z. |
Attachments

6 months agoReport content
Answer
Full Solution Locked
Sign in to view the complete step-by-step solution and unlock all study resources.
Step 1I'll solve this problem step by step, focusing on the first relation: Number of administrations on staff and the square footage of a hospital.
Step 2: Understand the Scatter Diagram Relationship
A scatter diagram shows the relationship between two variables. For the number of administrations on staff and hospital square footage, we want to determine the type of correlation.
Final Answer
The scatter diagram representing the relationship between number of administrations and hospital square footage would show a clear positive linear correlation.
Need Help with Homework?
Stuck on a difficult problem? We've got you covered:
- Post your question or upload an image
- Get instant step-by-step solutions
- Learn from our AI and community of students