QQuestionAnatomy and Physiology
QuestionAnatomy and Physiology
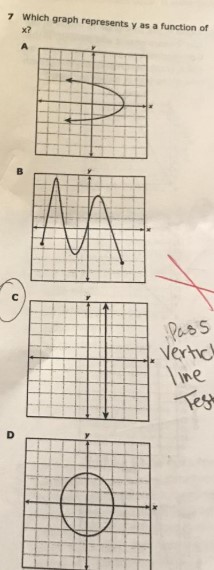
7 Which graph represents $y$ as a function of $x$ ?
Attachments
6 months agoReport content
Answer
Full Solution Locked
Sign in to view the complete step-by-step solution and unlock all study resources.
Step 1: Identify the graphs that represent a function.
A relation is a function if for every input, there is exactly one output. In other words, for each x-value, there can only be one y-value.
Step 2: Examine the given graphs.
Graph A: For an x-value of - 2, there are two different y-values, - 1 and 1. This means that Graph A does not represent a function. Graph B: For every x-value, there is exactly one y-value. This means that Graph B represents a function. Graph C: For an x-value of 1, there are two different y-values, 0 and 2. This means that Graph C does not represent a function. Graph D: For every x-value, there is exactly one y-value. This means that Graph D represents a function.
Final Answer
Graph B and Graph D represent y as a function of x.
Need Help with Homework?
Stuck on a difficult problem? We've got you covered:
- Post your question or upload an image
- Get instant step-by-step solutions
- Learn from our AI and community of students