QQuestionAnatomy and Physiology
QuestionAnatomy and Physiology
**Multiple Choice:** Please select the best answer and click "submit."
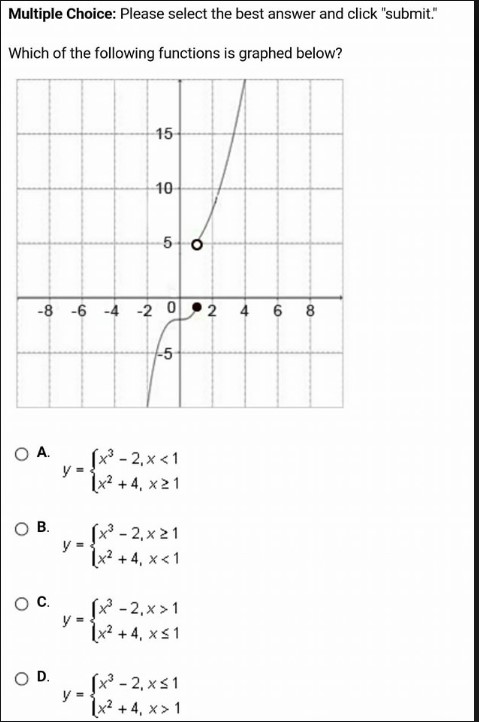
Which of the following functions is graphed below?
- **A.** y = \begin{cases} x^3 - 2, & x < 1 \\ x^2 + 4, & x \geq 1 \end{cases}
- **B.** y = \begin{cases} x^3 - 2, & x \geq 1 \\ x^2 + 4, & x < 1 \end{cases}
- **C.** y = \begin{cases} x^3 - 2, & x > 1 \\ x^2 + 4, & x \leq 1 \end{cases}
- **D.** y = \begin{cases} x^3 - 2, & x \leq 1 \\ x^2 + 4, & x > 1 \end{cases}
Attachments
6 months agoReport content
Answer
Full Solution Locked
Sign in to view the complete step-by-step solution and unlock all study resources.
Step 1Let's solve this step by step by analyzing the graph and the piecewise functions.
Step 2: Examine the graph's characteristics
- The point of transition seems to be at the point $$(1, 3)
- At x = 1, the graph changes from one function to another
Final Answer
The correct answer is **D.** y = \begin{cases} x^3 - 2, & x \leq 1 \ x^2 + 4, & x > 1 \end{cases}
Need Help with Homework?
Stuck on a difficult problem? We've got you covered:
- Post your question or upload an image
- Get instant step-by-step solutions
- Learn from our AI and community of students