QQuestionAnatomy and Physiology
QuestionAnatomy and Physiology
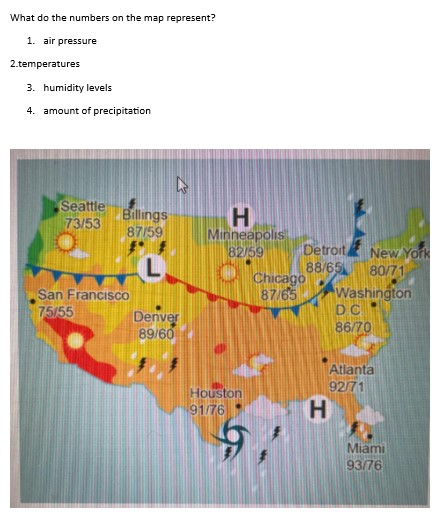
What do the numbers on the map represent?
1. air pressure
2. temperatures
3. humidity levels
4. amount of precipitation
Attachments
6 months agoReport content
Answer
Full Solution Locked
Sign in to view the complete step-by-step solution and unlock all study resources.
Step 1: Identify the map key and the corresponding values
Looking at the map provided, we can find the map key on the bottom right corner. The map key shows that the numbers on the map represent temperatures.
Step 2: Analyze the temperature range
The map key indicates that the temperatures are given in degrees Celsius. The range of temperatures on the map is from - 20°C to 30°C.
Final Answer
The numbers on the map represent temperatures in degrees Celsius. Higher numbers indicate warmer temperatures, and lower numbers indicate colder temperatures.
Need Help with Homework?
Stuck on a difficult problem? We've got you covered:
- Post your question or upload an image
- Get instant step-by-step solutions
- Learn from our AI and community of students