QQuestionAnatomy and Physiology
QuestionAnatomy and Physiology
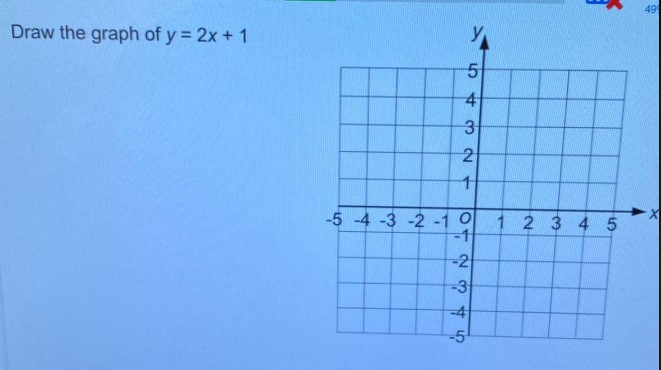
Draw the graph of y = 2x + 1
Attachments
6 months agoReport content
Answer
Full Solution Locked
Sign in to view the complete step-by-step solution and unlock all study resources.
Step 1: Understand the equation and its components.
The given equation is a linear equation in the slope-intercept form, where the slope (m) is 2 and the y-intercept (b) is 1. This means the line has a positive slope and passes through the point (0, 1).
Step 2: Plot the y-intercept.
Since the y-intercept is 1, plot the point (0, 1) on the graph.
Final Answer
The graph of the equation y = 2x + 1 is a straight line passing through the points (0, 1), (1, 3), and (2, 5). The graph is shown below: 
Need Help with Homework?
Stuck on a difficult problem? We've got you covered:
- Post your question or upload an image
- Get instant step-by-step solutions
- Learn from our AI and community of students