QQuestionStatistics
QuestionStatistics
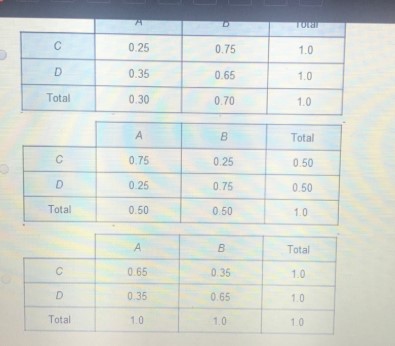
Which could be a conditional relative frequency table?
| | **B** | **B** | **Total** |
| --- | --- | --- | --- |
| C | 0.25 | 0.75 | 1.0 |
| D | 0.35 | 0.65 | 1.0 |
| Total | 0.30 | 0.70 | 1.0 |
| | A | B | Total |
| C | 0.75 | 0.25 | 0.50 |
| D | 0.25 | 0.75 | 0.50 |
| Total | 0.50 | 0.50 | 1.0 |
| | A | B | Total |
| C | 0.65 | 0.35 | 1.0 |
| D | 0.35 | 0.65 | 1.0 |
| Total | 1.0 | 1.0 | 1.0 |
Attachments
5 months agoReport content
Answer
Full Solution Locked
Sign in to view the complete step-by-step solution and unlock all study resources.
Step 1I'm assuming you would like help determining which table can be a conditional relative frequency table.
I will go through each table and explain whether it can be a conditional relative frequency table. **Table 1:** This table cannot be a conditional relative frequency table because the row and column totals do not sum to the same value in both tables. In this case, the row totals sum to 1.0, while the column totals sum to 1.0 in one table and 0.5 in the other. **Table 2:** This table can be a conditional relative frequency table. Here's why:
Step 2
There are two rows and two columns, making it a 2x^2 contingency table.
Final Answer
Table 2 can be a conditional relative frequency table.
Need Help with Homework?
Stuck on a difficult problem? We've got you covered:
- Post your question or upload an image
- Get instant step-by-step solutions
- Learn from our AI and community of students