QQuestionAnatomy and Physiology
QuestionAnatomy and Physiology
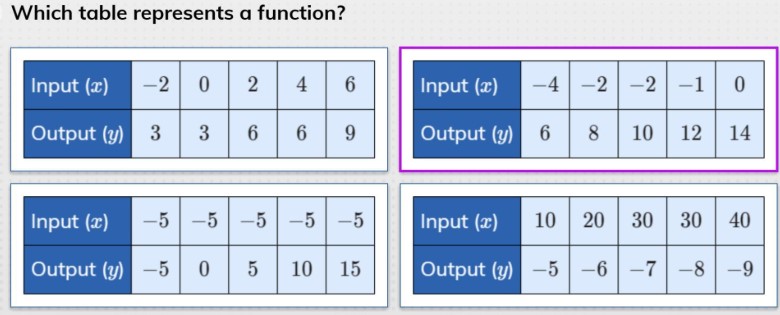
Which table represents a function?
| Input (x) | - 2 | 0 | 2 | 4 | 6 |
| --- | --- | --- | --- | --- | --- |
| Output (y) | 3 | 3 | 6 | 6 | 9 |
| Input (x) | - 5 | - 5 | - 5 | - 5 | - 5 |
| --- | --- | --- | --- | --- | --- |
| Output (y) | - 5 | 0 | 5 | 10 | 15 |
| Input (x) | - 4 | - 2 | - 2 | - 1 | 0 |
| --- | --- | --- | --- | --- | --- |
| Output (y) | 6 | 8 | 10 | 12 | 14 |
| Input (x) | 10 | 20 | 30 | 30 | 40 |
| --- | --- | --- | --- | --- | --- |
| Output (y) | - 5 | - 6 | - 7 | - 8 | - 9 |
Attachments
6 months agoReport content
Answer
Full Solution Locked
Sign in to view the complete step-by-step solution and unlock all study resources.
Step 1: Identify the key characteristic of a function.
A function is a set of ordered pairs where each input (x) is associated with exactly one output (y). In other words, for any given input value, there can only be one corresponding output value.
Step 2: Examine the tables to see if they represent functions.
Table 1: For input values - 2, 0, 2, 4, and 6, there is only one output value each, i.e., 3, 3, 6, 6, and 9 respectively. Thus, this table represents a function. Table 2: Here, the input value - 5 is associated with output values - 5, 0, 5, 10, and 15. This means that different inputs correspond to the same output, which violates the definition of a function. Hence, this table does not represent a function. Table 3: The input value - 2 is associated with output values 8 and 10, meaning that different inputs correspond to the same output. Therefore, this table does not represent a function. Table 4: The input values 30 and 40 both correspond to the output value - 9. Thus, this table does not represent a function.
Final Answer
Out of the given tables, only Table 1 represents a function.
Need Help with Homework?
Stuck on a difficult problem? We've got you covered:
- Post your question or upload an image
- Get instant step-by-step solutions
- Learn from our AI and community of students