QQuestionAnatomy and Physiology
QuestionAnatomy and Physiology
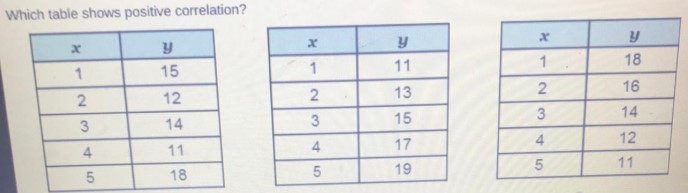
Which table shows positive correlation?
| $\boldsymbol{x}$ | $\boldsymbol{y}$ |
| :--: | :--: |
| 1 | 15 |
| 2 | 12 |
| 3 | 14 |
| 4 | 11 |
| 5 | 18 |
| $\boldsymbol{x}$ | $\boldsymbol{y}$ |
| :--: | :--: |
| 1 | 11 |
| 2 | 13 |
| 3 | 15 |
| 4 | 17 |
| 5 | 19 |
| $\boldsymbol{x}$ | $\boldsymbol{y}$ |
| :--: | :--: |
| 1 | 18 |
| 2 | 16 |
| 3 | 14 |
| 4 | 12 |
| 5 | 11 |
Attachments
6 months agoReport content
Answer
Full Solution Locked
Sign in to view the complete step-by-step solution and unlock all study resources.
Step 1: Determine the general trend of each table.
In the first table, as the x-values increase, the y-values generally decrease. In the second table, both the x and y-values increase together. In the third table, as the x-values increase, the y-values decrease.
Step 2: Understand the concept of correlation.
Correlation is a statistical term that describes the degree to which two variables move in relation to each other. When one variable increases, the other variable tends to either increase or decrease. Positive correlation occurs when two variables increase or decrease together. Negative correlation occurs when one variable increases while the other decreases.
Final Answer
The second table shows positive correlation.
Need Help with Homework?
Stuck on a difficult problem? We've got you covered:
- Post your question or upload an image
- Get instant step-by-step solutions
- Learn from our AI and community of students