Solution Manual for Essential Foundations of Economics, 8th Edition
Solution Manual for Essential Foundations of Economics, 8th Edition is the ultimate guide for understanding and solving textbook problems.
Sebastian Lopez
Contributor
4.3
103
about 2 months ago
Preview (31 of 233)
Sign in to access the full document!
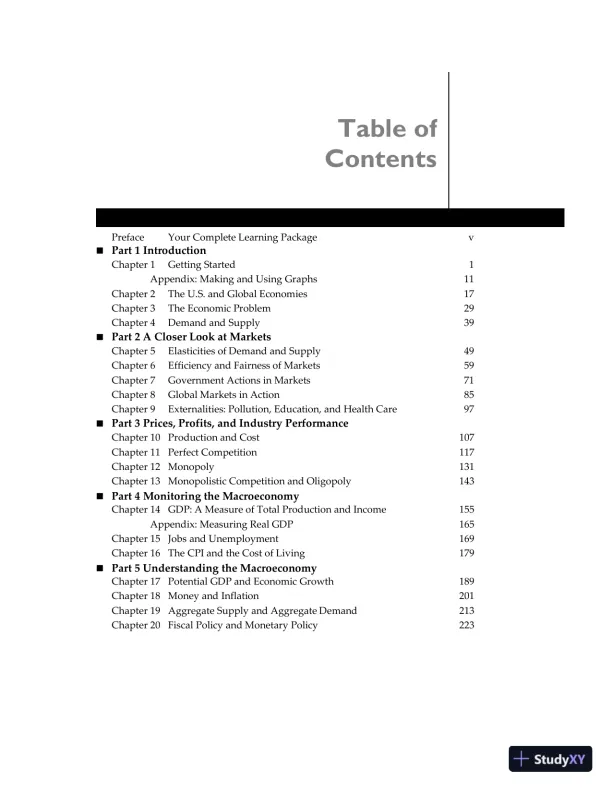
Table of
Contents
Preface Your Complete Learning Package v
◼ Part 1 Introduction
Chapter 1 Getting Started 1
Appendix: Making and Using Graphs 11
Chapter 2 The U.S. and Global Economies 17
Chapter 3 The Economic Problem 29
Chapter 4 Demand and Supply 39
◼ Part 2 A Closer Look at Markets
Chapter 5 Elasticities of Demand and Supply 49
Chapter 6 Efficiency and Fairness of Markets 59
Chapter 7 Government Actions in Markets 71
Chapter 8 Global Markets in Action 85
Chapter 9 Externalities: Pollution, Education, and Health Care 97
◼ Part 3 Prices, Profits, and Industry Performance
Chapter 10 Production and Cost 107
Chapter 11 Perfect Competition 117
Chapter 12 Monopoly 131
Chapter 13 Monopolistic Competition and Oligopoly 143
◼ Part 4 Monitoring the Macroeconomy
Chapter 14 GDP: A Measure of Total Production and Income 155
Appendix: Measuring Real GDP 165
Chapter 15 Jobs and Unemployment 169
Chapter 16 The CPI and the Cost of Living 179
◼ Part 5 Understanding the Macroeconomy
Chapter 17 Potential GDP and Economic Growth 189
Chapter 18 Money and Inflation 201
Chapter 19 Aggregate Supply and Aggregate Demand 213
Chapter 20 Fiscal Policy and Monetary Policy 223
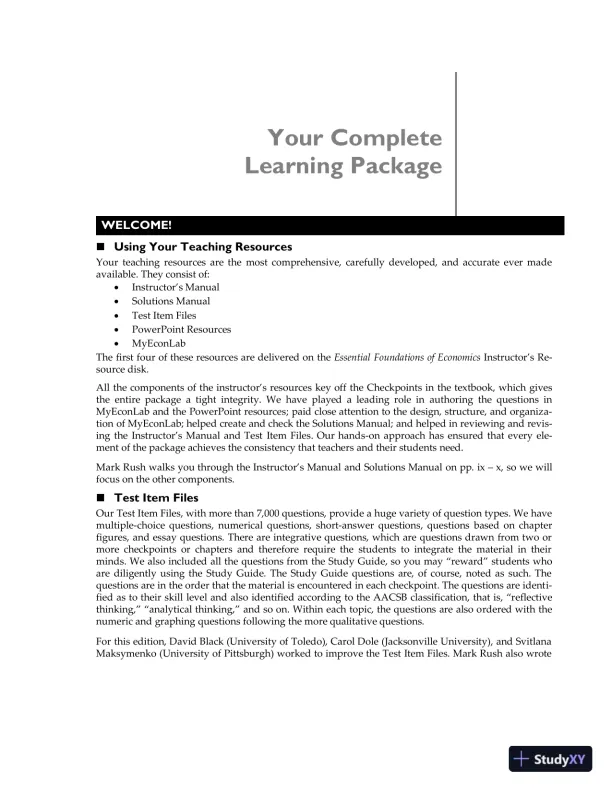
Your Complete
Learning Package
WELCOME!
◼ Using Your Teaching Resources
Your teaching resources are the most comprehensive, carefully developed, and accurate ever made
available. They consist of:
• Instructor’s Manual
• Solutions Manual
• Test Item Files
• PowerPoint Resources
• MyEconLab
The first four of these resources are delivered on the Essential Foundations of Economics Instructor’s Re-
source disk.
All the components of the instructor’s resources key off the Checkpoints in the textbook, which gives
the entire package a tight integrity. We have played a leading role in authoring the questions in
MyEconLab and the PowerPoint resources; paid close attention to the design, structure, and organiza-
tion of MyEconLab; helped create and check the Solutions Manual; and helped in reviewing and revis-
ing the Instructor’s Manual and Test Item Files. Our hands-on approach has ensured that every ele-
ment of the package achieves the consistency that teachers and their students need.
Mark Rush walks you through the Instructor’s Manual and Solutions Manual on pp. ix – x, so we will
focus on the other components.
◼ Test Item Files
Our Test Item Files, with more than 7,000 questions, provide a huge variety of question types. We have
multiple-choice questions, numerical questions, short-answer questions, questions based on chapter
figures, and essay questions. There are integrative questions, which are questions drawn from two or
more checkpoints or chapters and therefore require the students to integrate the material in their
minds. We also included all the questions from the Study Guide, so you may “reward” students who
are diligently using the Study Guide. The Study Guide questions are, of course, noted as such. The
questions are in the order that the material is encountered in each checkpoint. The questions are identi-
fied as to their skill level and also identified according to the AACSB classification, that is, “reflective
thinking,” “analytical thinking,” and so on. Within each topic, the questions are also ordered with the
numeric and graphing questions following the more qualitative questions.
For this edition, David Black (University of Toledo), Carol Dole (Jacksonville University), and Svitlana
Maksymenko (University of Pittsburgh) worked to improve the Test Item Files. Mark Rush also wrote
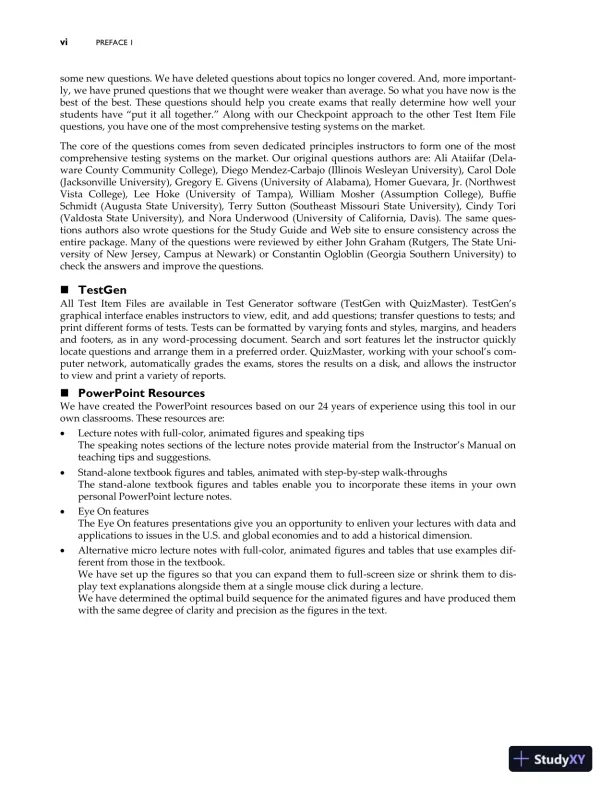
vi PREFACE 1
some new questions. We have deleted questions about topics no longer covered. And, more important-
ly, we have pruned questions that we thought were weaker than average. So what you have now is the
best of the best. These questions should help you create exams that really determine how well your
students have “put it all together.” Along with our Checkpoint approach to the other Test Item File
questions, you have one of the most comprehensive testing systems on the market.
The core of the questions comes from seven dedicated principles instructors to form one of the most
comprehensive testing systems on the market. Our original questions authors are: Ali Ataiifar (Dela-
ware County Community College), Diego Mendez-Carbajo (Illinois Wesleyan University), Carol Dole
(Jacksonville University), Gregory E. Givens (University of Alabama), Homer Guevara, Jr. (Northwest
Vista College), Lee Hoke (University of Tampa), William Mosher (Assumption College), Buffie
Schmidt (Augusta State University), Terry Sutton (Southeast Missouri State University), Cindy Tori
(Valdosta State University), and Nora Underwood (University of California, Davis). The same ques-
tions authors also wrote questions for the Study Guide and Web site to ensure consistency across the
entire package. Many of the questions were reviewed by either John Graham (Rutgers, The State Uni-
versity of New Jersey, Campus at Newark) or Constantin Ogloblin (Georgia Southern University) to
check the answers and improve the questions.
◼ TestGen
All Test Item Files are available in Test Generator software (TestGen with QuizMaster). TestGen’s
graphical interface enables instructors to view, edit, and add questions; transfer questions to tests; and
print different forms of tests. Tests can be formatted by varying fonts and styles, margins, and headers
and footers, as in any word-processing document. Search and sort features let the instructor quickly
locate questions and arrange them in a preferred order. QuizMaster, working with your school’s com-
puter network, automatically grades the exams, stores the results on a disk, and allows the instructor
to view and print a variety of reports.
◼ PowerPoint Resources
We have created the PowerPoint resources based on our 24 years of experience using this tool in our
own classrooms. These resources are:
• Lecture notes with full-color, animated figures and speaking tips
The speaking notes sections of the lecture notes provide material from the Instructor’s Manual on
teaching tips and suggestions.
• Stand-alone textbook figures and tables, animated with step-by-step walk-throughs
The stand-alone textbook figures and tables enable you to incorporate these items in your own
personal PowerPoint lecture notes.
• Eye On features
The Eye On features presentations give you an opportunity to enliven your lectures with data and
applications to issues in the U.S. and global economies and to add a historical dimension.
• Alternative micro lecture notes with full-color, animated figures and tables that use examples dif-
ferent from those in the textbook.
We have set up the figures so that you can expand them to full-screen size or shrink them to dis-
play text explanations alongside them at a single mouse click during a lecture.
We have determined the optimal build sequence for the animated figures and have produced them
with the same degree of clarity and precision as the figures in the text.
Loading page 4...
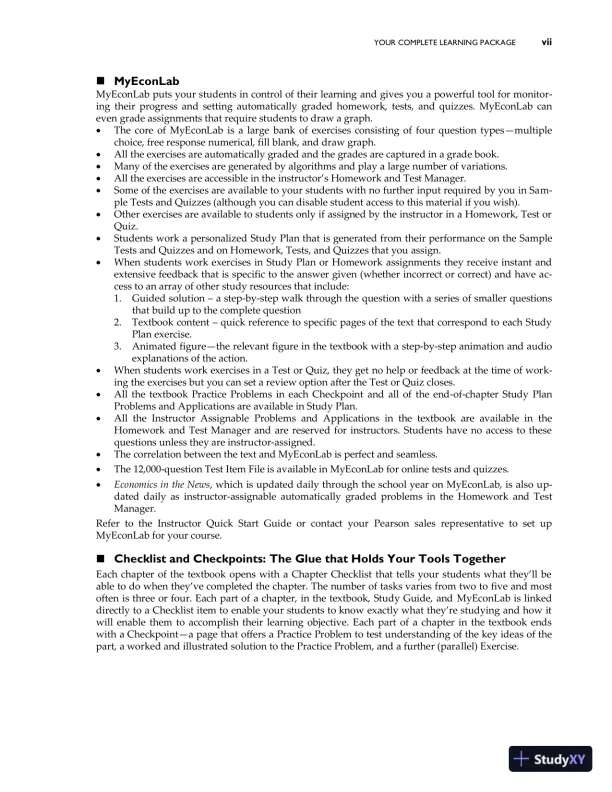
YOUR COMPLETE LEARNING PACKAGE vii
◼ MyEconLab
MyEconLab puts your students in control of their learning and gives you a powerful tool for monitor-
ing their progress and setting automatically graded homework, tests, and quizzes. MyEconLab can
even grade assignments that require students to draw a graph.
• The core of MyEconLab is a large bank of exercises consisting of four question types—multiple
choice, free response numerical, fill blank, and draw graph.
• All the exercises are automatically graded and the grades are captured in a grade book.
• Many of the exercises are generated by algorithms and play a large number of variations.
• All the exercises are accessible in the instructor’s Homework and Test Manager.
• Some of the exercises are available to your students with no further input required by you in Sam-
ple Tests and Quizzes (although you can disable student access to this material if you wish).
• Other exercises are available to students only if assigned by the instructor in a Homework, Test or
Quiz.
• Students work a personalized Study Plan that is generated from their performance on the Sample
Tests and Quizzes and on Homework, Tests, and Quizzes that you assign.
• When students work exercises in Study Plan or Homework assignments they receive instant and
extensive feedback that is specific to the answer given (whether incorrect or correct) and have ac-
cess to an array of other study resources that include:
1. Guided solution – a step-by-step walk through the question with a series of smaller questions
that build up to the complete question
2. Textbook content – quick reference to specific pages of the text that correspond to each Study
Plan exercise.
3. Animated figure—the relevant figure in the textbook with a step-by-step animation and audio
explanations of the action.
• When students work exercises in a Test or Quiz, they get no help or feedback at the time of work-
ing the exercises but you can set a review option after the Test or Quiz closes.
• All the textbook Practice Problems in each Checkpoint and all of the end-of-chapter Study Plan
Problems and Applications are available in Study Plan.
• All the Instructor Assignable Problems and Applications in the textbook are available in the
Homework and Test Manager and are reserved for instructors. Students have no access to these
questions unless they are instructor-assigned.
• The correlation between the text and MyEconLab is perfect and seamless.
• The 12,000-question Test Item File is available in MyEconLab for online tests and quizzes.
• Economics in the News, which is updated daily through the school year on MyEconLab, is also up-
dated daily as instructor-assignable automatically graded problems in the Homework and Test
Manager.
Refer to the Instructor Quick Start Guide or contact your Pearson sales representative to set up
MyEconLab for your course.
◼ Checklist and Checkpoints: The Glue that Holds Your Tools Together
Each chapter of the textbook opens with a Chapter Checklist that tells your students what they’ll be
able to do when they’ve completed the chapter. The number of tasks varies from two to five and most
often is three or four. Each part of a chapter, in the textbook, Study Guide, and MyEconLab is linked
directly to a Checklist item to enable your students to know exactly what they’re studying and how it
will enable them to accomplish their learning objective. Each part of a chapter in the textbook ends
with a Checkpoint—a page that offers a Practice Problem to test understanding of the key ideas of the
part, a worked and illustrated solution to the Practice Problem, and a further (parallel) Exercise.
Loading page 5...
viii PREFACE 1
Our Checkpoints enable students to review material when it’s fresh in their minds. We suggest that
you encourage your students to work the Checkpoints and if possible, devote some class time to work-
ing sample problems with them. The Test Item Files are organized by Checkpoints so that you can
match your tests and exam papers closely to the parts of each chapter that you’ve emphasized most.
◼ Instructor’s Resource Disk
This disk contains the Instructor’s Manual and Solutions Manual in Microsoft Word and PDF formats.
It also contains the Computerized Test Item Files (with a TestGen program installer) and PowerPoint
resources. It is compatible with both Windows and Macintosh operating systems.
◼ Instructors Tell Us What Works for You
Please tell us the tools that you find most helpful. And tell us what you think we can improve. You can
email us at robin@econ100.com or michael.parkin@uwo.ca, or use “Consult the Authors” on
MyEconLab.
Robin Bade
Michael Parkin
Ontario, Canada
February, 2017
Loading page 6...
YOUR COMPLETE LEARNING PACKAGE ix
YOUR INSTRUCTOR’S MANUAL AND SOLUTIONS MANUAL
Robin and Michael just presented an overview of the tools available to help you with your course. Per-
sonally, I think that the existence of these tools is incredibly good timing because at no time in history
has teaching your students the principles of economics been either more challenging or more im-
portant. Similar to all the resources available to qualified adopters of Essential Foundations of Economics,
the Instructor’s Manual and the Solutions Manual are designed to assist you in your teaching, so I
want to spend some time discussing them in more detail. Let me start with the Instructor’s Manual.
◼ Instructor’s Manual
The Instructor’s Manual is your one-stop package of material you need for your lectures. I have de-
scribed what is contained in your Instructor’s Manual and given some suggested uses below.
Chapter Outline
Leading off is a brief outline of the chapter. This section is designed to help you as you rush off to class
and need one last glance to discover whether a certain topic is covered in the chapter. The outline is
brief, highlighting the major headings in the book. The extended lecture outline, presented later in this
Instructor’s Manual, is a more complete outline.
Chapter Roadmap
The Chapter Roadmap has four concise sections that let you see how the current chapter fits into the
flow of the material. One section covers “What’s New in this Edition;” another “Where We Are;” an-
other, “Where We’ve Been;” and the fourth, “Where We’re Going.” This section is designed as a lecture
helper, so if you need to determine how the chapter fits into the scheme of things, turn here.
Class Time Needed
This short section can be extremely valuable, particularly if during the term you run out of time before
you run out of material! The Class Time Needed section presents a careful estimate of how many 50-
minute lectures are usually needed to cover a particular chapter. These times are just estimates, but
they are the results of consideration by several experienced instructors. There is nothing wrong with
using more time or less time, depending on your interests and the class’s participation.
Chapter Lecture
This section contains complete lecture notes that you can immediately use in your lecture or simply
reference to help prepare your own lecture notes. This material might well be the most valuable sec-
tion in the Instructor’s Manual when you are pressed for time and need to gather notes for your lec-
ture! Incorporated in these notes are suggested figures that you can draw, tables with numerical ex-
amples that you can use, and, in shaded boxes, suggested points to emphasize or interesting topics that
you can mention to bring your lecture to life. To help you recall what is new to the students, terms in
bold face indicate glossary terms from the textbook, which are newly introduced to the students in the
chapter. We have incorporated some additional features in these lectures:
Lecture Launchers We know how fascinating and relevant economics is. But nowadays, with so many
other events competing for our students’ attention, it is much too easy to lose out to the latest craze.
This section helps overcome this problem by presenting class-tested methods devised by award-
winning teachers that will stimulate your students’ interests. These suggestions are highlighted and
are scattered throughout the lectures. As you glance through them, you will see a variety of sugges-
tions that cover a wide range of teaching styles. Select those that work best for your style. No matter
whether or not you used the material in this section before—you definitely want to take a look at it this
Loading page 7...
x PREFACE 1
time! And if you have suggestions for other lecture launchers, please drop me a note at the e-mail ad-
dress at the end of this preface—I am collecting additional suggestions for the next edition.
Land Mines As instructors, we know that certain topics are difficult for students. Determining the best
way to present difficult material can be a hard and tricky task. These suggestions are designed to ease
this problem by using the insights of talented and experienced instructors. The landmines identify are-
as that students have found difficult to grasp and then present suggestions about how to overcome
these problems. In my career, I have taught over 60,000 students but I have found these suggestions to
be incredibly valuable and, even as I worked on this Instructors’ Manual, I adopted them into my class.
So check out the suggestions and, once again, if you have further tips please e-mail me.
“Eye On”
A wonderful feature of the textbook is the material presented in each chapter called “Eye On.” “Eye on
the U.S. Economy” describes the U.S. economy today or in the recent past. “Eye on the Global Econo-
my” and “Eye on the Past” help the student to place current and recent U.S. experience in a global and
historical perspective. And the “Eye on Your Life” helps the student relate what he or she is learning to
their own life. This material is fascinating and lends itself to further discussion or assignments so the
last section in the Instructor’s Manual presents suggestions about how you can use these “Eyes On” for
either class discussion or assignments. In either case, check out our suggestions because they can deep-
ly enrich your course!
Additional Exercises for Assignment
The last section of the Instructors Manual presents some additional discussion questions. (In previous
editions these questions had been located in the Solutions Manual.) Some of these questions are suita-
ble for essay exams; some are more open-ended and are probably best used for classroom discussion;
and some are similar to the Checkpoint Exercises. All of them are designed to make your students
think and use the material you have been teaching them. The Instructors Manual also has suggested
answers for these questions which you can use yourself or pass out to your students.
◼ Solutions Manual
The Solutions Manual has complete answers to all the Chapter Checkpoint questions. For ease of use,
the Solutions Manual reprints the questions from the textbook before the answers so you will not need
to carry both the textbook and the Solutions Manual to class in order to assign or answer the questions.
Answers to Chapter Checkpoint Problems and Applications
One of the remarkable pedagogical tools of the textbook is the Chapter Checkpoint problems and ap-
plications at the end of each chapter. Each chapter has three pages of questions; “Study Plan Problems
and Applications” on the first page can be worked by students in their MyEconLab Study Plan. “In-
structor Assignable Problems and Applications” on the other two pages are in the MyEconLab Home-
work and Test Manager.
If you prefer to assign these problems and applications as paper tests, you will appreciate the complete
answers in the Solutions Manual. You can use these answers to help you in grading assigned questions
or you can copy the answers and distribute them to your students.
Loading page 8...
YOUR COMPLETE LEARNING PACKAGE xi
ACKNOWLEDGMENTS
In a very real sense, teaching the principles of
economics is a “work in progress.” As new
insights are uncovered, as new knowledge is
developed, the principles of economics is al-
ways changing and evolving. You can be as-
sured that Bade/Parkin’s Essential Foundations
of Economics will likewise always change and
evolve to remain the best book available for
you and your students’ use. So it is with a
great deal of pleasure that we acknowledge
people who have helped create the Instruc-
tor’s Manual and Solutions Manual.
Richard Gosselin of Houston Community
College and Carol Dole of Jacksonville Uni-
versity are the authors of the first edition of
the Instructor’s Manual, which was ultimate-
ly divided into the Solutions Manual and the
Instructor’s Manual. For a past edition, Mar-
garet Anne Shannon of Gordon College and
Richard Gosselin helped revise the Instruc-
tor’s Manual. For this edition, Luke Arm-
strong of Lee College essentially wrote and
improved the Instructor’s Manual so that it
reflects the changes made in the textbook. I
updated the Solutions Manual, but in truth
the main parts of it still belong to the original
authors, Richard Gosselin and Carol Dole.
For the past editions, Pearson assembled
three very talented instructors who checked
the accuracy of the entire set of supplements.
Although not all looked explicitly at these
books, often comments made on the Study
Guide or Test Item Files helped improve the
Instructor’s Manual or Solutions Manual. So I
want to thank all of them for their help:
• Harry Ellis, University of North Texas
• John Graham, Rutgers The State Universi-
ty of New Jersey
• Kate Krause, University of New Mexico
The number of errors they found and the im-
provements they created are beyond count. I
soon learned that without their input, these
books would be very much inferior products.
And, working with each was a sheer pleas-
ure!
Jeannie Shearer-Gillmore, University of West-
ern Ontario, checked every word, every sen-
tence, every paragraph, and every page of the
books. She made a huge number of correc-
tions and comments and found an embarrass-
ingly large number of errors in the answers to
the questions in the Solutions Manual for this
edition. Jeannie’s value-added is almost be-
yond calculation. And she accomplished all
this work while basking in the Canadian win-
ter.
Even with all this help, it is undoubtedly the
case that there remains substantial room for
improvement in both the Instructor’s Manual
and Solutions Manual. Indeed, any correc-
tions, suggestions, or comments that you
might have would be greatly appreciated.
Moreover, it is extremely easy for you to
bring these to my attention. You can either
write me, at the address below, or e-mail me
at MarkRush@ufl.edu. Either way, I would
greatly appreciate hearing from you. In a bet-
ter world, there would be some compensation
offered for suggestions, corrections, and
comments you might make. Unfortunately,
this is not that better world! But I can promise
that I’ll acknowledge your help in future edi-
tions.
Mark Rush
Economics Department
University of Florida
Gainesville, Florida 32611
February, 2017
Loading page 9...
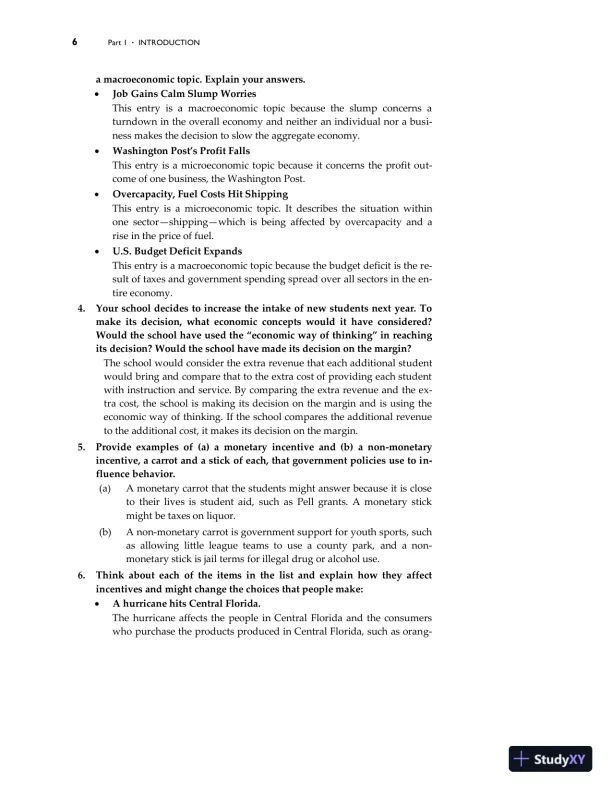
Getting
Started
Chapter
1ANSWERS TO CHAPTER CHECKPOINTS
◼ Study Plan Problems and Applications
1. Provide three examples of scarcity that illustrate why even the 1,826
billionaires in the world face scarcity.
The 1,826 billionaires might want to be able to eat unlimited meals with-
out gaining weight; live to be at least 140 years old and enjoy perfect
health everyday; be able to wake up in San Francisco and go to sleep in
Paris after spending no more than 3 hours on a plane. None of these
wants can be fulfilled given the present state of technology and resources
available.
2. Label each entry in the list as dealing with a microeconomic topic or a
macroeconomic topic. Explain your answer.
• Motor vehicles production in China is growing by 10 percent a year.
This entry is a microeconomic topic because individuals and businesses
make decisions whether to buy or sell cars.
• Coffee prices rocket.
This entry is a microeconomic topic because individuals and businesses
make decisions whether to buy or sell coffee.
• Globalization has reduced African poverty.
This entry is a macroeconomic topic because globalization is the result
of choices made by billions of people rather than an individual or busi-
ness.
• The government must cut its budget deficit.
This entry is a macroeconomic topic because neither an individual nor a
business makes decision to cut expenditures.
• Apple sells 20 million iPhone 6 smartphones a month.
This entry is a microeconomic topic because individuals and Apple
make decision whether to buy or sell iPhones.
Loading page 10...
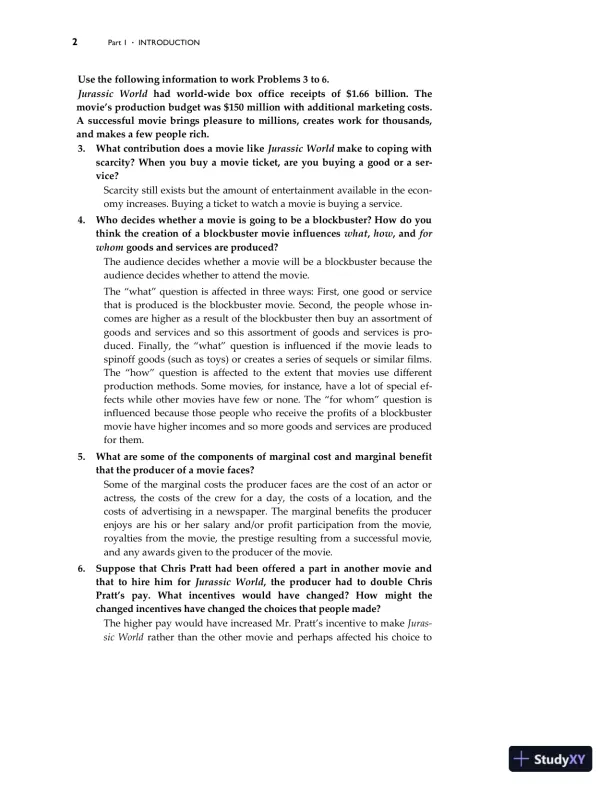
2 Part 1 . INTRODUCTION
Use the following information to work Problems 3 to 6.
Jurassic World had world-wide box office receipts of $1.66 billion. The
movie’s production budget was $150 million with additional marketing costs.
A successful movie brings pleasure to millions, creates work for thousands,
and makes a few people rich.
3. What contribution does a movie like Jurassic World make to coping with
scarcity? When you buy a movie ticket, are you buying a good or a ser-
vice?
Scarcity still exists but the amount of entertainment available in the econ-
omy increases. Buying a ticket to watch a movie is buying a service.
4. Who decides whether a movie is going to be a blockbuster? How do you
think the creation of a blockbuster movie influences what, how, and for
whom goods and services are produced?
The audience decides whether a movie will be a blockbuster because the
audience decides whether to attend the movie.
The “what” question is affected in three ways: First, one good or service
that is produced is the blockbuster movie. Second, the people whose in-
comes are higher as a result of the blockbuster then buy an assortment of
goods and services and so this assortment of goods and services is pro-
duced. Finally, the “what” question is influenced if the movie leads to
spinoff goods (such as toys) or creates a series of sequels or similar films.
The “how” question is affected to the extent that movies use different
production methods. Some movies, for instance, have a lot of special ef-
fects while other movies have few or none. The “for whom” question is
influenced because those people who receive the profits of a blockbuster
movie have higher incomes and so more goods and services are produced
for them.
5. What are some of the components of marginal cost and marginal benefit
that the producer of a movie faces?
Some of the marginal costs the producer faces are the cost of an actor or
actress, the costs of the crew for a day, the costs of a location, and the
costs of advertising in a newspaper. The marginal benefits the producer
enjoys are his or her salary and/or profit participation from the movie,
royalties from the movie, the prestige resulting from a successful movie,
and any awards given to the producer of the movie.
6. Suppose that Chris Pratt had been offered a part in another movie and
that to hire him for Jurassic World, the producer had to double Chris
Pratt’s pay. What incentives would have changed? How might the
changed incentives have changed the choices that people made?
The higher pay would have increased Mr. Pratt’s incentive to make Juras-
sic World rather than the other movie and perhaps affected his choice to
Loading page 11...
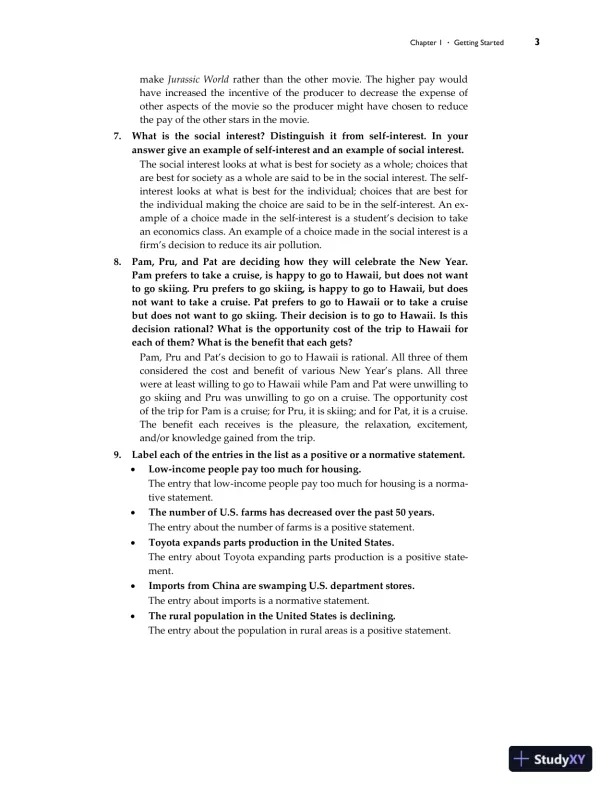
Chapter 1 . Getting Started 3
make Jurassic World rather than the other movie. The higher pay would
have increased the incentive of the producer to decrease the expense of
other aspects of the movie so the producer might have chosen to reduce
the pay of the other stars in the movie.
7. What is the social interest? Distinguish it from self-interest. In your
answer give an example of self-interest and an example of social interest.
The social interest looks at what is best for society as a whole; choices that
are best for society as a whole are said to be in the social interest. The self-
interest looks at what is best for the individual; choices that are best for
the individual making the choice are said to be in the self-interest. An ex-
ample of a choice made in the self-interest is a student’s decision to take
an economics class. An example of a choice made in the social interest is a
firm’s decision to reduce its air pollution.
8. Pam, Pru, and Pat are deciding how they will celebrate the New Year.
Pam prefers to take a cruise, is happy to go to Hawaii, but does not want
to go skiing. Pru prefers to go skiing, is happy to go to Hawaii, but does
not want to take a cruise. Pat prefers to go to Hawaii or to take a cruise
but does not want to go skiing. Their decision is to go to Hawaii. Is this
decision rational? What is the opportunity cost of the trip to Hawaii for
each of them? What is the benefit that each gets?
Pam, Pru and Pat’s decision to go to Hawaii is rational. All three of them
considered the cost and benefit of various New Year’s plans. All three
were at least willing to go to Hawaii while Pam and Pat were unwilling to
go skiing and Pru was unwilling to go on a cruise. The opportunity cost
of the trip for Pam is a cruise; for Pru, it is skiing; and for Pat, it is a cruise.
The benefit each receives is the pleasure, the relaxation, excitement,
and/or knowledge gained from the trip.
9. Label each of the entries in the list as a positive or a normative statement.
• Low-income people pay too much for housing.
The entry that low-income people pay too much for housing is a norma-
tive statement.
• The number of U.S. farms has decreased over the past 50 years.
The entry about the number of farms is a positive statement.
• Toyota expands parts production in the United States.
The entry about Toyota expanding parts production is a positive state-
ment.
• Imports from China are swamping U.S. department stores.
The entry about imports is a normative statement.
• The rural population in the United States is declining.
The entry about the population in rural areas is a positive statement.
Loading page 12...
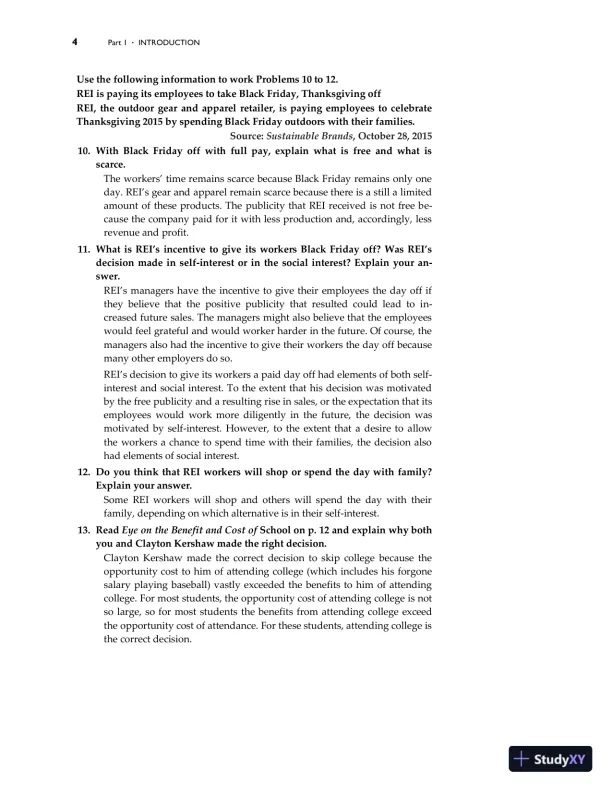
4 Part 1 . INTRODUCTION
Use the following information to work Problems 10 to 12.
REI is paying its employees to take Black Friday, Thanksgiving off
REI, the outdoor gear and apparel retailer, is paying employees to celebrate
Thanksgiving 2015 by spending Black Friday outdoors with their families.
Source: Sustainable Brands, October 28, 2015
10. With Black Friday off with full pay, explain what is free and what is
scarce.
The workers’ time remains scarce because Black Friday remains only one
day. REI’s gear and apparel remain scarce because there is a still a limited
amount of these products. The publicity that REI received is not free be-
cause the company paid for it with less production and, accordingly, less
revenue and profit.
11. What is REI’s incentive to give its workers Black Friday off? Was REI’s
decision made in self-interest or in the social interest? Explain your an-
swer.
REI’s managers have the incentive to give their employees the day off if
they believe that the positive publicity that resulted could lead to in-
creased future sales. The managers might also believe that the employees
would feel grateful and would worker harder in the future. Of course, the
managers also had the incentive to give their workers the day off because
many other employers do so.
REI’s decision to give its workers a paid day off had elements of both self-
interest and social interest. To the extent that his decision was motivated
by the free publicity and a resulting rise in sales, or the expectation that its
employees would work more diligently in the future, the decision was
motivated by self-interest. However, to the extent that a desire to allow
the workers a chance to spend time with their families, the decision also
had elements of social interest.
12. Do you think that REI workers will shop or spend the day with family?
Explain your answer.
Some REI workers will shop and others will spend the day with their
family, depending on which alternative is in their self-interest.
13. Read Eye on the Benefit and Cost of School on p. 12 and explain why both
you and Clayton Kershaw made the right decision.
Clayton Kershaw made the correct decision to skip college because the
opportunity cost to him of attending college (which includes his forgone
salary playing baseball) vastly exceeded the benefits to him of attending
college. For most students, the opportunity cost of attending college is not
so large, so for most students the benefits from attending college exceed
the opportunity cost of attendance. For these students, attending college is
the correct decision.
Loading page 13...
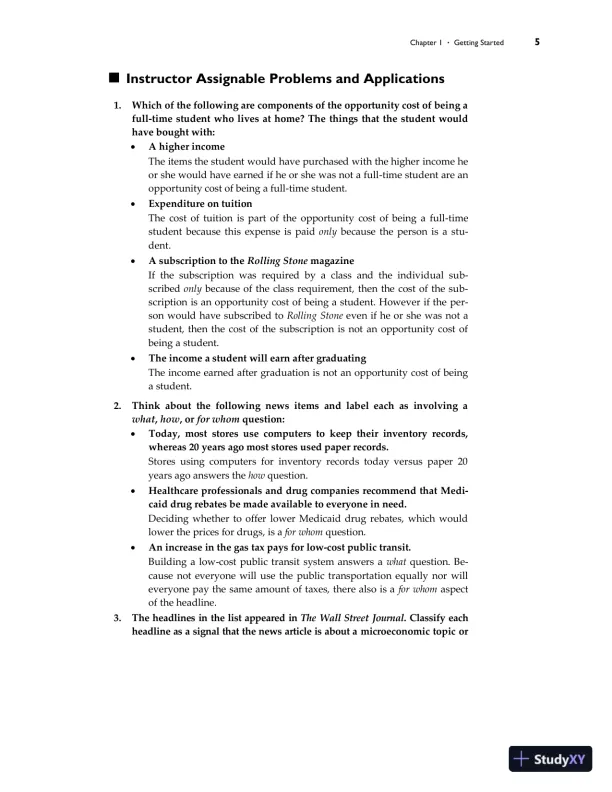
Chapter 1 . Getting Started 5
◼ Instructor Assignable Problems and Applications
1. Which of the following are components of the opportunity cost of being a
full-time student who lives at home? The things that the student would
have bought with:
• A higher income
The items the student would have purchased with the higher income he
or she would have earned if he or she was not a full-time student are an
opportunity cost of being a full-time student.
• Expenditure on tuition
The cost of tuition is part of the opportunity cost of being a full-time
student because this expense is paid only because the person is a stu-
dent.
• A subscription to the Rolling Stone magazine
If the subscription was required by a class and the individual sub-
scribed only because of the class requirement, then the cost of the sub-
scription is an opportunity cost of being a student. However if the per-
son would have subscribed to Rolling Stone even if he or she was not a
student, then the cost of the subscription is not an opportunity cost of
being a student.
• The income a student will earn after graduating
The income earned after graduation is not an opportunity cost of being
a student.
2. Think about the following news items and label each as involving a
what, how, or for whom question:
• Today, most stores use computers to keep their inventory records,
whereas 20 years ago most stores used paper records.
Stores using computers for inventory records today versus paper 20
years ago answers the how question.
• Healthcare professionals and drug companies recommend that Medi-
caid drug rebates be made available to everyone in need.
Deciding whether to offer lower Medicaid drug rebates, which would
lower the prices for drugs, is a for whom question.
• An increase in the gas tax pays for low-cost public transit.
Building a low-cost public transit system answers a what question. Be-
cause not everyone will use the public transportation equally nor will
everyone pay the same amount of taxes, there also is a for whom aspect
of the headline.
3. The headlines in the list appeared in The Wall Street Journal. Classify each
headline as a signal that the news article is about a microeconomic topic or
Loading page 14...
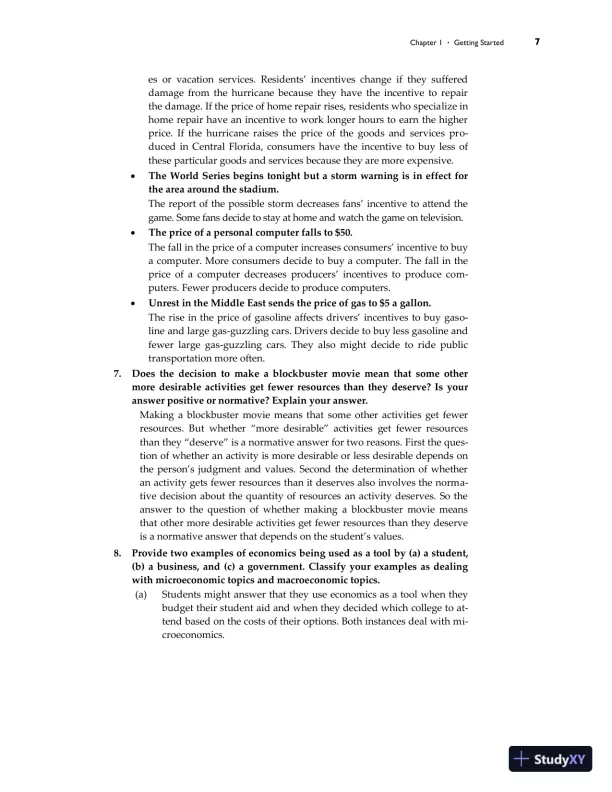
6 Part 1 . INTRODUCTION
a macroeconomic topic. Explain your answers.
• Job Gains Calm Slump Worries
This entry is a macroeconomic topic because the slump concerns a
turndown in the overall economy and neither an individual nor a busi-
ness makes the decision to slow the aggregate economy.
• Washington Post’s Profit Falls
This entry is a microeconomic topic because it concerns the profit out-
come of one business, the Washington Post.
• Overcapacity, Fuel Costs Hit Shipping
This entry is a microeconomic topic. It describes the situation within
one sector—shipping—which is being affected by overcapacity and a
rise in the price of fuel.
• U.S. Budget Deficit Expands
This entry is a macroeconomic topic because the budget deficit is the re-
sult of taxes and government spending spread over all sectors in the en-
tire economy.
4. Your school decides to increase the intake of new students next year. To
make its decision, what economic concepts would it have considered?
Would the school have used the “economic way of thinking” in reaching
its decision? Would the school have made its decision on the margin?
The school would consider the extra revenue that each additional student
would bring and compare that to the extra cost of providing each student
with instruction and service. By comparing the extra revenue and the ex-
tra cost, the school is making its decision on the margin and is using the
economic way of thinking. If the school compares the additional revenue
to the additional cost, it makes its decision on the margin.
5. Provide examples of (a) a monetary incentive and (b) a non-monetary
incentive, a carrot and a stick of each, that government policies use to in-
fluence behavior.
(a) A monetary carrot that the students might answer because it is close
to their lives is student aid, such as Pell grants. A monetary stick
might be taxes on liquor.
(b) A non-monetary carrot is government support for youth sports, such
as allowing little league teams to use a county park, and a non-
monetary stick is jail terms for illegal drug or alcohol use.
6. Think about each of the items in the list and explain how they affect
incentives and might change the choices that people make:
• A hurricane hits Central Florida.
The hurricane affects the people in Central Florida and the consumers
who purchase the products produced in Central Florida, such as orang-
Loading page 15...
Chapter 1 . Getting Started 7
es or vacation services. Residents’ incentives change if they suffered
damage from the hurricane because they have the incentive to repair
the damage. If the price of home repair rises, residents who specialize in
home repair have an incentive to work longer hours to earn the higher
price. If the hurricane raises the price of the goods and services pro-
duced in Central Florida, consumers have the incentive to buy less of
these particular goods and services because they are more expensive.
• The World Series begins tonight but a storm warning is in effect for
the area around the stadium.
The report of the possible storm decreases fans’ incentive to attend the
game. Some fans decide to stay at home and watch the game on television.
• The price of a personal computer falls to $50.
The fall in the price of a computer increases consumers’ incentive to buy
a computer. More consumers decide to buy a computer. The fall in the
price of a computer decreases producers’ incentives to produce com-
puters. Fewer producers decide to produce computers.
• Unrest in the Middle East sends the price of gas to $5 a gallon.
The rise in the price of gasoline affects drivers’ incentives to buy gaso-
line and large gas-guzzling cars. Drivers decide to buy less gasoline and
fewer large gas-guzzling cars. They also might decide to ride public
transportation more often.
7. Does the decision to make a blockbuster movie mean that some other
more desirable activities get fewer resources than they deserve? Is your
answer positive or normative? Explain your answer.
Making a blockbuster movie means that some other activities get fewer
resources. But whether “more desirable” activities get fewer resources
than they “deserve” is a normative answer for two reasons. First the ques-
tion of whether an activity is more desirable or less desirable depends on
the person’s judgment and values. Second the determination of whether
an activity gets fewer resources than it deserves also involves the norma-
tive decision about the quantity of resources an activity deserves. So the
answer to the question of whether making a blockbuster movie means
that other more desirable activities get fewer resources than they deserve
is a normative answer that depends on the student’s values.
8. Provide two examples of economics being used as a tool by (a) a student,
(b) a business, and (c) a government. Classify your examples as dealing
with microeconomic topics and macroeconomic topics.
(a) Students might answer that they use economics as a tool when they
budget their student aid and when they decided which college to at-
tend based on the costs of their options. Both instances deal with mi-
croeconomics.
Loading page 16...
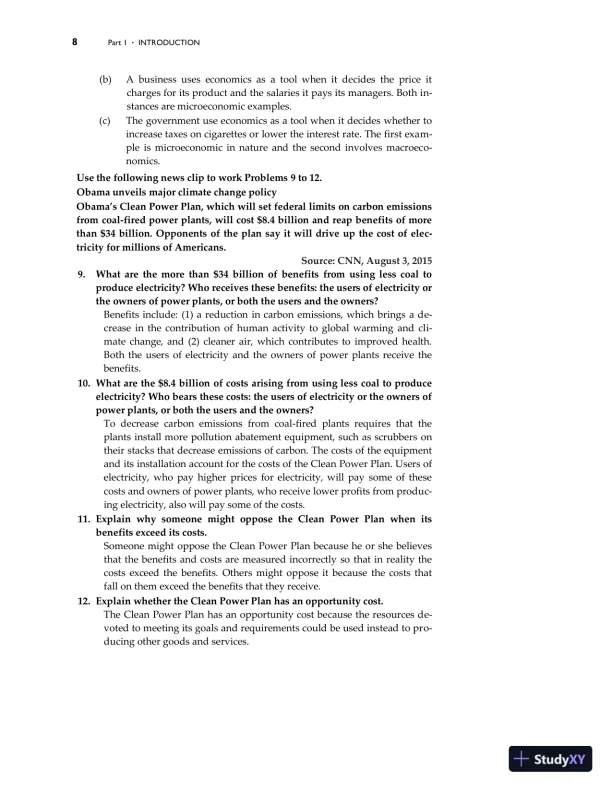
8 Part 1 . INTRODUCTION
(b) A business uses economics as a tool when it decides the price it
charges for its product and the salaries it pays its managers. Both in-
stances are microeconomic examples.
(c) The government use economics as a tool when it decides whether to
increase taxes on cigarettes or lower the interest rate. The first exam-
ple is microeconomic in nature and the second involves macroeco-
nomics.
Use the following news clip to work Problems 9 to 12.
Obama unveils major climate change policy
Obama’s Clean Power Plan, which will set federal limits on carbon emissions
from coal-fired power plants, will cost $8.4 billion and reap benefits of more
than $34 billion. Opponents of the plan say it will drive up the cost of elec-
tricity for millions of Americans.
Source: CNN, August 3, 2015
9. What are the more than $34 billion of benefits from using less coal to
produce electricity? Who receives these benefits: the users of electricity or
the owners of power plants, or both the users and the owners?
Benefits include: (1) a reduction in carbon emissions, which brings a de-
crease in the contribution of human activity to global warming and cli-
mate change, and (2) cleaner air, which contributes to improved health.
Both the users of electricity and the owners of power plants receive the
benefits.
10. What are the $8.4 billion of costs arising from using less coal to produce
electricity? Who bears these costs: the users of electricity or the owners of
power plants, or both the users and the owners?
To decrease carbon emissions from coal-fired plants requires that the
plants install more pollution abatement equipment, such as scrubbers on
their stacks that decrease emissions of carbon. The costs of the equipment
and its installation account for the costs of the Clean Power Plan. Users of
electricity, who pay higher prices for electricity, will pay some of these
costs and owners of power plants, who receive lower profits from produc-
ing electricity, also will pay some of the costs.
11. Explain why someone might oppose the Clean Power Plan when its
benefits exceed its costs.
Someone might oppose the Clean Power Plan because he or she believes
that the benefits and costs are measured incorrectly so that in reality the
costs exceed the benefits. Others might oppose it because the costs that
fall on them exceed the benefits that they receive.
12. Explain whether the Clean Power Plan has an opportunity cost.
The Clean Power Plan has an opportunity cost because the resources de-
voted to meeting its goals and requirements could be used instead to pro-
ducing other goods and services.
Loading page 17...
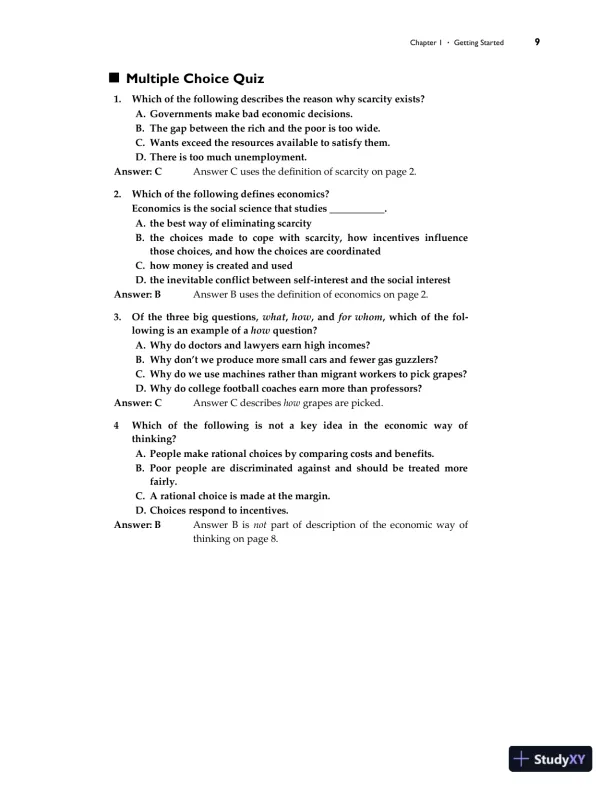
Chapter 1 . Getting Started 9
◼ Multiple Choice Quiz
1. Which of the following describes the reason why scarcity exists?
A. Governments make bad economic decisions.
B. The gap between the rich and the poor is too wide.
C. Wants exceed the resources available to satisfy them.
D. There is too much unemployment.
Answer: C Answer C uses the definition of scarcity on page 2.
2. Which of the following defines economics?
Economics is the social science that studies ___________.
A. the best way of eliminating scarcity
B. the choices made to cope with scarcity, how incentives influence
those choices, and how the choices are coordinated
C. how money is created and used
D. the inevitable conflict between self-interest and the social interest
Answer: B Answer B uses the definition of economics on page 2.
3. Of the three big questions, what, how, and for whom, which of the fol-
lowing is an example of a how question?
A. Why do doctors and lawyers earn high incomes?
B. Why don’t we produce more small cars and fewer gas guzzlers?
C. Why do we use machines rather than migrant workers to pick grapes?
D. Why do college football coaches earn more than professors?
Answer: C Answer C describes how grapes are picked.
4 Which of the following is not a key idea in the economic way of
thinking?
A. People make rational choices by comparing costs and benefits.
B. Poor people are discriminated against and should be treated more
fairly.
C. A rational choice is made at the margin.
D. Choices respond to incentives.
Answer: B Answer B is not part of description of the economic way of
thinking on page 8.
Loading page 18...
10 Part 1 . INTRODUCTION
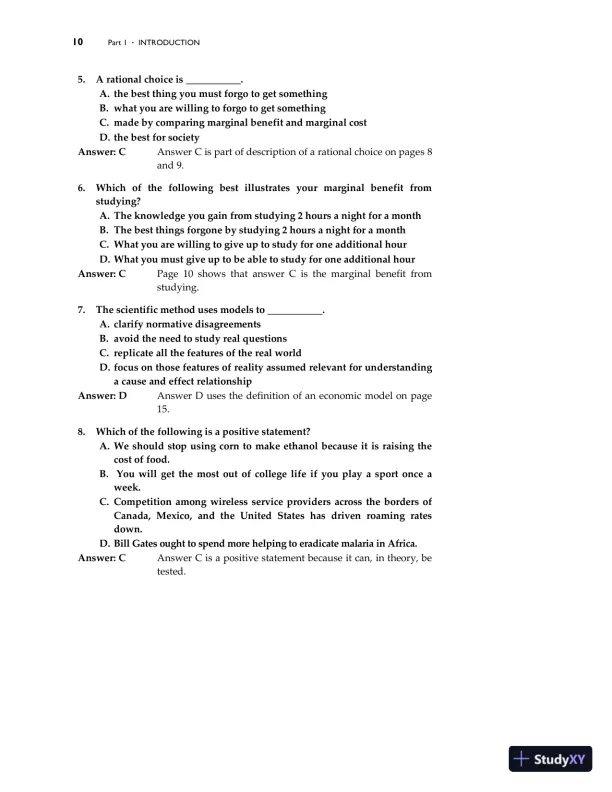
5. A rational choice is ___________.
A. the best thing you must forgo to get something
B. what you are willing to forgo to get something
C. made by comparing marginal benefit and marginal cost
D. the best for society
Answer: C Answer C is part of description of a rational choice on pages 8
and 9.
6. Which of the following best illustrates your marginal benefit from
studying?
A. The knowledge you gain from studying 2 hours a night for a month
B. The best things forgone by studying 2 hours a night for a month
C. What you are willing to give up to study for one additional hour
D. What you must give up to be able to study for one additional hour
Answer: C Page 10 shows that answer C is the marginal benefit from
studying.
7. The scientific method uses models to ___________.
A. clarify normative disagreements
B. avoid the need to study real questions
C. replicate all the features of the real world
D. focus on those features of reality assumed relevant for understanding
a cause and effect relationship
Answer: D Answer D uses the definition of an economic model on page
15.
8. Which of the following is a positive statement?
A. We should stop using corn to make ethanol because it is raising the
cost of food.
B. You will get the most out of college life if you play a sport once a
week.
C. Competition among wireless service providers across the borders of
Canada, Mexico, and the United States has driven roaming rates
down.
D. Bill Gates ought to spend more helping to eradicate malaria in Africa.
Answer: C Answer C is a positive statement because it can, in theory, be
tested.
Loading page 19...
Appendix:
Making and
Using Graphs
Chapter
1ANSWERS TO APPENDIX CHECKPOINT
◼ Study Plan Problems
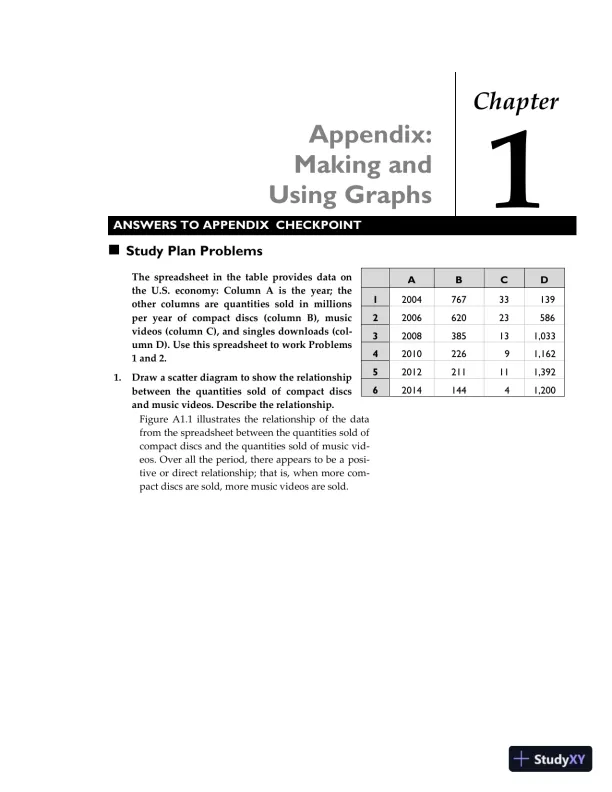
The spreadsheet in the table provides data on
the U.S. economy: Column A is the year; the
other columns are quantities sold in millions
per year of compact discs (column B), music
videos (column C), and singles downloads (col-
umn D). Use this spreadsheet to work Problems
1 and 2.
1. Draw a scatter diagram to show the relationship
between the quantities sold of compact discs
and music videos. Describe the relationship.
Figure A1.1 illustrates the relationship of the data
from the spreadsheet between the quantities sold of
compact discs and the quantities sold of music vid-
eos. Over all the period, there appears to be a posi-
tive or direct relationship; that is, when more com-
pact discs are sold, more music videos are sold.
A B C D
1 2004 767 33 139
2 2006 620 23 586
3 2008 385 13 1,033
4 2010 226 9 1,162
5 2012 211 11 1,392
6 2014 144 4 1,200
Loading page 20...
12 Part 1 . INTRODUCTION
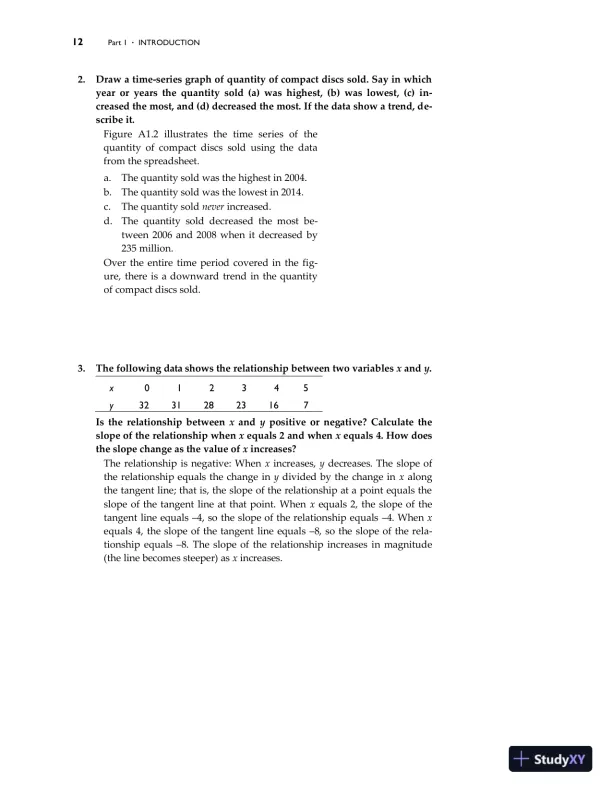
2. Draw a time-series graph of quantity of compact discs sold. Say in which
year or years the quantity sold (a) was highest, (b) was lowest, (c) in-
creased the most, and (d) decreased the most. If the data show a trend, de-
scribe it.
Figure A1.2 illustrates the time series of the
quantity of compact discs sold using the data
from the spreadsheet.
a. The quantity sold was the highest in 2004.
b. The quantity sold was the lowest in 2014.
c. The quantity sold never increased.
d. The quantity sold decreased the most be-
tween 2006 and 2008 when it decreased by
235 million.
Over the entire time period covered in the fig-
ure, there is a downward trend in the quantity
of compact discs sold.
3. The following data shows the relationship between two variables x and y.
x 0 1 2 3 4 5
y 32 31 28 23 16 7
Is the relationship between x and y positive or negative? Calculate the
slope of the relationship when x equals 2 and when x equals 4. How does
the slope change as the value of x increases?
The relationship is negative: When x increases, y decreases. The slope of
the relationship equals the change in y divided by the change in x along
the tangent line; that is, the slope of the relationship at a point equals the
slope of the tangent line at that point. When x equals 2, the slope of the
tangent line equals –4, so the slope of the relationship equals –4. When x
equals 4, the slope of the tangent line equals –8, so the slope of the rela-
tionship equals –8. The slope of the relationship increases in magnitude
(the line becomes steeper) as x increases.
Loading page 21...
Appendix 1 . Making and Using Graphs 13
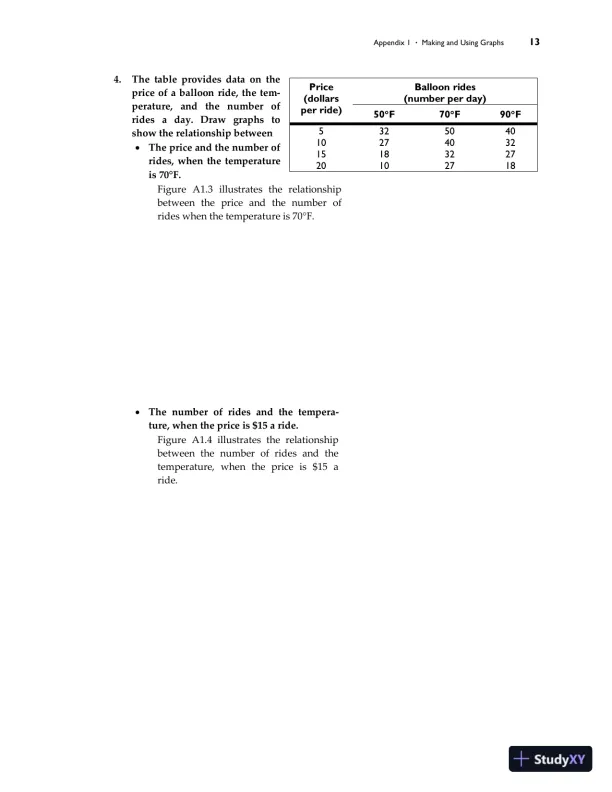
4. The table provides data on the
price of a balloon ride, the tem-
perature, and the number of
rides a day. Draw graphs to
show the relationship between
• The price and the number of
rides, when the temperature
is 70°F.
Figure A1.3 illustrates the relationship
between the price and the number of
rides when the temperature is 70°F.
• The number of rides and the tempera-
ture, when the price is $15 a ride.
Figure A1.4 illustrates the relationship
between the number of rides and the
temperature, when the price is $15 a
ride.
Price
(dollars
per ride)
Balloon rides
(number per day)
50F 70F 90F
5 32 50 40
10 27 40 32
15 18 32 27
20 10 27 18
Loading page 22...
14 Part 1 . INTRODUCTION
◼ Instructor Assignable Problems
Use the information in the table to work
Problems 1 and 2. Column A is the year; the
other columns are quantities sold in mil-
lions per year of compact discs (column B),
music videos (column C), and singles
downloads (column D).
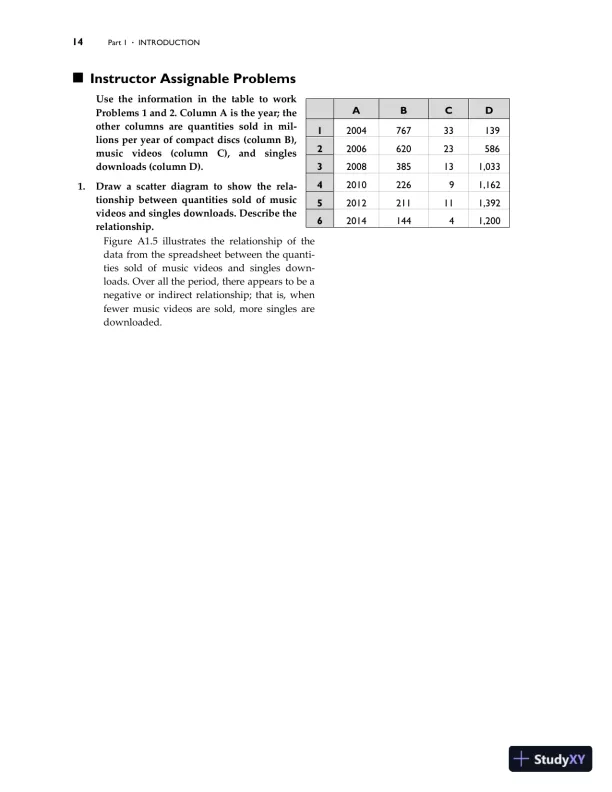
1. Draw a scatter diagram to show the rela-
tionship between quantities sold of music
videos and singles downloads. Describe the
relationship.
Figure A1.5 illustrates the relationship of the
data from the spreadsheet between the quanti-
ties sold of music videos and singles down-
loads. Over all the period, there appears to be a
negative or indirect relationship; that is, when
fewer music videos are sold, more singles are
downloaded.
A B C D
1 2004 767 33 139
2 2006 620 23 586
3 2008 385 13 1,033
4 2010 226 9 1,162
5 2012 211 11 1,392
6 2014 144 4 1,200
Loading page 23...
Appendix 1 . Making and Using Graphs 15
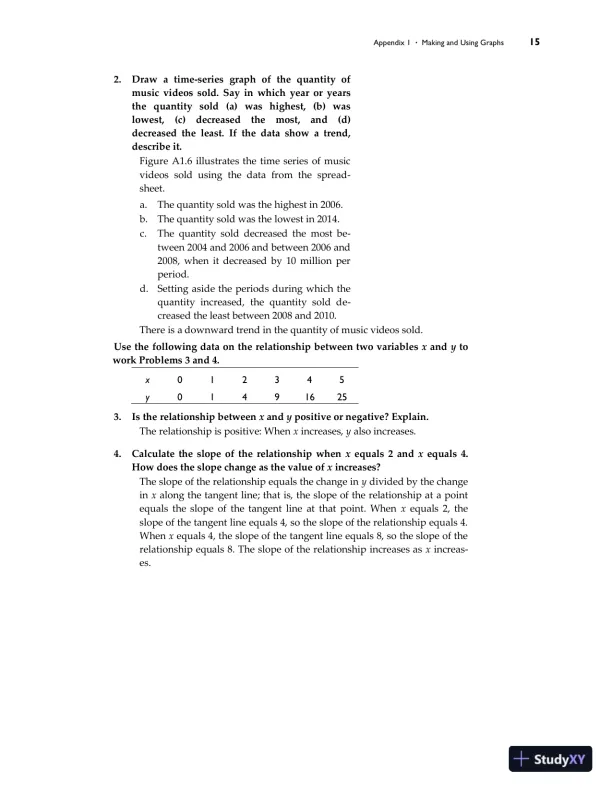
2. Draw a time-series graph of the quantity of
music videos sold. Say in which year or years
the quantity sold (a) was highest, (b) was
lowest, (c) decreased the most, and (d)
decreased the least. If the data show a trend,
describe it.
Figure A1.6 illustrates the time series of music
videos sold using the data from the spread-
sheet.
a. The quantity sold was the highest in 2006.
b. The quantity sold was the lowest in 2014.
c. The quantity sold decreased the most be-
tween 2004 and 2006 and between 2006 and
2008, when it decreased by 10 million per
period.
d. Setting aside the periods during which the
quantity increased, the quantity sold de-
creased the least between 2008 and 2010.
There is a downward trend in the quantity of music videos sold.
Use the following data on the relationship between two variables x and y to
work Problems 3 and 4.
x 0 1 2 3 4 5
y 0 1 4 9 16 25
3. Is the relationship between x and y positive or negative? Explain.
The relationship is positive: When x increases, y also increases.
4. Calculate the slope of the relationship when x equals 2 and x equals 4.
How does the slope change as the value of x increases?
The slope of the relationship equals the change in y divided by the change
in x along the tangent line; that is, the slope of the relationship at a point
equals the slope of the tangent line at that point. When x equals 2, the
slope of the tangent line equals 4, so the slope of the relationship equals 4.
When x equals 4, the slope of the tangent line equals 8, so the slope of the
relationship equals 8. The slope of the relationship increases as x increas-
es.
Loading page 24...
16 Part 1 . INTRODUCTION
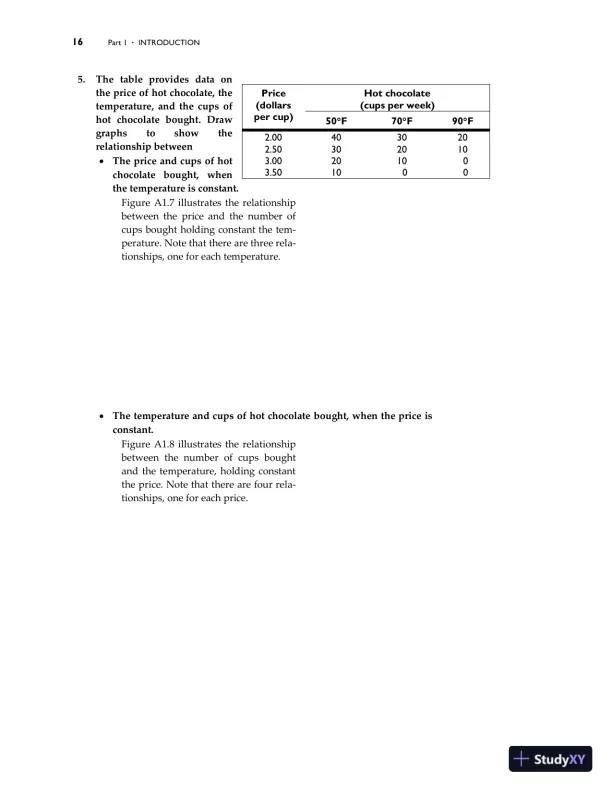
5. The table provides data on
the price of hot chocolate, the
temperature, and the cups of
hot chocolate bought. Draw
graphs to show the
relationship between
• The price and cups of hot
chocolate bought, when
the temperature is constant.
Figure A1.7 illustrates the relationship
between the price and the number of
cups bought holding constant the tem-
perature. Note that there are three rela-
tionships, one for each temperature.
• The temperature and cups of hot chocolate bought, when the price is
constant.
Figure A1.8 illustrates the relationship
between the number of cups bought
and the temperature, holding constant
the price. Note that there are four rela-
tionships, one for each price.
Price
(dollars
per cup)
Hot chocolate
(cups per week)
50F 70F 90F
2.00 40 30 20
2.50 30 20 10
3.00 20 10 0
3.50 10 0 0
Loading page 25...
The U.S.
and Global
Economies
Chapter
2ANSWERS TO CHAPTER CHECKPOINT
◼ Study Plan Problems and Applications
1. Which of the following items are not consumption goods and services?
Explain why not.
• A chocolate bar
A chocolate bar is a consumption good.
• A ski lift
A ski lift is not a consumption good. It is capital that produces a ser-
vice for skiers.
• A golf ball
A golf ball is a consumption good.
2. Which of the following items are not capital goods? Explain why not.
• An auto assembly line
An auto assembly line is a capital good.
• A shopping mall
A shopping mall is a capital good.
• A golf ball
A golf ball is not a capital good. It is a consumption good.
3. Which of the following items are not factors of production? Explain why not.
• Vans used by a baker to deliver bread
Vans used to deliver bread are capital, so they are factors of produc-
tion.
• 1,000 shares of Amazon.com stock
1,000 shares of Amazon.com stock are not a factor of production. The
shares represent partial ownership of Amazon.com and therefore are
financial capital.
• Undiscovered oil in the Arctic Ocean
Undiscovered oil is not a factor of production because it is not used to
Loading page 26...
18 Part 1 . INTRODUCTION
produce goods or services. Once it is discovered, it will become a fac-
tor of production.
4. Which factor of production earns the highest percentage of total U.S. in-
come? Define that factor of production. What is the income earned by
this factor of production called?
Labor earns by far the largest percentage of total U.S. income, 63 percent
of total income in 2014. Labor consists of the work time and the work ef-
fort that people devote to producing goods and services. The income
earned by labor is a wage.
5. With more job training and more scholarships to poor American stu-
dents, which special factor of production is likely to grow faster than in
the past?
As more people go to school and/or receive job training, the nation’s hu-
man capital will grow more rapidly. Human capital is the knowledge and
skills people obtain from education, on-the-job training, and work experi-
ence. With more job training and more scholarships, human capital will
grow more rapidly.
6. Define the factor of production called capital. Give three examples of
capital, different from those in the chapter. Distinguish between the fac-
tor of production capital and financial capital.
Capital is the tools, instruments, machines, buildings, and other items that
have been produced in the past and that businesses now use to produce
goods and services. Capital includes railroad engines and cars, servers,
and ATMs. The factor of production “capital” is the actual good itself; “fi-
nancial capital,” such as stocks and bonds, are the funds that provide
businesses with their financial resources which can be used to acquire
capital goods.
7. The pace at which new businesses are created in the U.S. economy and
the percentage of U.S. jobs in young firms has fallen.
Ryan Decker and others, “The Role of Entrepreneurship
in U.S. Job Creation and Economic Dynamism.” Journal
of Economic Perspectives, 2014.
Explain how you would expect these facts to influence what, how, and for
whom goods and services are produced in the United States
The answer to the what question changes if, as is probably the case, new
and young business produce different goods and services than more es-
tablished business. For example, new and young firms are more likely to
create apps than older and more established firms. If these groups of pro-
ducers produced their goods and services using different technologies
than the rest of the producers, then the question of how goods and ser-
vices would change. For whom goods and services are produced would
Loading page 27...
Chapter 2 . The U.S. and Global Economies 19
change if some groups of consumers prefer the goods and services pro-
duced by the new and young firms while other groups do not.
8. In the circular flow model, explain the real flow and/or the money flow
in which each item below belongs. Illustrate your answers on a circular
flow diagram.
• You buy a coffee at Starbucks.
In Figure 2.1 the
dark arrows repre-
sent money flows
and the grey arrows
represent flows of
goods and services
and factors of pro-
duction. If you buy a
coffee at Starbucks,
your expenditure is
a money flow from
households to the
goods market, la-
beled a in the figure.
• The government buys
some Dell computers.
The purchase of
computers by the
government repre-
sents a flow of com-
puters from the
goods market to the
government, labeled
b in the figure.
• A student works at a FedEx office.
The student working at FedEx is a factor of production, so the flow is
a flow of the services of factor of production from households to the
factor markets, labeled c in the figure.
• Donald Trump rents a Manhattan building to a hotel.
Donald Trump’s building in Manhattan is a factor of production, so
the flow is the services from this factor of production from house-
holds to the factor markets, labeled d in the figure.
• You pay your income tax.
Your income tax payment is a money flow from households to the
government and is labeled e in the figure.
Loading page 28...
20 Part 1 . INTRODUCTION
9. Why you can get a free college education in Germany but not in California
Even American students can get a free college degree in Germany, where
high taxes pay for colleges. Despite college being free, fewer students in
Germany earn college degrees than in the United States and more enter
vocational apprenticeships.
Source: Los Angeles Times, October 29, 2015
If California adopted the German model of higher education, how
would that change for whom goods and services are produced?
The students in California who otherwise would not have gone to col-
lege but who take advantage of the “free” college education will have
higher incomes than otherwise. Consequently, more goods and ser-
vices will be produced for them. The taxpayers who must pay the
taxes necessary to fund these college educations will have less income
to spend on goods and services, so fewer goods and services will be
produced for them.
10. Read Eye on the Dreamliner on p. 43 and then answer the following ques-
tions:
• How many firms are involved in the production of the Dreamliner
and how many are identified in the figure on p. 43?
Over 400 firms are involved in the production of the Dreamliner. On-
ly 15 of them are identified in the figure.
• Is the Dreamliner a capital good or a consumption good? Explain
why?
The Dreamliner is a capital good because it will be used to produce
services (airline travel) throughout many future years.
• State the factors of production that make the Dreamliner and provide
an example of each.
All the factors of production—land, labor, capital, and entrepreneur-
ship—are used to make the Dreamliner. The copper used for wiring is
an example of the land used; the engineer who helped design the
landing gear is an example of labor; the huge cranes that lift the vari-
ous pieces of the Dreamliner to assemble them is an example of capi-
tal; and the creative and imaginative input of Boeing’s top managers
who organize the resources used to produce the Dreamliner exempli-
fy entrepreneurship.
• Explain how the production of the Dreamliner influences what, how,
and for whom, goods and services are produced.
Dreamliner influences “what” goods and services are produced by
creating a demand for components manufactured around the world.
It influences “how: goods are produced because Boeing and the other
400 firms all determine the best way to produce each particular part
Loading page 29...
Chapter 2 . The U.S. and Global Economies 21
of the Dreamliner. It influences “for whom” because factors of pro-
duction employed to make the Dreamliner receive income from this
production, thereby increasing the quantity of goods and services
they can purchase.
• Use a graph to show where in the circular flow model of the global
economy the flows of the components listed on p. 43 appear and
where the sales of Dreamliners appear.
Except for the
components
built in the
United States,
spending on
the other
components
appear in the
flow of ex-
penditure on
U.S. imports.
Sales of
Dreamliners
appear in the
flow of ex-
penditure on
U.S. exports.
Loading page 30...
22 Part 1 . INTRODUCTION
◼ Instructor Assignable Problems and Applications
1. Boeing’s Dreamliner has had a rocky start.
• Why doesn’t Boeing manufacture all the components of the Dream-
liner at its own factory in the United States?
Boeing wants to manufacture the Dreamliner at the lowest possible
cost. It would be more expensive for Boeing to manufacture Dream-
liners at its own factory in the United States because Boeing does not
have the expertise possessed by its subcontractors and because the
wages Boeing pays U.S. workers exceed the wages its subcontractors
pays their workers.
• Describe some of the changes in what, how, and for whom, that
would occur if Boeing manufactured all the components of the
Dreamliner at its own factories in the United States.
If Boeing manufactured all the components of the Dreamliner at its
own factories in the United States, more components would be pro-
duced in the United States and more capital would have been used in
their production.
U.S. workers and investors would have received higher incomes but
the Dreamliner would cost more to produce so Boeing would have
earned a lower profit.
• State some of the tradeoffs that Boeing faces in making the Dream-
liner.
Boeing faced a huge number of tradeoffs. For example, when design-
ing the plane, Boeing’s engineers had to make decisions about fuel
economy and passenger load. Increasing the passenger load de-
creased fuel economy, so the engineers traded passenger load for fuel
economy. Another example revolves around the construction of the
Dreamliner. Boeing could have constructed the plane using just a few
companies but instead it used over 400. Boeing was trading off the
simplicity of dealing with just a handful of companies for the in-
creased specialization by dealing with many specialized companies.
• Why might Boeing’s decisions in making the Dreamliner be in the
social interest?
Building the Dreamliner itself advances the social interest because it
increases the quantity of comfortable, rapid transportation. The
amount of high-quality transportation available in the economy in-
creases, which benefits society. The decisions in making the Dream-
liner advance the social interest because they were designed to make
the Dreamliner at low cost and thereby avoid wasting resources.
2. The global economy has seen a fall in the number of landlines and rapid
growth in the number of smartphones. In the United States, 41 percent of
Loading page 31...
28 more pages available. Scroll down to load them.
Preview Mode
Sign in to access the full document!
100%
Study Now!
XY-Copilot AI
Unlimited Access
Secure Payment
Instant Access
24/7 Support
AI Assistant
Document Details
Subject
Economics