Solution Manual for Interpreting and Analyzing Financial Statements, 6th Edition

Struggling with problems? Solution Manual for Interpreting and Analyzing Financial Statements, 6th Edition provides clear, detailed solutions for better learning.

William Chen
Contributor
4.9
83
9 months ago
Preview (31 of 225 Pages)
100%
Purchase to unlock

Page 1

Solution Manual for Interpreting and Analyzing Financial Statements, 6th Edition - Page 1 preview image

Loading page image...

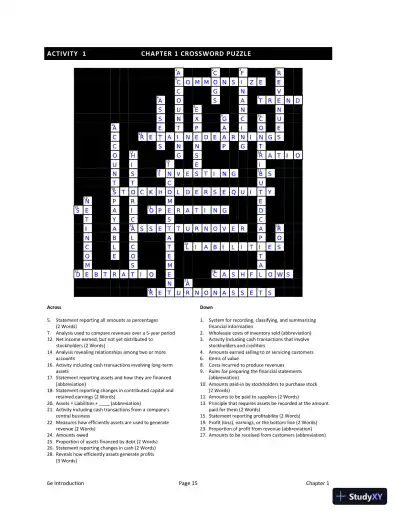
6eIntroductionPage15Chapter 1ACTIVITY1CHAPTER 1 CROSSWORD PUZZLEAcross5.Statement reporting all amounts as percentages(2 Words)7.Analysis used to compare revenues over a 5-year period12.Net income earned, but not yet distributed tostockholders (2 Words)14.Analysis revealing relationships among two or moreaccounts16.Activity including cash transactions involving long-termassets17.Statement reporting assets and how they are financed(abbreviation)18.Statement reporting changes in contributed capital andretained earnings (2 Words)20.Assets = Liabilities + ____ (abbreviation)21.Activity including cash transactions from a company'scentral business22.Measures how efficiently assets are used to generaterevenue (2 Words)24.Amounts owed25.Proportion of assets financed by debt (2 Words)26.Statement reporting changes in cash (2 Words)28.Reveals how efficiently assets generate profits(3 Words)Down1.System for recording, classifying, and summarizingfinancial information2.Wholesale costs of inventory sold (abbreviation)3.Activity including cash transactions that involvestockholders and creditors4.Amounts earned selling to or servicing customers6.Items of value8.Costs incurred to produce revenues9.Rules for preparing the financial statements(abbreviation)10.Amounts paid-in by stockholders to purchase stock(2 Words)11.Amounts to be paid to suppliers (2 Words)13.Principle that requires assets be recorded at the amountpaid for them(2 Words)15.Statement reporting profitability (2 Words)19.Profit (loss), earnings, or the bottom line (2 Words)23.Proportion of profit from revenue (abbreviation)27.Amounts to bereceived from customers (abbreviation)

Page 2

Solution Manual for Interpreting and Analyzing Financial Statements, 6th Edition - Page 2 preview image

Loading page image...

Page 3

Solution Manual for Interpreting and Analyzing Financial Statements, 6th Edition - Page 3 preview image

Loading page image...

6eIntroductionPage16Chapter 1ACTIVITY2THE FOUR FINANCIAL STATEMENTSPurpose:Identify the four financial statements.Understand the basic information provided by each financial statement.Accountingis the system of recording, classifying, and reporting financial information. Four financialstatements report this information: balance sheet, income statement, statement of stockholders’ equity,and the statement of cash flows.BALANCE SHEETAssetsLiabilitiesStockholders’ equityThe Balance Sheet (BS) provides a snapshot of a company’s financial position as of a certain date. Itreportsassets,items of value such as inventory and equipment, and whether the assets are financed withliabilities(debt) orstockholders’ equity(equity).INCOME STATEMENTRevenues(Expenses)Net incomeThe Income Statement (IS) reports the company’s profitability during an accounting period. It reportsrevenues, amounts received from customers for products sold or services provided, andexpenses,thecosts incurred to produce revenues. The difference isnetincome.STATEMENT OF STOCKHOLDERS’ EQUITYRetained earnings, beginningContributed capital, beginning+ Net income+ Issuance of shares(Dividends)(Repurchase to retire shares)Retained earnings, endingContributed capital, endingThe Statement ofStockholders’ Equity(SE) reports if theearnings(net income) of this accounting periodare distributed asdividendsor retained in the business asretained earnings.It also reportsamountspaid-in(contributed) by stockholders to purchase common stock and preferred stock.STATEMENT OF CASH FLOWSCash inflows(Cash outflows)Change in the cash accountThe Statement of Cash Flows (CF) reports cash inflows and cash outflows during an accounting period.Q1Which financial statementreports:a.whether assets are primarily financed with debt or equity?(BS/ IS /SE/ CF)b.whether the company was profitable or not?(BS /IS/SE/ CF)c.cash received from customers during the accounting period?(BS / IS /SE/CF)d.dividends declared by the boardof directors for shareholders?(BS / IS /SE/ CF)e.retained earnings at the beginning of the accountingperiod?(BS / IS /SE/ CF)f.theexpenses of a corporation?(BS /IS/SE/ CF)g.theassets of acorporation?(BS/ IS /SE/ CF)

Page 4

Solution Manual for Interpreting and Analyzing Financial Statements, 6th Edition - Page 4 preview image

Loading page image...

6eIntroductionPage17Chapter 1ACTIVITY 3BALANCE SHEETPurpose:Understand the information provided by the balance sheet.Identify asset, liability, and stockholdersequity accounts reported on thebalance sheet.Understand the accounting equation.PEPSICO (PEP*)12/25/2010BALANCE SHEET($ in millions)ASSETSLIABILITIESCash and cash equivalents$5,943Accounts payable$3,865Short-term investments426Short-term debt4,898Accounts receivable, net6,323Other current liabilities7,129Inventories3,372Long-term debt19,999Other current assets1,505Other noncurrent liabilities11,098Property, plant, and equipment, net19,058Goodwill14,661STOCKHOLDERS' EQUITYOther intangibleassets13,808Contributed capital4,449Long-term investments1,368Retained earnings37,090Other noncurrent assets1,689Treasury stock and other equity(20,375)Total Assets$68,153TotalL & SE$68,153The balance sheet reports assets and the amountof financing fromliabilities and stockholders’ equity asof a certain date.This relationship is summarized by theaccountingequation, whichis:Assets = Liabilities +Stockholders’ EquityAssetsare items of value that a corporationowns orhas a right to use. Typical asset accounts includecash, accounts receivable, inventory, equipment, buildings, and land. Accountsreceivableare amounts tobereceivedin the future from customers.Liabilitiesare amounts owed to creditors; the amount of debt owed to third parties. Typical liabilityaccounts include accounts payable, wages payable, notes payable, and bonds payable. The key wordfound in many liability accounts ispayable. Accountspayableare amounts to bepaidin the future tosuppliers.Stockholders’ Equityis the portion of assets the owners own free and clear. Stockholders’ equity may alsobe referred to as shareholders’ equity or owners’ equity.Typical stockholders’ equity accounts include:Contributed CapitalAmounts paid-in(contributed) by stockholders to purchase common stockand preferred stock.Retained EarningsNet income earned by the company since its incorporation and not yetdistributed as dividends.Q1Identify the accounting equation amounts for PepsiCo Corporation using the information above.Assets$68,153million=Liabilities$46,989million+Stockholders’ Equity$21,164millionQ2Assets can either be financed withliabilitiesorstockholder’s equity.Q3Will the accounting equation hold true for every corporation? (Yes/ No / Can’t tell)Why?Assets will always be financed by either liabilities (debt) or stockholdersequity.Assetsare either owned free and clear by the owners (equity) or financed by creditors (debt).*Stock market symbols are shown in parentheses.

Page 5

Solution Manual for Interpreting and Analyzing Financial Statements, 6th Edition - Page 5 preview image

Loading page image...

6eIntroductionPage18Chapter 1Q4PepsiCo isprimarilyfinanced with (liabilities/stockholders’equity). How can you tell?Total liabilitiesof $46,989are greater than total stockholders’ equityof $21,164.Q5Circle whether the account is classified as an (A)sset, (L)iability, or part ofStockholdersEquity (SE)on the balance sheet.a.Cash(A/ L / SE)b.Accountspayable(A /L/ SE)c.Accountsreceivable(A/ L / SE)d.Land(A/ L / SE)e.Common stock(A / L /SE)f.Equipment(A/ L / SE)g.Notes payable(A /L/ SE)h.Building(A/ L / SE)i.Retained earnings(A / L /SE)j.Inventory(A/ L / SE)k.Mortgage payable(A /L/ SE)l.Bonds payable(A /L/ SE)Q6Use PepsiCo’s balance sheet on the previous page to answer the following questions:a.What amountof cashdoes this company expect to receive from customers within the nextfew months?$6,323millionb.Thelargest asset accountisProperty, plant, and equipment, netreporting$19,058million.What types of asset costs are included in thisaccount?Answers will vary, butcouldinclude…factory equipment forproducing beverageconcentrate,bottling,andmakingsnackfood;factory,warehouse,andadministrative buildings; sales and delivery vehicles; and computer equipment.c.How much does this company currently owe suppliers?$3,865milliond.Since the company started business, what is the total amount shareholders have paid fortheir shares of stock?$4,449millione.Since the company started business, how much net income was earned and not yetdistributed asdividends?$37,090million

Page 6

Solution Manual for Interpreting and Analyzing Financial Statements, 6th Edition - Page 6 preview image

Loading page image...

6eIntroductionPage19Chapter 1ACTIVITY4INCOME STATEMENTPurpose:Understand the information reported on the income statement.Identify revenue and expense accounts reported on the income statement.PEPSICO (PEP)2010INCOME STATEMENT($ in millions)Sales revenue$57,838Cost of goods sold26,575Gross profit31,263Selling, general and administrative (SGA)expense22,326Research and developmentexpense488Other operating expenses217Incomebefore income tax8,232Provision for income tax1,912Net income$6,320The income statement reports the company’s profitability during an accounting period.Revenuesare amounts received from customers for products sold and services provided.Sales revenueandservice revenueare amounts earned engaging in the primary business activity.Expensesare the costs incurred to produce revenues. Expenses are recorded in the accounting periodthey benefit (if a cause and effect relationship exists) or are incurred (if there is no cause and effectrelationship).Cost of goods soldexpense reports the wholesale costs of inventory soldto customersduring the accounting period.Net incomeisthe difference betweenrevenuesandexpenses. Net income is also referred to asprofit(loss),earnings, or thebottom line.RevenuesExpenses = Net incomeQ1Circle whether the account is classified as a (Rev)enue, (Exp)ense,or (Not) reported on the incomestatement.a.Wage expense(Rev/Exp/ Not)d.Service revenue(Rev/ Exp/ Not)b.Inventory(Rev/ Exp/Not)e.Rent expense(Rev/Exp/ Not)c.Cost of goods sold(Rev/Exp/ Not)f.Building(Rev/ Exp/Not)Q2Review PepsiCo’s2010income statement above and answer the following questions:a.This company reports (1/2/ 3 / 4) revenue account(s)and (2/ 3 /4/5) expense accounts.b.Beverages and snacks were sold to customersfor$57,838millionthat cost the company$26,575millionto produce.c.The title of the largest expense account isCost of Goods Soldreporting$26,575million,which is typically the largest expense account for a company within the (retail/ service)industry.What specifictypes of costs would be included in this account for PepsiCo?Answers will vary, butcouldinclude …the cost ofsyrup concentration for the beverages,ingredients for snack foods, packaging materials, manufacturing labor, and othermanufacturing costs such as depreciation of PPE.d.Was PepsiCo profitable?(Yes/ No)How much profit was reported?$6,320millionQ3Net income can also be referred to as (revenues / expenses / common stock /earnings).

Page 7

Solution Manual for Interpreting and Analyzing Financial Statements, 6th Edition - Page 7 preview image

Loading page image...

6eIntroductionPage20Chapter 1ACTIVITY 5STATEMENT OFSTOCKHOLDERS’ EQUITYPurpose:Understand information provided by the Statement ofStockholders’ Equity.Understandchanges within contributed capital and retained earnings.Identify relationshipsamongthe IS, RE, and the BS.PEPSICO (PEP)2010STATEMENT OF STOCKHOLDERS’ EQUITY($ in millions)ContributedCapitalRetainedEarningsOtherEquityTotalStockholdersEquityBeginning balance$176$33,805$ (17,177)$16,804Issuance of shares4,2734,273Net income6,3206,320Dividends(3,041)(3,041)Other transactions6(3,198)(3,192)Ending balance$4,449$37,090$(20,375)$ 21,164The statement ofstockholders’ equityreports changes within thecontributed capital,retained earnings,and other equity accountsduring an accounting period.Contributed capital(CC) is increased whenadditional shares of stock are issued and decreased when those shares are retired.Retained earnings(RE)is increased bynet income(earnings) of the accounting period and decreased when earnings aredistributed asdividendsto the stockholders. Earnings not distributed as dividends are reported asretained earnings.Q1Earnings is another word for (revenue / receivables /net income).Earnings of a corporation belong to the (managers /stockholders).Earnings can either be distributed to the stockholders as (dividends/ expenses / retainedearnings) or kept in the business as (dividends / expenses /retained earnings).Q2Income statement:Revenues-Expenses=Net income/lossBalance sheet:Assets =Liabilities+StockholdersEquityStockholders’ Equity =Contributed capital+Retained Earnings+ Other EquityStatement ofSE:BegRetained Earnings+Net Income-Dividends=Ending REQ3Net income is computed on the (IS/SE/ BS) and then transferred to the Statement ofStockholders’ Equity to increase (CC /RE/Other SE). Ending retained earnings is reported on theStatement ofStockholders’ Equityand then transferred to the (IS /SE/BS).Q4Circle whether the accountis reported on theIncome Statement (IS), Statement ofStockholders’Equity(SE), orthe Balance Sheet (BS). Note:Threeamountsare reported on two statements.a.Contributed capital(IS/SE/BS)e.Sales revenue(IS/SE/BS)b.Net income(IS/SE/BS)f.Accounts receivable(IS/SE/BS)c.Dividends(IS/SE/BS)g.Wage expense(IS/SE/BS)d.Retained earnings(IS/SE/BS)h.Bonds payable(IS/SE/BS)Q5Use PepsiCo’s2010statement of stockholders’ equityabovetoanswer the following questions:a.Contributed capital reported at the end of the accounting period is$4,449million, which istheamountshareholderspaidfor(netincome/dividends/issuedshares).b.Retained earnings increased by (net income/ dividends/ issuedshares) of$6,320millionand decreased by (net income /dividends/ issuedshares) of$3,041million.c.When the company issues shares of stock, total stockholders’ equity (increases/decreases). When the company buys back shares of stock, total stockholders’ equity(increases /decreases).

Page 8

Solution Manual for Interpreting and Analyzing Financial Statements, 6th Edition - Page 8 preview image

Loading page image...

6eIntroductionPage21Chapter 1ACTIVITY6STATEMENT OFCASH FLOWSPurpose:Understand information provided by the Statement ofCash Flows.Understandthat cash flows are organized as operating, investing, and financingactivities.The statement of cash flows organizes cash inflows and cash outflows as operating activities, investingactivities, and financing activities.PEPSICO (PEP)2010STATEMENT OF CASH FLOWS($ in millions)Net cash received fromoperatingactivities (NCOA)$8,448Net cash paid forinvestingactivities (NCIA)(7,668)Net cashreceivedfromfinancingactivities (NCFA)1,386Effect of exchange rate changes(166)Change in cash2,000+Cash,beginning of the period3,943=Cash, end of the period$5,943Businessactivitiescanbeclassifiedintothreedistinctcategories:operating,investing,andfinancing.Operating Activitiesrelate to a company’s main business of selling products or services to earnnet income.Investing Activitiesrelate to the need for investing in property, plant, and equipment orexpanding by making investments in other companies.Financing Activitiesrelate to how a companyfinances its assetswith debt or stockholders’ equity. The Statement of Cash Flows describes acompany’s cash inflows and outflows for each of these three areas.Q1Use PepsiCo’s2010statement of cash flowsabovetoanswer the following questions:a.PepsiCo’s operating activities generated cashinflowsof$8,448million.b.PepsiCo purchased property, plant, and equipment, which resulted in a cash (inflow /outflow) of$7,668millionfrom (operating /investing/ financing)activities.c.PepsiCo borrowed money, which resulted in a cash (inflow/ outflow) of$1,386millionfrom (operating / investing /financing) activities.d.At the beginning of 2010, cash was$3,943million. During the year, cash (increased/decreased) by$2,000million, resulting in an ending cash balance of$5,943million.e.Cash at the end of 2010 is the (same as/ different than) cash at the beginning of 2011.Q2Circle whether the accountis reported on theIncome Statement (IS),the Balance Sheet (BS), or theStatement of Cash Flows (CF).a.Retained earnings(IS/BS/CF)e.Cash from issuing common stock(IS/BS/CF)b.Rent expense(IS/BS/CF)f.Sales revenue(IS/BS/CF)c.Rent payable(IS/BS/CF)g.Accounts receivable(IS/BS/CF)d.Cash paid for rent(IS/BS/CF)h.Cash received from customers(IS/BS/CF)

Page 9

Solution Manual for Interpreting and Analyzing Financial Statements, 6th Edition - Page 9 preview image

Loading page image...

6eIntroductionPage22Chapter 1ACTIVITY7GENERALLY ACCEPTED ACCOUNTING PRINCIPLES (GAAP)Purpose:Understand that GAAP (Generally Accepted AccountingPrinciples) are the rulesoffinancial accounting.Apply the historical cost principle.GAAP(Generally Accepted Accounting Principles) are the rules thatcompaniesmustfollowwhenpreparing financial statements.TheSEC (Securities and Exchange Commission)has legislative authority to set the reporting rulesfor accounting information of the publiclyheld corporations it regulates. It has designated GAAP tobe the official rules. The SEC provides oversight and enforcement authority over the FinancialAccounting Standards Board (FASB) and the Public Company Accounting Oversight Board (PCAOB).The seven full-time voting members of theFASB (Financial Accounting Standards Board)setaccounting reporting standards and formulate GAAP.Auditsattest to whether a company’s financial statements comply with GAAP. OnlyCPAs (CertifiedPublic Accountants), licensed by the state, can conduct the audits.Ethical behavioris defined by theAICPA’s (American Institute of CPA’s)Code of ProfessionalConduct. This code holds CPAs accountable for serving the public interest.The five full-time members of thePCAOB (Public Company Accounting Oversight Board)establishauditing standards and conduct inspections of the public accounting firms that perform audits.Q1(FASB / SEC /GAAP/ AICPA) are the rules that must be followed when preparing the financialstatements for external use.Q2GAAPstands forGenerallyAcceptedAccountingPrinciples.Q3(CPAs/ Management / Corporate accountants) conduct audits that attest towhether a company’sfinancial statements comply with GAAP.HISTORICAL COST PRINCIPLEGAAP #1: TheHistorical Cost Principlestates that assets and services should be recorded at theiracquisition cost,thus usingverifiableinformation that is themostreliableinformation.Q4An auto has a sticker price of $20,000. A company purchases the auto, but negotiates with the salesperson and pays a price of only $18,000. On the balance sheet,($18,000/ $20,000) will bereported for the auto.Thirtyyears ago,land was purchased for $2,000, which nowhas a currentmarket value of $100,000. On the balance sheet,($2,000/ $100,000)will be reported for the land.Q5When the financial statements are prepared according to GAAP, assets and services are reported attheir (acquisition cost/ current market value).Q6THINK ABOUT IT:Is knowledge of an asset’s current market value ever useful?(Yes/ No)If so, when?Knowledge of an assets current market value is valuable when buying orselling an individual asset orabusiness and when using an asset as collateral for a loan.INTERNATIONAL FINANCIAL REPORTING STANDARDS (IFRS)Q7There (are/ are not) differences among the accounting standards of different countries. IFRS areglobal accounting standards that U.S. GAAP is (converging toward/ in full compliance with).

Page 10

Solution Manual for Interpreting and Analyzing Financial Statements, 6th Edition - Page 10 preview image

Loading page image...

6eIntroductionPage23Chapter 1ACTIVITY8ANALYSIS: RATIOSPurpose:Understand that analysis reveals relationships.Explore the relationshipsamongassets, liabilities, revenues, and net income.Examine the debt ratio, ROS (return-on-sales) ratio, asset-turnover ratio, andthe ROA (return-on-asset) ratio.Thethree types of analysisare Ratio Analysis, Trend Analysis (horizontal analysis), and Common-SizeStatements(vertical analysis).Analysis reveals relationshipsby comparing amounts to:(1)other amounts for the same period (ratios and common-size statements),(2)thesame information from aprior period (trend analysis),(3)competitor information, and industry norms.RATIOSTiffany & Co(TIF),Wal-Mart Stores(WMT), andFord Motor Company(F) are well-known companies, buthow much do you really know about them?Q1FINANCIAL TRIVIAFor the fiscal years ending below, put a large circle in the box of the companythat youguesshas …a.the greatest amount ofassets. (This one is completed for you.)b.the greatest amount ofliabilities.c.the greatest amount ofrevenue.d.the greatest amount ofnet income.($ in millions)TIFJan 31, 2011WMTJan 31, 2011FDec31, 2010ASSETS$$$164,687LIABILITIES$$$All answers are acceptable. Solutions appear after Q7.REVENUE$$$NET INCOME$$$Q2FINANCIAL TRIVIAIn each large circle, place theamountthat youguessfor …a.the greatest amount ofassets. (This is completed for you.)b.the greatest amount ofliabilities.c.the greatest amount ofrevenue.d.the greatest amount ofnet income.Now turntopage25and see how well you guessed.

Page 11

Solution Manual for Interpreting and Analyzing Financial Statements, 6th Edition - Page 11 preview image

Loading page image...

6eIntroductionPage24Chapter 1Q3a.Compute the debt ratiofor each company listed below. The debt ratioreveals theproportion of assets financed with debt.Debt ratio = Total liabilities / Total assets($ in millions)Year EndedTotal AssetsTotalLiabilitiesDebtRatioTiffany & Co(TIF)1/31/2011$3,736$1,55841.70%Wal-Mart Stores (WMT)1/31/2011$180,663$112,12162.06%Ford Motor Company (F)12/31/2010$164,687$165,360100.41%b.Wal-Mart is primarily financed with (debt/ equity), resulting in a debt ratio that is(less /more) than 50.00%,whereasa companyprimarily financed withequity will have adebt ratio that is (less/ more) than 50.00%.Ford has a debt ratio greater than (50% /100%), indicating its liabilities are (greater/ less) than its assets.Q4a.Compute Returnon Sales(ROS)for each company listed below. ROSreveals the portion ofeachrevenuedollar that results in profit.ROS = Net income /Sales revenue($ in millions)Year EndedRevenueNet incomeROSTIF1/31/2011$3,085$36811.93%WMT1/31/2011$421,849$16,3893.89%F12/31/2010$128,954$6,5615.09%b.Wal-Marthas (greater/less) revenue thanTiffany & Co, butTiffany & Cohas a(higher/ lower) ROS ratio thanWal-Mart. The ROS ratio forTiffany & Coindicates11.93%of every revenue dollar resulted in profit (net income), but forWal-Martonly3.89%ofevery revenue dollar resulted in profit.c.For Wal-Mart,96.11cents of each revenue dollar went to pay for all of the costs of runningthe business, leaving3.89cents of each revenue dollar for profit.d.The corporation with the strongest ROS ratio is (TIF/ WMT / F).How can a company increase its ROS ratio?A company can increase its ROS ratio by reducing costs and operating moreefficiently,therebyincreasingprofitforagivenamountofrevenueorbygenerating more revenue.e.Does a low ROS ratio indicate a weak corporation? (Yes /No)Why?Even though Wal-Mart has a low ROS ratio compared to Microsoft, it definitelywouldnotbeconsideredaweakcorporation.Corporationsusedifferentstrategies to generate profits (net income). Wal-Mart’s strategy is to keep priceslow to generate a large volume of sale revenue.Q5a.Compute Asset Turnoverforeach company listed below. Asset Turnoverreveals howefficiently assets are used to generate revenue.Asset Turnover = Sales Revenue / Total Assets($ in millions)Year EndedRevenueTotal AssetsAsset TurnoverTIF1/31/2011$3,085$3,7360.8257WMT1/31/2011$421,849$180,6632.3350F12/31/2010$128,954$164,6870.7830b.The assetturnover ratios computed above are in the range (less than 3/ 3 or more).c.(TIF/WMT/ F)has the strongest assetturnover, indicating the company makes profits bygenerating a large volume of revenue using relatively few assets. Wal-Mart generates$2.34in revenue for every $1 invested in assets.

Page 12

Solution Manual for Interpreting and Analyzing Financial Statements, 6th Edition - Page 12 preview image

Loading page image...

6eIntroductionPage25Chapter 1Q6a.Compute Returnon Assets(ROA)for each company listed below. ROAreveals how efficientlya company uses itsassetstogenerate profit (net income). A high ROA ratio depends onmanaging asset investments and controlling expenses to keep net income high. Analyze thecomponents, ROS and Asset Turnover, to better understand corporate strategy (product-differentiationvs.low-coststrategies).ROAisthebroadestmeasureofprofitability.ROA =Net Income / Total Assets($ in millions)Year EndedNet IncomeTotal AssetsROATIF1/31/2011$368$3,7369.85%WMT1/31/2011$16,389$180,6639.07%F12/31/2010$6,561$167,6873.91%b.For each company below,compute ROA by multiplying the two components, ReturnonSales and Asset Turnover(previously computed).ROA = ROS x Asset T/O($ in millions)Year EndedROSxAsset Turnover=ROATIF1/31/201111.93%0.82579.85%WMT1/31/20113.89%2.33509.07%F12/31/20105.09%0.7830*3.99%* Rounding errorc.The corporation with the strongest overall measure of profitability is (TIF/ WMT / F)withan ROA of9.85%indicating that for eachdollar invested in assets,the company generates,on average,9.85cents in profits.The corporation with the weakest ROA is(TIF/ WMT/F).d.Wal-Marthasa(high /low) ROS anda(high/ low) Asset Turnover, indicating that a (low-cost/ product-differentiation) strategy is used, whereasTiffany & Cohasa(high/ low)ROSanda(high/low)AssetTurnover,indicatingthata(low-cost/product-differentiation) strategy is used. Ford Motor Company has(high /low) ROS and (high /low) Asset Turnover,indicating that it is (doing well /still recovering).Q7a.Theratiothatmeasurestheabilitytotranslaterevenueintoprofitisthe(Debt /ROS/ AssetTurnover/ ROA)ratio.b.Theratiothatmeasurestheproportionofdebtusedtofinanceassetsisthe(Debt/ROS / AssetTurnover/ ROA)ratio.c.The broadest measure of profitability that can be broken down into components to betterunderstand corporate strategy is the (Debt /ROS / AssetTurnover/ROA)ratio.d.A high (Debt /ROS /Asset Turnover/ ROA)ratio indicates a high-volume strategySolutions toFINANCIAL TRIVIAQ1 and Q2.($ in millions)TIFJan 31, 2011WMTJan 31, 2011FDec 31, 2010ASSETS$3,736$180,663$164,687LIABILITIES1,558112,121165,360STOCKHOLDERS’ EQUITY2,17868,542(673)REVENUE3,085421,849128,954NET INCOME$368$16,389$6,561

Page 13

Solution Manual for Interpreting and Analyzing Financial Statements, 6th Edition - Page 13 preview image

Loading page image...

6eIntroductionPage26Chapter 1ACTIVITY 9ANALYSIS: TRENDPurpose:Prepare a trend analysis and understand theinformation provided.Atrend analysiscompares amounts of a more recent year to a base year. The base year is the earliestyear being studied. The analysis measures the percentage of change from the base year.Q1Complete the trend indexes forTotal expensesandNet incomeusingthe amounts listed below. Tocompute, divide each amount by the amount of the base yearand multiply by 100. Record theresultingtrend indexin the shaded areabelow. Use 2007as the base year.PEPSICO($ in millions)201020092008Base Year2007Sales revenue$57,838147$43,232110$43,251110$39,474100Total expenses51,51815237,28611038,10911333,794100Net income$6,320111$5,946105$5,14290$5,682100ROS10.93%13.75%11.89%14.39%Q2From 2007to 2010 sales growth for PepsiCo was 47%.During the same period, total expensesincreased52%.When net sales increase, expenses would be expected to (increase/ stay thesame / decrease). It is favorable when sales increase by47% and expenses increase at a (greater /lesser) rate than47%. From 2007to 2010(revenues /expenses) of PepsiCo increased at a greaterrate, which is (favorable /unfavorable), resulting in a (small/ large) increase in net income.Q3Assume PepsiCo had a goal of increasing profitsby 5% each year. This goal was (met/ not met).47% / 3 years ~16% > 5%Q4The best year financially for PepsiCo was (2010/2009/ 2008).Why?Both answers areacceptable:In 2009, total expenses were kept under control. Expenses increased by 10%, no morethan the 10% increase in salesrevenue.Also, expenses decreasedfrom thepreviousyear. For 2009, ROS was 13.75% comparedtoonly 10.93% for 2010.2010reported the greatest increase in revenue(47%)and net income (11%).The worst year financially for PepsiCo was (2010/ 2009/2008).Why?Expenses increased at a greater rate than revenue; expenses increased by 13%, whilesales revenue increased by only 10%, resultingin a10% decreaseinnet income since thebase year.ROS for 2008 was only 11.89% compared to 13.75% for 2009.

Page 14

Solution Manual for Interpreting and Analyzing Financial Statements, 6th Edition - Page 14 preview image

Loading page image...

6eIntroductionPage27Chapter 1Q5Completethe trend indexes forLiabilitiesandStockholders’ Equityusingthe amounts listed below.To compute, divide eachamount by the amount for the base yearand multiply by 100. Record theresultingtrend indexin the shaded areabelow. Use 2007as the base year.PEPSICO($ in millions)12/25/201012/26/200912/27/2008Base Year12/29/2007Assets$68,153197$39,848115$35,994104$34,628100Liabilities46,98927023,04413223,88813717,394100SEquity$21,164123$16,80498$12,10670$17,234100Q6The assets of PepsiCo increased by97% from 12/29/2007 to 12/25/2010, indicating PepsiCo is(growing/ shrinking). From 12/29/2007 to 12/25/2010, (assets /liabilities) increased at agreater rate, indicating the corporation is relying (more/ less) on debt to finance assets.Q7Stockholders’ equity amounts are greater than the base year on (12/25/2010/ 12/26/2009 /12/27/2008) when the trend index is (greater/ less)than 100. Stockholders’ equity amounts areless than the base year on (12/25/2010 /12/26/2009/12/27/2008) when the trend index is(greater /less)than 100.Q8It is easier toanalyze PepsiCo (before /after) preparing the trend analysis.

Page 15

Solution Manual for Interpreting and Analyzing Financial Statements, 6th Edition - Page 15 preview image

Loading page image...

6eIntroductionPage28Chapter 1ACTIVITY10ANALYSIS: COMMON-SIZE STATEMENTSPurpose:Prepare common-size statements and understand the information provided.TheCOMMON-SIZE INCOME STATEMENTcompares all amounts within one year to revenue of that sameyear. The analysis measures each income statement amount as a percentage of revenue.Q1Preparethe common-size statementsfor the Coca-Cola (KO) andtheStarbucks (SBUX) companieslisted below. To compute, divideeach amount on the income statement by sales revenue. Recordthe resultingcommon-sizepercentin the shaded area provided.2010PEPSICO (PEP)COCA-COLA (KO)STARBUCKS (SBUX)($ in millions)Amount%Amount%Amount%Sales revenue$57,838100$35,119100$10,707100Total expenses51,5188923,310669,76191Net income$6,32011$11,80934$9469Q2(PEP/ KO / SBUX) is the largest company above,reporting sales revenue of approximately $57.8(trillion /billion/ million / thousand). ROS for PepsiCo is11%or0.11in decimal form, whichindicates11cents of every dollar of sales revenue resulted in profit.ROS = NI / RevenueQ3On the common-size income statement, every amount is compared to or divided by total(assets / liabilities /sales revenue/ net income).Q4Common-size statements are helpful when comparing companies of different size.(True/ False)Q5Basedonlyonthe informationprovided above, whichcompanywould be your choice ofinvestment?(PEP /KO/ SBUX)Why?Coca-Cola’s ROS of34% is the greatest, indicating forevery dollar of sales revenue 34cents goes toward profit and 66cents towards expenses. Said another way, KO incursonly 66cents of expenses to generate each $1 of sales revenue.TheCOMMON-SIZE BALANCE SHEETcompares all amounts within one year to total assets of that sameyear. The analysis measures each balance sheet amount as a percentage of total assets.Q6Preparethe common-size statementsfor the Coca-Cola (KO) and Starbucks (SBUX) companieslisted below. To compute, divideeach amount on the balance sheet by total assets. Record theresultingcommon-sizepercentin the shaded area provided.2010PEPSICO (PEP)COCA-COLA (KO)STARBUCKS (SBUX)($ in millions)Amount%Amount%Amount%Assets$68,153100$72,921100$6,386100Liabilities46,9896941,918572,71242SEquity$21,16431$31,00343$3,67458Q7Starbucks primarily finances assets with (liabilities /stockholders’ equity). The debt ratio forStarbucks is42%,which indicates debt (liabilities) is used to finance42%of assets and equity(stockholders’ equity) is used to finance58%of assets. On the common-size balance sheet, everyamount is compared to or divided by total (assets/ liabilities).Debt Ratio = Liabilities / Assets

Page 16

Solution Manual for Interpreting and Analyzing Financial Statements, 6th Edition - Page 16 preview image

Loading page image...

6eIntroductionPage29Chapter 1COCA-COLA (KO*)12/31/2010BALANCE SHEET($ in millions)ASSETSLIABILITIESCash and cash equivalents$8,517Accounts payable$1,887Short-term investments2,820Short-term debt8,100Accounts receivable, net4,430Other currentliabilities8,521Inventories2,650Long-term debt14,041Other current assets3,162Other non-currentliabilities9,369Property, plant, and equipment, net14,727Goodwill11,665STOCKHOLDERS’EQUITYOther intangibles15,244Contributed capital10,937Long-term investments7,585Retained earnings49,278Other non-current assets2,121Other stockholdersequity(29,212)TOTAL ASSETS$72,921TOTAL L & SE$72,921COCA-COLA (KO)2010INCOME STATEMENT($ in millions)Sales revenue$35,119Cost of goods sold12,693Gross profit22,426Selling, general, and administrative expense7,199Other operating expenses6,778Nonoperating(revenues)and expenses(5,794)Income before income tax14,243Provision for income tax2,434Net income$11,809COCA-COLA (KO)2010STATEMENT OFSTOCKHOLDERS’ EQUITY($ in millions)Contributed CapitalRetained EarningsOther EquityTOTAL S/EBeginning balance$9,417$41,537$ (26,155)$24,799Issuance of shares1,5201,520Net income11,80911,809Dividends(4,068)(4,068)Other transactions(3,057)(3,057)Ending balance$10,937$49,278$(29,212)$31,003COCA-COLA (KO)2010STATEMENT OF CASH FLOWS($ in millions)Net cashreceivedfrom operating activities (NCOA)$9,532Net cashpaidfrom investing activities (NCIA)(4,405)Net cashpaidfrom financing activities (NCFA)(3,465)Effect of exchange rate changes(166)Change in cash1,496+Cash, beginning of the period7,021=Cash, end of the period$8,517

Page 17

Solution Manual for Interpreting and Analyzing Financial Statements, 6th Edition - Page 17 preview image

Loading page image...

6eIntroductionPage30Chapter 1ACTIVITY 11TEST YOUR UNDERSTANDINGPurpose:Review the four financial statements.Compute net income.Prepare and evaluate trendanalyses,common-size statements, and ratios.Q1Make the following statements true by correcting the false information.Note:There may be more than one way to correct the false information.a.The four financial statements include theincome revenuestatement, statement ofstockholders’ equity contributed capital,balance assetsheet, andthe statement ofcash flows.b.Thebalance sheet statement of cash flowsreports the assets of the business and howthose assets are financed.c.Assets are financed either by liabilities orstockholders’ equity expenses.d.AccountsreceivableRetainedearningsisanassetaccount,accountspayablereceivableisaliabilityaccount,andretainedearningsaccountspayableisastockholders’ equity account.e.Accountspayable receivableare amounts to be paid later to suppliers by the corporation.f.The statement of cash flows income statementreports cash inflows and cash outflows.g.Revenue Cashis the amount earned engaging in the primary business activity.h.Earnings is another term fornet income revenue.i.Net income distributed to shareholders is referred to asdividends contributed capital.j.Dividends arenotreported as an expense on the income statement.Q2Circle the income statementamountsand cross out amounts not reported on the incomestatement. Thencompute net income.Supply expense$ 8,000Sales revenue$100,000Notes payable30,000Common stock50,000Cost of goods sold70,000Dividends2,000Net income totals$22,000(=$100,00070,0008,000)Q3Suppose that duringthefirst year of business$100,000 of wage costs were incurred; $90,000 werepaid in cash to employees; and the remaining wages will be paid to employees on January 3 of thecoming year, the next payday. What account title and amount will be reported on the followingyear-end financial statements?a.Income Statementaccount title:Wages (expense/ payable / paid)of$100,000b.Balance Sheetaccount title:Wages(expense /payable/ paid)of$10,000c.Statement of Cash Flowsaccount title:Wages(expense / payable /paid)of$90,000

Page 18

Solution Manual for Interpreting and Analyzing Financial Statements, 6th Edition - Page 18 preview image

Loading page image...

6eIntroductionPage31Chapter 1Q4Review the 2010 Financial Statements of the Coca-Cola Company on page28to answer thefollowing questions:a.Assets$72,921million = Liabilities$41,918million + SE$31,003millionIs the accounting equation in balance?(Yes/ No)b.NetIncome of$11,809million is reported on the Income Statement. It is also reported onthe (Statement of Stockholders’ Equity/ Balance Sheet / Statement of Cash Flows).c.The ending balance of retained earnings on the Statement ofStockholders’ Equityis$49,278million. It is also reported on the (Income Statement /Balance Sheet/Statement of Cash Flows).d.Cash reportedon the Balance Sheet is$8,517million. It is alsoreported on the (IncomeStatement / Statement ofStockholders’ Equity/Statement of Cash Flows).e.Total Assets of$72,921million helped to generate Sales Revenue of$35,119million, whichresults in an Asset Turnover ratio of0.482.f.Sales Revenue of$35,119million helped to generate Net Income of$11,809million, whichresults in a ROS ratio of33.6%.g.Total Assets of$72,821million helped to generate Net Income of$11,809million, whichresults in a ROA ratio of16.2%.h.The mostcomprehensive measure of profitability is (Asset Turnover / ROS /ROA). ForCoca-Cola, ROA of16.2%= Asset Turnover of0.482xROS of33.6%indicating that a (low-cost /product-differentiation) strategy is used.Q5Complete Coca-Cola’strend indexes forTotal expensesandNet incomeusing the amounts listedbelow. Record the resultingtrend indexin the shaded area. Use 2007as the base year.Coca-Cola (KO)($ in millions)201020092008Base Year2007Sales revenue$35,119122$30,990107$31,994111$28,857100Total expenses23,31010224,16610626,18711422,876100Net income$11,809197$6,824114$5,80797$5,981100From 2007 to 2010sales revenue of Coca-Cola increased by22%while expenses increased by2%resulting in an increase in net income of97%.Coca-Cola has(kept/not kept) spending undercontrol, resulting in a (small /large) increase in net income that is (greater/ less) than theincrease in sales revenue over the same time period.

Page 19

Solution Manual for Interpreting and Analyzing Financial Statements, 6th Edition - Page 19 preview image

Loading page image...

6eIntroductionPage32Chapter 1Q6Complete Coca-Cola’scommon-size statements for 12/31/2008, 12/31/2009, and 12/31/2010using the amounts listed below. Record the resultingcommon-sizepercentin the shaded areaprovided.Coca-Cola(KO)($ in millions)Dec 31,2010%Dec 31,2009%Dec 31,2008%Dec 31,2007%Assets$72,921100$48,671100$40,519100$43,269100Liabilities41,9185723,8724920,0474921,52550SEquity$31,00343$24,79951$20,47251$21,74450On 12/31/2007,50%ofassets were financed with liabilitiesand on 12/31/2010assets wereprimarilyfinancedwith (liabilities/ stockholders’ equity), indicating that on 12/31/2010 thiscompany is relying (more/ less) on debt tofinance assets.In the common-sizebalance sheet, every amount is compared toor divided bytotal assets.In the common-sizeincome statement, every amount is compared to or divided byrevenue.Q7To answer the following questions, use the chart belowthat presents financial information forPepsiCo, Coca-Cola, and ratio averages for the beverage industry.($ in millions)PEP12/25/2010KO12/31/2010BeverageIndustry AverageAssets$68,153$72,921NALiabilities46,98941,918NAStockholders’ Equity21,16431,003NARevenue57,83835,119NANet Income$6,320$11,809NAROS10.93%33.63%19%Asset Turnover0.84860.48160.80ROA9.27%16.19%15%Debt Ratio68.95%57.48%74%a.(PEP /KO) has a stronger ROS,indicating it generates more (expense /profit) from eachdollar of revenue.b.(PEP/ KO) reports the greatest volume of sales as indicated by the (ROS /Asset Turnover/ ROA) ratio.c.The most comprehensive measure of profitability, the (ROS / Asset Turnover /ROA) ratio,indicates (PEP /KO) is the more profitable company.d.(PEP / KO/ both /neither) are at greater financial risk than average for the beverageindustry, which is indicated by the (ROS / Asset Turnover / ROA/Debt) ratio.Q8Are Generally Accepted Accounting Principles (GAAP) necessary?(Yes/ No)Why or why not?Yes, rules are needed so that different companies report items in similar ways.Thisenables the public to understand the financial statements and compare companies.

Page 20

Solution Manual for Interpreting and Analyzing Financial Statements, 6th Edition - Page 20 preview image

Loading page image...

6e Balance SheetPage45Chapter 2ACTIVITY12CROSSWORD PUZZLE FOR CHAPTER 2Across5.Lends money6.Extra value recorded when buying another company8.Reports assets, liabilities, andstockholdersequity(2 words)9.Investments available forquickliquidation (2 words)12.Patents, copyrights, and brand names13.Accounts payable is a _____ account16.Buildings, equipment, and land (abbreviation)17.Cost allocation20.Acquisition Cost less Accumulated Depreciation(2 words)22.Owners of a corporation23.Income tax amounts to be paid later24.Money in the bank25.Ratio that measures the ability to pay current liabilitieswith current assets26.Total liabilities divided by total assets (2 words)Down1.Amounts owedto suppliers (2 words)2.Distribution of earnings3.Merchandise held for sale4.Borrows money7.Ratios that measure the ability to pay liabilities as theycome due9.Lawsuits andother events that could create newliabilities for the company10.Inventory is an _____ account11.Total amount of depreciation expensed since the assets'date of purchase14.Monies to be received from customers15.Equipment is a _____ asset account, which is used formore than one year18.Ratios that measurethe ability to pay liabilities for manyyears19.Balance Sheet reporting all amounts as a percentage oftotal assets (2 words)21.Liabilities due within 12 months

Page 21

Solution Manual for Interpreting and Analyzing Financial Statements, 6th Edition - Page 21 preview image

Loading page image...

6e Balance SheetPage46Chapter 2ACTIVITY13THE CLASSIFIED BALANCE SHEETPurpose:Identify account classifications typically used on the balance sheet.STARBUCKS (SBUX)10/02/2011BALANCE SHEET($ in millions)ASSETSLIABILITIESCash and cash equivalents$1,148.1Accounts payable$540.0Short-term investments902.6Short-term debt0.0Accounts receivable385.6Other current liabilities1,535.8Inventories965.8Long-term debt549.5Other current assets392.8Other noncurrentliabilities350.2PPE, net2,355.0STOCKHOLDERSEQUITYGoodwilland intangibles433.5Contributed capital41.2Long-term investments479.3Retained earnings4,297.4Other noncurrent assets297.7Other stockholdersequity46.3TOTAL ASSETS$7,360.4TOTAL L & SE$7,360.4A classified balance sheet breaks the three major account types (assets, liabilities, and stockholders’equity) into smaller classifications to help decision makers better understand the information presented.Typical classifications and a brief descriptionfollow.Current assets(CA) arethose assetsexpected to be converted into cash, sold, or consumed within12months.Property, plant, and equipment(PPE)summarize amounts for equipment, buildings, and land.These are long-term assets that are expected to benefit more than one accounting period.Depreciation expenseis the cost allocated to each year ofanasset’slong-termuseful life.Accumulated depreciationis the total amount of depreciation expensed since the asset’s date ofpurchase. Acquisition costaccumulated depreciation = thebook valueof PPE, which is theamount added to compute total assets on the balance sheet. Land is not depreciated.Goodwillis created when acquiring a company for an amount greater than its net assets; amountspaid for the valueofits management team, customer base, and overall reputation.Otherintangible assetsinclude amounts paid for patents, copyrights, and brand names.Other assetsarenoncurrentasset(NCA)accountssuch aslong-term investments, which are notincluded in any other asset classification.Current liabilities(CL) are amounts owed to creditors that are expected to be repaid within12months. Examples include accounts payable and short-term debt.Noncurrentliabilities(NCL)are amounts owed to creditors that are expected to be repaid in morethan12months. Examples include bonds payable and long-term debt.Contributed capital(CC)areamounts paid-in(contributed) by stockholders to purchase commonstock and preferred stock. Accounts includecapitalstock and additional-paid-in capital (APIC).Retained earnings(RE) is net income earned by the company since its incorporation and not yetdistributed as dividends.Otherstockholders’equityincludes treasury stock and adjustments to stockholders’ equity such asthe change in value of long-term investments.To answer the following questions refer to the balance sheet presented above.Q1How many accounts listed are Current Assets? (1 / 3 /5)Property, Plant, and Equipment? (1/ 3 / 5)Goodwill andIntangibles? (1/ 3 / 5)Other Assets? (1 /2/ 5)Q2Whatis thetotal amount reported for Current Liabilities?$2,075.8millionNoncurrentLiabilities?$899.7millionTotal Stockholders’ Equity?$4,384.9million

Page 22

Solution Manual for Interpreting and Analyzing Financial Statements, 6th Edition - Page 22 preview image

Loading page image...

6e Balance SheetPage47Chapter 2ACTIVITY14UNDERSTANDING THEBALANCE SHEETPurpose:Identify the value at which amounts are reported on the balance sheet.UseStarbucksbalance sheet dated10/02/2011(on the opposite page)to answer the following questions.a.How much do customers owe this company?$385.6millionb.Forinventories, $965.8million is the (acquisition cost/ current market value / can’t tell).c.Forproperty, plant,and equipment, net, $2,355.0million is the (acquisition cost / current marketvalue /book value/can’t tell).d.Whatamountofinvestmentsdoesthiscompanyintendtoholdformorethanayear?$479.3millione.(PPE /Goodwill/Long-term investments) is created when a company is acquired.f.How much does this company owe to suppliers?$540.0milliong.Current assets total$3,794.9millionand current liabilities total$2,075.8million. Current assets areused to pay off (current/ noncurrent) liabilities. This company has (sufficient/insufficient) currentassets to pay off its current liabilities.h.Noncurrent assets total$3,565.5millionand noncurrent liabilities total$899.7million. Noncurrentliabilities are used to finance (current /noncurrent) assets.i.Contributed capital represents(amounts borrowed /amountspaid-inbyshareholders/ netincome earned by the company).j.This companyis relyingprimarilyon (long-term debt/ contributed capital /retained earnings) tofinance assets, which is an (external /internal) source of financing.k.The balance sheet reports a company’s financial position (as of a certain date/ over a period oftime).l.Assets and liabilities are recorded on the balance sheet in order of (magnitude / alphabetically /liquidity), which means that (PPE /cash)willalwaysbereportedbefore (PPE/ cash).m.U.S. GAAP and IFRS treat (cash/ PPE) essentially the same. However, for (cash /PPE), IFRS allowsvaluation at fair value, whereas U.S. GAAP requires (historicalcost/ fair value).

Page 23

Solution Manual for Interpreting and Analyzing Financial Statements, 6th Edition - Page 23 preview image

Loading page image...

6e Balance SheetPage48Chapter 2ACTIVITY15UNDERSTANDING THE BALANCE SHEETPurpose:Identify the value at which amounts are reported on the balance sheet.Understand what an increase or a decrease in an account indicates.Develop strategies for analyzing the balance sheet.STARBUCKS (SBUX)BALANCE SHEET($ in millions)ASSETS10/02/201110/03/20109/27/20099/28/2008Cash and cash equivalents$1,148.1$1,164.0$599.8$269.8Short-term investments902.6285.766.352.5Accounts receivable385.6302.7271.0329.5Inventories965.8543.3664.9692.8Other current assets392.8460.7433.8403.4Property, plant, and equipment6,163.15,888.75,700.95,717.3Accumulated depreciation(3,808.1)(3,472.2)(3,164.5)(2,760.9)PPE, net2,355.02,416.52,536.42,956.4Goodwill and other intangibles433.5333.2327.3333.1Long-term investments479.3533.3423.5374.0Other noncurrent assets297.7346.5253.8(L)TOTAL ASSETS$7,360.4$6,385.9$5,576.8$5,672.6LIABILITIESAccounts payable$540.0$282.6$267.1$324.9Short-term debt0.00.00.0713.0Othercurrent liabilities1,535.81,496.51,313.91,151.8Long-term debt549.5549.4549.3549.6Other noncurrent liabilities350.2382.7400.8442.4STOCKHOLDERSEQUITYContributed capital41.2146.3187.140.1Retained earnings4,297.43,471.22,793.22,402.4Other stockholdersequity46.357.265.448.4TOTAL L & SE$7,360.4$6,385.9$5,576.8$(Z)Q1Calculate the amounts that should be reported for (L) and (Z) on the9/28/2008balance sheet:(L) =$261.1million(Z) =$5,672.6millionQ2What was the beginning balance of the inventories account for the fiscal year ended on10/02/2011?$543.3million10/03/2010?$664.9million9/27/2009?$692.8millionQ3Whatamount of property, plant, and equipment was purchased(assuming no PPE was sold)duringfiscal year ended10/02/2011?$274.4million10/03/2010?$187.8millionQ4From9/28/2008to10/02/2011accountspayable(increased/decreased),indicating(more/ less) financial risk. Thiscompany paid offaccounts payableduring fiscal years endedin(2011/2010/2009). As of10/02/2011this company owes$540.0million toits suppliers.

Page 24

Solution Manual for Interpreting and Analyzing Financial Statements, 6th Edition - Page 24 preview image

Loading page image...

6e Balance SheetPage49Chapter 2Q5TotalAssetsare(increasing/decreasing),indicatingthatthiscompanyis(expanding/ shrinking).Q6What aretotal liabilitiesfor the fiscal year endedon:10/02/2011?$2,975.5million9/28/2008?$3,181.70millionWhat is thedebt ratiofor the fiscal year ended on:10/02/2011?40.4%9/28/2008?56.1%Discuss the change in the company’suse of debt over this 4-year period.On 9/28/2008 this companyisprimarily financing assetswith debt (56.1%debt ratio),andthreeyears laterthe companyhas reduced its liabilities and isfinancingassetsprimarily with equity(40.4%debt ratio).Q7From9/28/2008 to9/27/2009, Contributed Capital (increased/ decreased), indicating thecompany(issued more stock/ purchased more assets / reported net income)during thisaccounting period.Q8Retained Earnings is (increasing/ decreasing), indicatingthecompany (issuedmore stock /purchasedmore assets /reportednet income)during this accounting period.Assuming nodividends were issued, how much net income (loss) was reported for the fiscal year ended on:10/02/2011?$826.2million10/03/2010?$678.0million9/27/2009?$390.8millionThe mostprofitable year was fiscal year ended(2011/ 2010/ 2009).Q9Develop a strategy to analyze the balance sheet. Which line would you look at first? Second? Third?Why?Answers will vary…but one possible method of analyzing the balance sheet is to firstreview the trend in total assets, and then study how those assets are financed byexamining liabilities, contributed capital, and retained earnings.Q10Review the series of balance sheets. This company appears to report a (strong/ weak) financialposition.Why? Support your response with at least two observations.Answers will vary, but should include two of the following:Total assets increased, indicating the company is expanding.The gross amount ofproperty, plant, andequipment increased, indicating thecompany is updating assets on a regular basis.The debt ratio decreased from 56.1% down to 40.4%, indicating a decrease infinancial risk. Decreasing financial risk in a volatile economycreates a strongerfinancial position.Retained earnings increased, indicating the company remained profitableduring challenging economic times.

Page 25

Solution Manual for Interpreting and Analyzing Financial Statements, 6th Edition - Page 25 preview image

Loading page image...

6e Balance SheetPage50Chapter 2ACTIVITY16DEBT VS. EQUITYPurpose:Identify the characteristics of debt and equity.Assess financial risk.Corporations externally finance the purchase of assets with debt (liabilities) or equity (common stock).Assets = Liabilities + StockholdersEquityLarge amounts ofdebtare usually issued in the form of bonds. The borrowing corporation recordsabondpayable and is referred to as thedebtor,whilethe entity loaning the money records a bond receivableand is referred to as thecreditor. The debtor must pay back the amount borrowed plus interest to thecreditor. The interest paid by the borrowing corporation is an expense that reduces taxable income. Thereturn to creditors is the interest received. Creditors are not owners of the corporation and,therefore,have no ownership rights.Equityrefers to the issuance of stock, which may be common stock or preferred stock. Entities owningshares of stock are the owners of the corporation and are referred to asstockholdersor shareholders.Stockholders’primary ownership rights include a right to vote at annual meetings and a right to a portionof the profits (net income).Dividendsare the distribution of profits to stockholders. The corporate boardof directors decides whether to pay dividends or not and has no obligation to purchase the shares of stockback from the stockholders. If stockholders sell their shares of stock, they usually sell to another investorusing a stockbroker, who in turn executes the trade on a stock exchange such as the New York StockExchange or NASDAQ. Stockholders earn a return on their investment by receiving dividends or selling thestock for a greater amount than the purchase price.The balance sheet helps investors, both creditors and stockholders, assess the degree of financial risk acorporation is assuming. In general, the more a corporation relies on debt to finance assets, the greaterthe financial risk of the corporation.($ in millions)Google (GOOG)12/31/2011GeneralMills(GIS)5/29/2011Assets$72,574$18,675Liabilities$14,429$12,309Stockholdersequity$58,145$6,366Debt ratio19.88%65.91%Q1Compute the values for (B) and (Y) in the above chart. Compute theDebt Ratioand record in theabove chart.(Debt ratio = Liabilities / Assets)This ratioquantifies the proportion of assets financedwith debt. (Google /GIS)is financing assets primarily with debt; therefore, (Google /GIS)isassuming the greater financial risk. Based only on the information presented above, whichcompany would youchoose as an investment? (Google/ GIS)Why?Google, because it has the lower debt ratio, indicating lower financial risk.Q2For each item circle the correct response when comparing the issuance of debt and equity.a.The corporation (does/ does not)have topay interest to creditors, but (does/does not)have topay dividends to shareholders.b.The corporation (must/ never has to) repay amounts borrowed from creditors, but (must /never has to) repay amounts invested by shareholders, thus the title, “contributed” capital.c.The interest expense of debt (reduces/ does not reduce) taxable income, but dividendspaid to shareholders (reduce /do not reduce) taxable income.

Page 26

Solution Manual for Interpreting and Analyzing Financial Statements, 6th Edition - Page 26 preview image

Loading page image...

6e Balance SheetPage51Chapter 2d.Issuing additional debt (does /does not) dilutecurrentshareholders’ownership, butissuing additional shares of common stock (does/ does not) dilutecurrentshareholdersownership.e.IfyouweretheCFOofacompany,howwouldyourecommendfinancingassets?Primarily with (debt/equity).Why?Either choice may be correct if supported with good reasons.The issuance ofdebtmaintains current shareholders’ ownership interest:Debt does notincrease the number of issued shares.Interest expense on debt is taxdeductible.The issuance ofequityreduces financial risk:Amounts paid-in by shareholders for capital stock never have to be paidback.Dividend payments are not required.

Page 27

Solution Manual for Interpreting and Analyzing Financial Statements, 6th Edition - Page 27 preview image

Loading page image...

6e Balance SheetPage52Chapter 2ACTIVITY17ANALYSIS: RATIOSPurpose:Understand the information provided by the current ratio and the debt ratio.Liquidity and Solvency Ratiosmeasure the ability to meet financial obligations and the level of financialrisk.TheCurrent Ratiomeasures the ability to pay current payables as they come due by comparing currentassets to current liabilities. It is a measure of short-term liquidity. A higher ratio indicates a stronger abilityto pay current debts.Current Ratio=Current assetsCurrent liabilitiesTheDebt Ratiomeasures the proportion of assets financed by debt by comparing totalliabilities to totalassets. It is a measure of long-term solvency. A higher ratio indicates greater financial risk.Debt Ratio=Total liabilitiesTotal assetsFor the year 2010IndustryAverage forRestaurantsDineEquity(DIN)DardenRestaurants(DRI)Nathan’sFamous(NATH)Current Ratio1.11.320.546.12Debt Ratio52%97%64%17%Debt-to-Equity Ratio*1.1033.171.770.20Use the chart above to answer the following questions. Stock symbols are shown in parentheses.Q1Of theabove three restaurant chains, which is your favorite? (DIN/DRI/NATH)Allresponses arecorrect.DINoperates Applebee’s Neighborhood Grill & Barand IHOP.DRIoperates Red Lobster, Olive Garden, Bahama Breeze, and Smokey Bones Barbeque and Grill.NATHoperatesNathan’s Famous.Q2(DIN/ DRI /NATH)have sufficient current assets to pay off current liabilities and,therefore, havea current ratio(greater/ less) than1.0.A current ratio that is (lower/ higher) than the industryaverage may indicate a lack of short-term liquidity, which includes (DIN/DRI/NATH). Does thisindicate that thiscorporationisinsolvent or unable to payitsbills? (Yes /No)Explain.Not necessarily.By definition, current liabilities become due within one year,andtherefore,do not all have to be paid at this time.However, they do need to be paidwhen due. Comparing a company ratio to the industry average gives a sense of how thiscompanyrankswhencomparedtootherrestaurants.Ifacompany’sratioissignificantly below the industry average, this is a warning sign and may warrant furtherinvestigation.Q3(DIN/DRI/NATH) are relying more on debt to finance assets and have a debt ratio (greater/less) than50%.Darden Restaurants is financing64%of assets with debt. For a company wanting tobe lower risk and less dependent on debt, a(n) (increasing /decreasing) trend in the debt ratio isconsidered favorable. A company that has higher financial risk will, in general, be required to pay(higher/ lower) interest rates when borrowing money.

Page 28

Solution Manual for Interpreting and Analyzing Financial Statements, 6th Edition - Page 28 preview image

Loading page image...

6e Balance SheetPage53Chapter 2Q4Whydoes a company with ahigherdebt ratio tend tohavegreaterfinancial risk?A higher debt ratio indicates greater debt.Debt is a legal liability that must be repaidplus interest. If the principalor interest cannot be repaid, then a company can be forcedinto bankruptcy and creditors may not get fully repaid.Therefore, creditors are atfinancial risk of not receiving the full amount due to them. As the amount of companydebt increases, so does the financial risk of not being able to payback that debt plusinterest when due.Q5Does a high debt ratio indicate a weak corporation? (Yes /No)Explainyour answer.The answer is no, not necessarily.Even though DineEquity has a higher debt ratio, itmaynot be considered a weak corporation.Companies use different strategies tofinance assets. Companies within a stable industry have the ability to use more debtthan companies within a volatile industry.Companies with alarge investment in PPEcan use that PPE as collateral for debt financing.Also, some corporations make thedecision to accept higher financial risk.*Instead of reporting the Debt Ratio, somefinancial sources report the Debt-to-Equity ratio, computed as liabilitiesdivided by stockholders’ equity.To convert:Debt ratio =[Debt-to-equity ratio/(1 +Debt-to-equityratio)]ForDineEquity0.97=33.17/34.17

Page 29

Solution Manual for Interpreting and Analyzing Financial Statements, 6th Edition - Page 29 preview image

Loading page image...

6e Balance SheetPage54Chapter 2ACTIVITY18ANALYSIS: TRENDPurpose:Prepare a trend analysis and understand the information provided.ATrend Analysiscompares amounts of a more recent year to a base year. The base year is theearliestyear being studied. The analysis measures the percentage of change from the base year.Q1For Starbucks, use the amounts listed below to compute the trend indexes fornoncurrent(NC)liabilities, common stock, and retained earnings by dividing each amount by the amount for thebase year. Record the resultingtrend indexin the shaded area. Use9/28/2008as the base year.STARBUCKS10/02/201110/03/20109/27/20099/28/2008($ in millions)$Trend$Trend$TrendBASE YEARCurrent assets3,794.92172,756.41582,035.81161,748.0100PPE, net2,355.0802,416.5822,536.4862,956.4100Goodwill + Intang.433.5130333.2100327.398333.1100Other assets777.0122879.8139677.3107635.1100TOTAL ASSETS7,360.41306,385.91135,576.8985,672.6100Current liabilities2,075.8951,779.1811,581.0722,189.7100NC liabilities899.791932.194950.195992.0100Common stock41.2103146.3365187.146740.1100Retained earnings4,297.41793,471.21442,793.21162,402.4100Other SE46.39657.211865.413548.4100TOTAL L and SE7,360.41306,385.91135,576.8985,672.6100Refer to the series of balance sheets and the trend analysis above to answer the following questions.Q2A trend index of130(total assets) indicates that the dollar amount is (greater/ less) than the(previous /base) year, whereasa trend index of80(PPE, net) indicates the dollar amount is(greater /less) than the (previous /base) year. Fortotal assets, the trend index of 130iscomputed by dividing $7,360.4(total assets on10/02/2011) by$5,672.6million (total assets of thebase year). A trend index of 130indicatestotalassets(increased/ decreased) by30%(from anindex of 100 to 130) from9/28/2008to10/02/2011.Q3From9/28/2008to10/02/2011, which of the following accounts increased at a greater rate thantotal assets? (Noncurrent liabilities/Common stock/Retained earnings).The assets of thiscompany areprimarilyfinanced with (liabilities / contributed capital /retained earnings). This isreferred to as (internal/ external) financingbecausethese funds are generated by operations.Issuing stocks and bonds are forms of (internal /external) financingbecausethese funds comefrom investors outside of the firm.Q4The annual total asset growth rate can be compared between companies.Assume less than 5% is low, 5to15% is moderate, andmore than15% is high.Thethree-yearaveragetotalassetgrowthrateofthiscompanyisconsidered(low /moderate/ high).(30% / 3 years = 10% <15%,but > 5%)

Page 30

Solution Manual for Interpreting and Analyzing Financial Statements, 6th Edition - Page 30 preview image

Loading page image...

6e Balance SheetPage55Chapter 2Q5Examine the financial information reported above andcommenton at least two items ofsignificance that the trend analysis helps to reveal.Answers will vary and may include two of the following…Assets increased30%over the three-year period, indicating moderate growth.SBUX has been expanding by building domestic relationships(Green MountainCoffee Roasters) andinternational joint-ventures within China and India.Themajority of asset growth wasin current assets. SBUX has greatly increasedits cash and equivalents over the past three years.PP&E has been trendingdownwards, indicating the international joint-venturesmust not include the ownership of additional PPE.Goodwill and intangibles increased at a rate equal to that of total assets,indicating growth through the acquisition of other businesses. However, theseamounts areonly a smallproportionof total assets.Both current liabilities andnoncurrent liabilitiesdecreased,indicatinglowerfinancial risk.Retained earnings increased,indicating the company remains profitable evenduring theseuncertain economic times.

Page 31

Solution Manual for Interpreting and Analyzing Financial Statements, 6th Edition - Page 31 preview image

Loading page image...

6e Balance SheetPage56Chapter 2ACTIVITY19ANALYSIS: COMMON-SIZE STATEMENTSPurpose:Prepare common-size statements and understand the information provided.TheCommon-Size Balance Sheetcompares all amounts to total assets of that same year. The analysismeasures each item as a percentage of total assets.Q1ForDineEquityandNathan’s Famouslisted below, complete the common-size statements bydividing each item on the balance sheet by the amount of total assets. Record the resultingcommon-size percentage in the shaded area provided.(Hint: Percentages for CA + PPE, net +Goodwill +Other = 100% and CL +LTD + OtherNCL+ CS + RE + Other = 100 %.)2010DineEquity(DIN)Darden Restaurants(DRI)Nathan’s Famous(NATH)($ in millions)$CS%$CS%$CS%Current assets351.012.3%678.512.9%43.8282.1%PPE, net612.221.4%3,403.764.9%5.4710.2%Goodwill+ intangibles1,533.453.7%994.919.0%1.442.7%Other assets360.012.6%170.33.2%2.634.9%TOTAL ASSETS2,856.6100.0%5,247.4100.0%53.37100.0%Current liabilities265.19.3%1,254.623.9%7.1613.4%Long-term debt2,013.070.5%1,466.327.9%0.00.0%Other NC liabilities494.717.3%632.512.1%1.913.6%Contributed capital234.58.2%2,297.943.8%52.197.6%Retained earnings124.34.3%2,621.950.0%16.831.5%Other SE(275.0)(9.6)%(3,025.8)(57.7)%(24.6)(46.1)%TOTAL L and SE2,856.6100.0%*5,247.4100.0%53.37100.0%*Note: The percentages may not sum to 100% due to rounding error.Refer to theinformationabove to answer the following questions.Q2Thedebtratio(Totalliabilities/Totalassets)forDardenRestaurantsis63.90%or0.6390(decimal form).Q3Which company finances assets primarily withamountsborrowedlongterm?(DIN/ DRI /NATH)Q4Whichcompanyfinancesassetsprimarilywithamountsinvestedbyshareholders?(DIN/ DRI /NATH)Q5Which company finances assets primarily withpast profits?(DIN/DRI/NATH)
Preview Mode

This document has 225 pages. Sign in to access the full document!

Study Now!

XY-Copilot AI
Unlimited Access
Secure Payment
Instant Access
24/7 Support
Document Chat

Document Details

Related Documents

View all