Solution Manual For Probability And Statistics For Engineers And Scientists, 9th Edition

Struggling with textbook problems? Let Solution Manual For Probability And Statistics For Engineers And Scientists, 9th Edition guide you through with clear, step-by-step solutions.

Sebastian Lopez
Contributor
4.6
30
5 months ago
Preview (16 of 256 Pages)
100%
Purchase to unlock

Page 1

Solution Manual For Probability And Statistics For Engineers And Scientists, 9th Edition - Page 1 preview image

Loading page image...

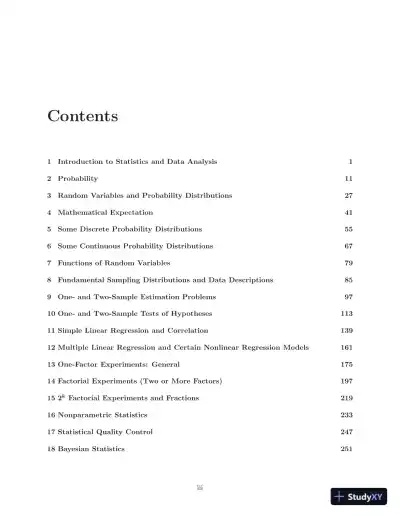
Contents1Introduction to Statistics and Data Analysis12Probability113Random Variables and Probability Distributions274Mathematical Expectation415Some Discrete Probability Distributions556Some Continuous Probability Distributions677Functions of Random Variables798Fundamental Sampling Distributions and Data Descriptions859One- and Two-Sample Estimation Problems9710 One- and Two-Sample Tests of Hypotheses11311 Simple Linear Regression and Correlation13912 Multiple Linear Regression and Certain Nonlinear Regression Models16113 One-Factor Experiments: General17514 Factorial Experiments (Two or More Factors)19715 2kFactorial Experiments and Fractions21916 Nonparametric Statistics23317 Statistical Quality Control24718 Bayesian Statistics251iii

Page 2

Solution Manual For Probability And Statistics For Engineers And Scientists, 9th Edition - Page 2 preview image

Loading page image...

Page 3

Solution Manual For Probability And Statistics For Engineers And Scientists, 9th Edition - Page 3 preview image

Loading page image...

Chapter 1Introduction to Statistics and DataAnalysis1.1(a) 15.(b) ¯x=115(3.4 + 2.5 + 4.8 +· · ·+ 4.8) = 3.787.(c) Sample median is the 8th value, after the data is sorted from smallest to largest: 3.6.(d) A dot plot is shown below.2.53.03.54.04.55.05.5(e) After trimming total 40% of the data (20% highest and 20% lowest), the data becomes:2.93.03.33.43.63.74.04.44.8So. the trimmed mean is¯xtr20= 19 (2.9 + 3.0 +· · ·+ 4.8) = 3.678.(f) They are about the same.1.2(a) Mean=20.7675 and Median=20.610.(b) ¯xtr10= 20.743.(c) A dot plot is shown below.181920212223(d) No. They are all close to each other.1

Page 4

Solution Manual For Probability And Statistics For Engineers And Scientists, 9th Edition - Page 4 preview image

Loading page image...

2Chapter 1Introduction to Statistics and Data Analysis1.3(a) A dot plot is shown below.200205210215220225230In the figure, “×” represents the “No aging” group and “” represents the “Aging”group.(b) Yes; tensile strength is greatly reduced due to the aging process.(c) MeanAging= 209.90, and MeanNo aging= 222.10.(d) MedianAging= 210.00, and MedianNo aging= 221.50. The means and medians for eachgroup are similar to each other.1.4(a)¯XA= 7.950 and˜XA= 8.250;¯XB= 10.260 and˜XB= 10.150.(b) A dot plot is shown below.6.57.58.59.510.511.5In the figure, “×” represents companyAand “” represents companyB. The steel rodsmade by companyBshow more flexibility.1.5(a) A dot plot is shown below.−10010203040In the figure, “×” represents the control group and “” represents the treatment group.(b)¯XControl= 5.60,˜XControl= 5.00, and¯Xtr(10);Control= 5.13;¯XTreatment= 7.60,˜XTreatment= 4.50, and¯Xtr(10);Treatment= 5.63.(c) The difference of the means is 2.0 and the differences of the medians and the trimmedmeans are 0.5, which are much smaller. The possible cause of this might be due to theextreme values (outliers) in the samples, especially the value of 37.1.6(a) A dot plot is shown below.1.952.052.152.252.352.452.55In the figure, “×” represents the 20C group and “” represents the 45C group.(b)¯X20C= 2.1075, and¯X45C= 2.2350.(c) Based on the plot, it seems that high temperature yields more high values of tensilestrength, along with a few low values of tensile strength. Overall, the temperature doeshave an influence on the tensile strength.(d) It also seems that the variation of the tensile strength gets larger when the cure temper-ature is increased.1.7s2=1151[(3.43.787)2+ (2.53.787)2+ (4.83.787)2+· · ·+ (4.83.787)2] = 0.94284;s=s2=0.9428 = 0.971.

Page 5

Solution Manual For Probability And Statistics For Engineers And Scientists, 9th Edition - Page 5 preview image

Loading page image...

Solutions for Exercises in Chapter 131.8s2=1201[(18.7120.7675)2+ (21.4120.7675)2+· · ·+ (21.1220.7675)2] = 2.5329;s=2.5345 = 1.5915.1.9(a)s2No Aging=1101[(227222.10)2+ (222222.10)2+· · ·+ (221222.10)2] = 23.66;sNo Aging=23.62 = 4.86.s2Aging=1101[(219209.90)2+ (214209.90)2+· · ·+ (205209.90)2] = 42.10;sAging=42.12 = 6.49.(b) Based on the numbers in (a), the variation in “Aging” is smaller that the variation in“No Aging” although the difference is not so apparent in the plot.1.10 For companyA:s2A= 1.2078 andsA=1.2072 = 1.099.For companyB:s2B= 0.3249 andsB=0.3249 = 0.570.1.11 For the control group:s2Control= 69.38 andsControl= 8.33.For the treatment group:s2Treatment= 128.04 andsTreatment= 11.32.1.12 For the cure temperature at 20C:s220C= 0.005 ands20C= 0.071.For the cure temperature at 45C:s245C= 0.0413 ands45C= 0.2032.The variation of the tensile strength is influenced by the increase of cure temperature.1.13(a) Mean = ¯X= 124.3 and median = ˜X= 120;(b) 175 is an extreme observation.1.14(a) Mean = ¯X= 570.5 and median = ˜X= 571;(b) Variance =s2= 10; standard deviation=s= 3.162; range=10;(c) Variation of the diameters seems too big so the quality is questionable.1.15 Yes. The value 0.03125 is actually aP-value and a small value of this quantity means thatthe outcome (i.e.,HHHHH) is very unlikely to happen with a fair coin.1.16 The term on the left side can be manipulated toni=1xin¯x=ni=1xini=1xi= 0,which is the term on the right side.1.17(a)¯Xsmokers= 43.70 and¯Xnonsmokers= 30.32;(b)ssmokers= 16.93 andsnonsmokers= 7.13;(c) A dot plot is shown below.10203040506070In the figure, “×” represents the nonsmoker group and “” represents the smoker group.(d) Smokers appear to take longer time to fall asleep and the time to fall asleep for smokergroup is more variable.1.18(a) A stem-and-leaf plot is shown below.

Page 6

Solution Manual For Probability And Statistics For Engineers And Scientists, 9th Edition - Page 6 preview image

Loading page image...

4Chapter 1Introduction to Statistics and Data AnalysisStemLeafFrequency105732352324634113845224575600123445779117012444566788991480001122344558914902584(b) The following is the relative frequency distribution table.Relative Frequency Distribution of GradesClass IntervalClass MidpointFrequency,fRelative Frequency10192029303940495059606970798089909914.524.534.544.554.564.574.584.594.53234511141440.050.030.050.070.080.180.230.230.07(c) A histogram plot is given below.14.524.534.544.554.564.574.584.594.5Final Exam GradesRelative FrequencyThe distribution skews to the left.(d)¯X= 65.48,˜X= 71.50 ands= 21.13.1.19(a) A stem-and-leaf plot is shown below.StemLeafFrequency02223345781023558620353303240573505694600054

Page 7

Solution Manual For Probability And Statistics For Engineers And Scientists, 9th Edition - Page 7 preview image

Loading page image...

Solutions for Exercises in Chapter 15(b) The following is the relative frequency distribution table.Relative Frequency Distribution of YearsClass IntervalClass MidpointFrequency,fRelative Frequency0.00.91.01.92.02.93.03.94.04.95.05.96.06.90.451.452.453.454.455.456.4586323440.2670.2000.1000.0670.1000.1330.133(c)¯X= 2.797,s= 2.227 and Sample range is 6.50.2 = 6.3.1.20(a) A stem-and-leaf plot is shown next.StemLeafFrequency0*342056667777777889999171*00000012233333441615566788899102*03432713*21(b) The relative frequency distribution table is shown next.Relative Frequency Distribution of Fruit Fly LivesClass IntervalClass MidpointFrequency,fRelative Frequency04591014151920242529303427121722273221716103110.040.340.320.200.060.020.02(c) A histogram plot is shown next.271217222732Fruit fly lives (seconds)Relative Frequency(d)˜X= 10.50.

Page 8

Solution Manual For Probability And Statistics For Engineers And Scientists, 9th Edition - Page 8 preview image

Loading page image...

6Chapter 1Introduction to Statistics and Data Analysis1.21(a)¯X= 74.02 and˜X= 78;(b)s= 39.26.1.22(a)¯X= 6.7261 and˜X= 0.0536.(b) A histogram plot is shown next.6.626.666.76.746.786.82Relative Frequency Histogram for Diameter(c) The data appear to be skewed to the left.1.23(a) A dot plot is shown next.01002003004005006007008009001000395.10160.15(b)¯X1980= 395.1 and¯X1990= 160.2.(c) The sample mean for 1980 is over twice as large as that of 1990.The variability for1990 decreased also as seen by looking at the picture in (a).The gap represents anincrease of over 400 ppm. It appears from the data that hydrocarbon emissions decreasedconsiderably between 1980 and 1990 and that the extreme large emission (over 500 ppm)were no longer in evidence.1.24(a)¯X= 2.8973 ands= 0.5415.(b) A histogram plot is shown next.1.82.12.42.733.33.63.9SalariesRelative Frequency

Page 9

Solution Manual For Probability And Statistics For Engineers And Scientists, 9th Edition - Page 9 preview image

Loading page image...

Solutions for Exercises in Chapter 17(c) Use the double-stem-and-leaf plot, we have the following.StemLeafFrequency1(84)12*(05)(10)(14)(37)(44)(45)62(52)(52)(67)(68)(71)(75)(77)(83)(89)(91)(99)113*(10)(13)(14)(22)(36)(37)63(51)(54)(57)(71)(79)(85)61.25(a)¯X= 33.31;(b)˜X= 26.35;(c) A histogram plot is shown next.102030405060708090Percentage of the familiesRelative Frequency(d)¯Xtr(10)= 30.97. This trimmed mean is in the middle of the mean and median using thefull amount of data. Due to the skewness of the data to the right (see plot in (c)), it iscommon to use trimmed data to have a more robust result.1.26 If a model using the function of percent of families to predict staff salaries, it is likely that themodel would be wrong due to several extreme values of the data. Actually if a scatter plotof these two data sets is made, it is easy to see that some outlier would influence the trend.1.27(a) The averages of the wear are plotted here.7008009001000110012001300250300350loadwear(b) When the load value increases, the wear value also increases.It does show certainrelationship.

Page 10

Solution Manual For Probability And Statistics For Engineers And Scientists, 9th Edition - Page 10 preview image

Loading page image...

8Chapter 1Introduction to Statistics and Data Analysis(c) A plot of wears is shown next.7008009001000110012001300100300500700loadwear(d) The relationship between load and wear in (c) is not as strong as the case in (a), especiallyfor the load at 1300. One reason is that there is an extreme value (750) which influencethe mean value at the load 1300.1.28(a) A dot plot is shown next.71.4571.6571.8572.0572.2572.4572.6572.8573.05LowHighIn the figure, “×” represents the low-injection-velocity group and “” represents thehigh-injection-velocity group.(b) It appears that shrinkage values for the low-injection-velocity group is higher than thosefor the high-injection-velocity group. Also, the variation of the shrinkage is a little largerfor the low injection velocity than that for the high injection velocity.1.29 A box plot is shown next.2.02.53.03.5

Page 11

Solution Manual For Probability And Statistics For Engineers And Scientists, 9th Edition - Page 11 preview image

Loading page image...

Solutions for Exercises in Chapter 191.30 A box plot plot is shown next.70080090010001100120013001.31(a) A dot plot is shown next.76798285889194LowHighIn the figure, “×” represents the low-injection-velocity group and “” represents thehigh-injection-velocity group.(b) In this time, the shrinkage values are much higher for the high-injection-velocity groupthan those for the low-injection-velocity group. Also, the variation for the former groupis much higher as well.(c) Since the shrinkage effects change in different direction between low mode temperatureand high mold temperature, the apparent interactions between the mold temperatureand injection velocity are significant.1.32 An interaction plot is shown next.Lowhighinjection velocitylow mold temphigh mold tempmean shrinkage valueIt is quite obvious to find the interaction between the two variables. Since in this experimentaldata, those two variables can be controlled each at two levels, the interaction can be inves-

Page 12

Solution Manual For Probability And Statistics For Engineers And Scientists, 9th Edition - Page 12 preview image

Loading page image...

10Chapter 1Introduction to Statistics and Data Analysistigated. However, if the data are from an observational studies, in which the variable valuescannot be controlled, it would be difficult to study the interactions among these variables.

Page 13

Solution Manual For Probability And Statistics For Engineers And Scientists, 9th Edition - Page 13 preview image

Loading page image...

Chapter 2Probability2.1(a)S={8,16,24,32,40,48}.(b) Forx2+ 4x5 = (x+ 5)(x1) = 0, the only solutions arex=5 andx= 1.S={−5,1}.(c)S={T, HT, HHT, HHH}.(d)S={N. America,S. America,Europe,Asia,Africa,Australia,Antarctica}.(e) Solving 2x40 givesx2. Since we must also havex <1, it follows thatS=φ.2.2S={(x, y)|x2+y2<9;x0, y0}.2.3(a)A={1,3}.(b)B={1,2,3,4,5,6}.(c)C={x|x24x+ 3 = 0}={x|(x1)(x3) = 0}={1,3}.(d)D={0,1,2,3,4,5,6}. Clearly,A=C.2.4(a)S={(1,1),(1,2),(1,3),(1,4),(1,5),(1,6),(2,1),(2,2),(2,3),(2,4),(2,5),(2,6),(3,1),(3,2),(3,3),(3,4),(3,5),(3,6),(4,1),(4,2),(4,3),(4,4),(4,5),(4,6),(5,1),(5,2),(5,3),(5,4),(5,5),(5,6),(6,1),(6,2),(6,3),(6,4),(6,5),(6,6)}.(b)S={(x, y)|1x, y6}.2.5S={1HH,1HT,1T H,1T T,2H,2T,3HH,3HT,3T H,3T T,4H,4T,5HH,5HT,5T H,5T T,6H,6T}.2.6S={A1A2, A1A3, A1A4, A2A3, A2A4, A3A4}.2.7S1={M M M M, M M M F, M M F M, M F M M, F M M M, M M F F, M F M F, M F F M,F M F M, F F M M, F M M F, M F F F, F M F F, F F M F, F F F M, F F F F}.S2={0,1,2,3,4}.2.8(a)A={(3,6),(4,5),(4,6),(5,4),(5,5),(5,6),(6,3),(6,4),(6,5),(6,6)}.(b)B={(1,2),(2,2),(3,2),(4,2),(5,2),(6,2),(2,1),(2,3),(2,4),(2,5),(2,6)}.11

Page 14

Solution Manual For Probability And Statistics For Engineers And Scientists, 9th Edition - Page 14 preview image

Loading page image...

12Chapter 2Probability(c)C={(5,1),(5,2),(5,3),(5,4),(5,5),(5,6),(6,1),(6,2),(6,3),(6,4),(6,5),(6,6)}.(d)AC={(5,4),(5,5),(5,6),(6,3),(6,4),(6,5),(6,6)}.(e)AB=φ.(f)BC={(5,2),(6,2)}.(g) A Venn diagram is shown next.AACBBCCS2.9(a)A={1HH,1HT,1T H,1T T,2H,2T}.(b)B={1T T,3T T,5T T}.(c)A={3HH,3HT,3T H,3T T,4H,4T,5HH,5HT,5T H,5T T,6H,6T}.(d)AB={3T T,5T T}.(e)AB={1HH,1HT,1T H,1T T,2H,2T,3T T,5T T}.2.10(a)S={F F F, F F N, F N F, N F F, F N N, N F N, N N F, N N N}.(b)E={F F F, F F N, F N F, N F F}.(c) The second river was safe for fishing.2.11(a)S={M1M2, M1F1, M1F2, M2M1, M2F1, M2F2, F1M1, F1M2, F1F2, F2M1, F2M2,F2F1}.(b)A={M1M2, M1F1, M1F2, M2M1, M2F1, M2F2}.(c)B={M1F1, M1F2, M2F1, M2F2, F1M1, F1M2, F2M1, F2M2}.(d)C={F1F2, F2F1}.(e)AB={M1F1, M1F2, M2F1, M2F2}.(f)AC={M1M2, M1F1, M1F2, M2M1, M2F1, M2F2, F1F2, F2F1}.(g)AABBCS

Page 15

Solution Manual For Probability And Statistics For Engineers And Scientists, 9th Edition - Page 15 preview image

Loading page image...

Solutions for Exercises in Chapter 2132.12(a)S={ZY F, ZN F, W Y F, W N F, SY F, SN F, ZY M}.(b)AB={ZY F, ZN F, W Y F, W N F, SY F, SN F}=A.(c)AB={W Y F, SY F}.2.13 A Venn diagram is shown next.SPFSample Space2.14(a)AC={0,2,3,4,5,6,8}.(b)AB=φ.(c)C={0,1,6,7,8,9}.(d)CD={1,6,7}, so (CD)B={1,3,5,6,7,9}.(e) (SC)=C={0,1,6,7,8,9}.(f)AC={2,4}, soACD={2,4}.2.15(a)A={nitrogen,potassium,uranium,oxygen}.(b)AC={copper,sodium,zinc,oxygen}.(c)AB={copper,zinc}andC={copper,sodium,nitrogen,potassium,uranium,zinc};so (AB)C={copper,sodium,nitrogen,potassium,uranium,zinc}.(d)BC={copper,uranium,zinc}.(e)ABC=φ.(f)AB={copper,nitrogen,potassium,uranium,oxygen,zinc}andAC={oxygen}; so, (AB)(AC) ={oxygen}.2.16(a)MN={x|0< x <9}.(b)MN={x|1< x <5}.(c)MN={x|9< x <12}.2.17 A Venn diagram is shown next.

Page 16

Solution Manual For Probability And Statistics For Engineers And Scientists, 9th Edition - Page 16 preview image

Loading page image...

14Chapter 2ProbabilityABS1234(a) From the above Venn diagram, (AB)contains the regions of 1, 2 and 4.(b) (AB)contains region 1.(c) A Venn diagram is shown next.ABCS12345678(AC)Bcontains the regions of 3, 4, 5, 7 and 8.2.18(a) Not mutually exclusive.(b) Mutually exclusive.(c) Not mutually exclusive.(d) Mutually exclusive.2.19(a) The family will experience mechanical problems but will receive no ticket for trafficviolation and will not arrive at a campsite that has no vacancies.(b) The family will receive a traffic ticket and arrive at a campsite that has no vacancies butwill not experience mechanical problems.(c) The family will experience mechanical problems and will arrive at a campsite that hasno vacancies.(d) The family will receive a traffic ticket but will not arrive at a campsite that has novacancies.(e) The family will not experience mechanical problems.2.20(a) 6;(b) 2;(c) 2, 5, 6;(d) 4, 5, 7, 8.2.21 Withn1= 6 sightseeing tours each available onn2= 3 different days, the multiplication rulegivesn1n2= (6)(3) = 18 ways for a person to arrange a tour.
Preview Mode

This document has 256 pages. Sign in to access the full document!

Study Now!

XY-Copilot AI
Unlimited Access
Secure Payment
Instant Access
24/7 Support
Document Chat

Document Details

Subject
Statistics

Related Documents

View all