Solution Manual For Statistics for Managers Using Microsoft Excel, 7th Edition

Solution Manual For Statistics for Managers Using Microsoft Excel, 7th Edition helps you tackle difficult exercises with expert guidance.

Sebastian Lopez
Contributor
4.9
158
9 months ago
Preview (31 of 1418 Pages)
100%
Purchase to unlock

Page 1

Solution Manual For Statistics for Managers Using Microsoft Excel, 7th Edition - Page 1 preview image

Loading page image...

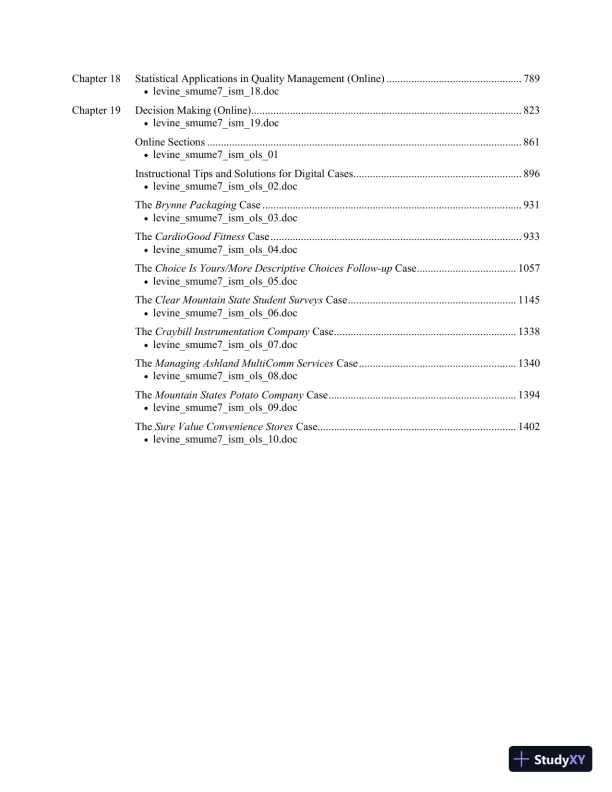
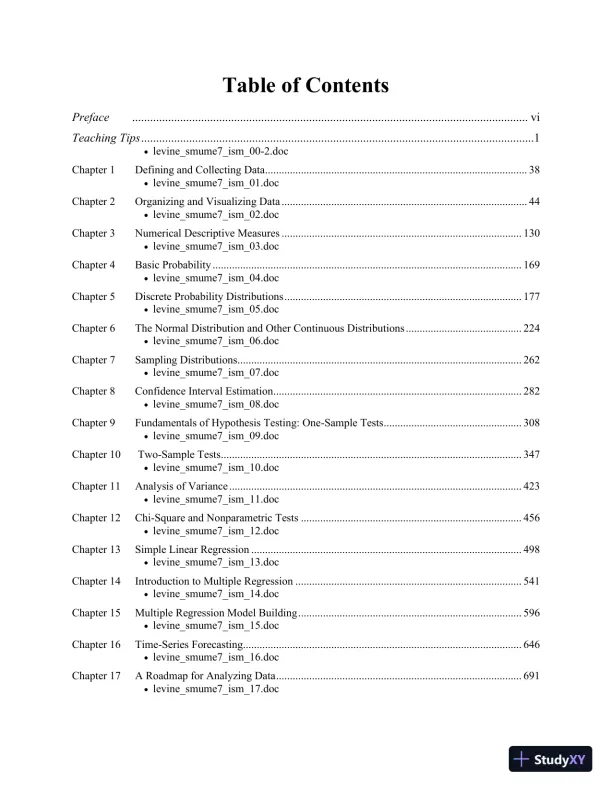
Table of ContentsPreface....................................................................................................................................viTeaching Tips...................................................................................................................................1levine_smume7_ism_00-2.docChapter 1Defining and Collecting Data...............................................................................................38levine_smume7_ism_01.docChapter 2Organizing and Visualizing Data.........................................................................................44levine_smume7_ism_02.docChapter 3Numerical Descriptive Measures.......................................................................................130levine_smume7_ism_03.docChapter 4Basic Probability................................................................................................................169levine_smume7_ism_04.docChapter 5Discrete Probability Distributions......................................................................................177levine_smume7_ism_05.docChapter 6The Normal Distribution and Other Continuous Distributions..........................................224levine_smume7_ism_06.docChapter 7Sampling Distributions.......................................................................................................262levine_smume7_ism_07.docChapter 8Confidence Interval Estimation..........................................................................................282levine_smume7_ism_08.docChapter 9Fundamentals of Hypothesis Testing: One-Sample Tests..................................................308levine_smume7_ism_09.docChapter 10Two-Sample Tests.............................................................................................................347levine_smume7_ism_10.docChapter 11Analysis of Variance..........................................................................................................423levine_smume7_ism_11.docChapter 12Chi-Square and Nonparametric Tests................................................................................456levine_smume7_ism_12.docChapter 13Simple Linear Regression..................................................................................................498levine_smume7_ism_13.docChapter 14Introduction to Multiple Regression..................................................................................541levine_smume7_ism_14.docChapter 15Multiple Regression Model Building.................................................................................596levine_smume7_ism_15.docChapter 16Time-Series Forecasting.....................................................................................................646levine_smume7_ism_16.docChapter 17A Roadmap for Analyzing Data.........................................................................................691levine_smume7_ism_17.doc

Page 2

Solution Manual For Statistics for Managers Using Microsoft Excel, 7th Edition - Page 2 preview image

Loading page image...

Page 3

Solution Manual For Statistics for Managers Using Microsoft Excel, 7th Edition - Page 3 preview image

Loading page image...

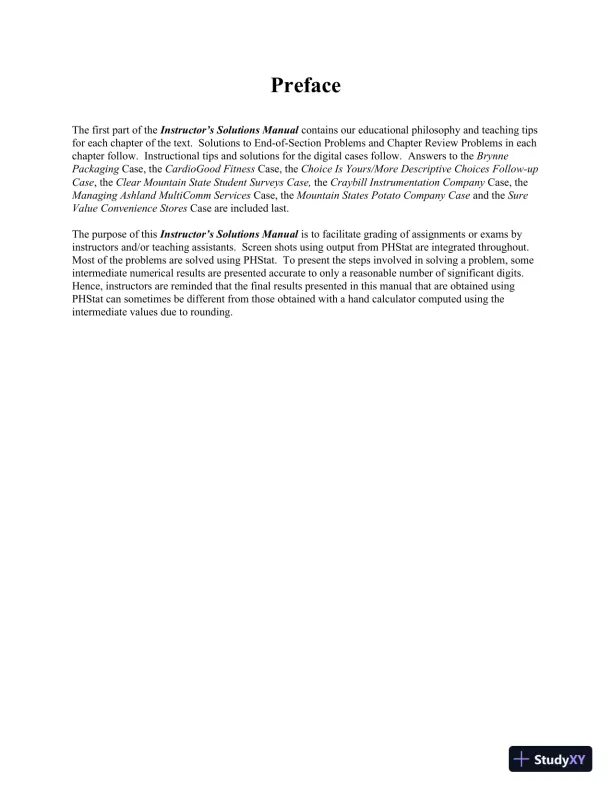
Chapter 18Statistical Applications in Quality Management (Online).................................................789levine_smume7_ism_18.docChapter 19Decision Making (Online)..................................................................................................823levine_smume7_ism_19.docOnline Sections..................................................................................................................861levine_smume7_ism_ols_01Instructional Tips and Solutions for Digital Cases.............................................................896levine_smume7_ism_ols_02.docTheBrynne PackagingCase..............................................................................................931levine_smume7_ism_ols_03.docTheCardioGood FitnessCase...........................................................................................933levine_smume7_ism_ols_04.docTheChoice Is Yours/More Descriptive Choices Follow-upCase....................................1057levine_smume7_ism_ols_05.docTheClear Mountain State Student SurveysCase.............................................................1145levine_smume7_ism_ols_06.docTheCraybill Instrumentation CompanyCase..................................................................1338levine_smume7_ism_ols_07.docTheManaging Ashland MultiComm ServicesCase.........................................................1340levine_smume7_ism_ols_08.docTheMountain States Potato CompanyCase....................................................................1394levine_smume7_ism_ols_09.docTheSure Value Convenience StoresCase........................................................................1402levine_smume7_ism_ols_10.doc

Page 4

Solution Manual For Statistics for Managers Using Microsoft Excel, 7th Edition - Page 4 preview image

Loading page image...

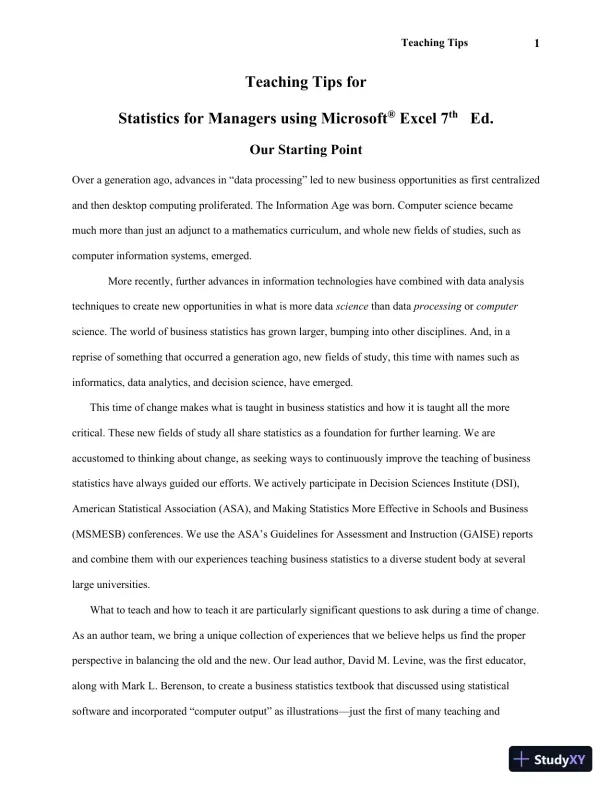
PrefaceThe first part of theInstructor’s Solutions Manualcontains our educational philosophy and teaching tipsfor each chapter of the text. Solutions to End-of-Section Problems and Chapter Review Problems in eachchapter follow.Instructional tips and solutions for the digital cases follow.Answers to theBrynnePackagingCase, theCardioGood FitnessCase, theChoice Is Yours/More Descriptive Choices Follow-upCase, theClear Mountain State StudentSurveys Case,theCraybill Instrumentation CompanyCase, theManaging Ashland MultiComm ServicesCase, theMountain States Potato Company Caseand theSureValue Convenience StoresCase are included last.The purpose of thisInstructor’s Solutions Manualis to facilitate grading of assignments or exams byinstructors and/or teaching assistants. Screen shots using output from PHStat are integrated throughout.Most of the problems are solved using PHStat. To present the steps involved in solving a problem, someintermediate numerical results are presented accurate to only a reasonable number of significant digits.Hence, instructors are reminded that the final results presented in this manual that are obtained usingPHStat can sometimes be different from those obtained with a hand calculator computed using theintermediate values due to rounding.

Page 5

Solution Manual For Statistics for Managers Using Microsoft Excel, 7th Edition - Page 5 preview image

Loading page image...

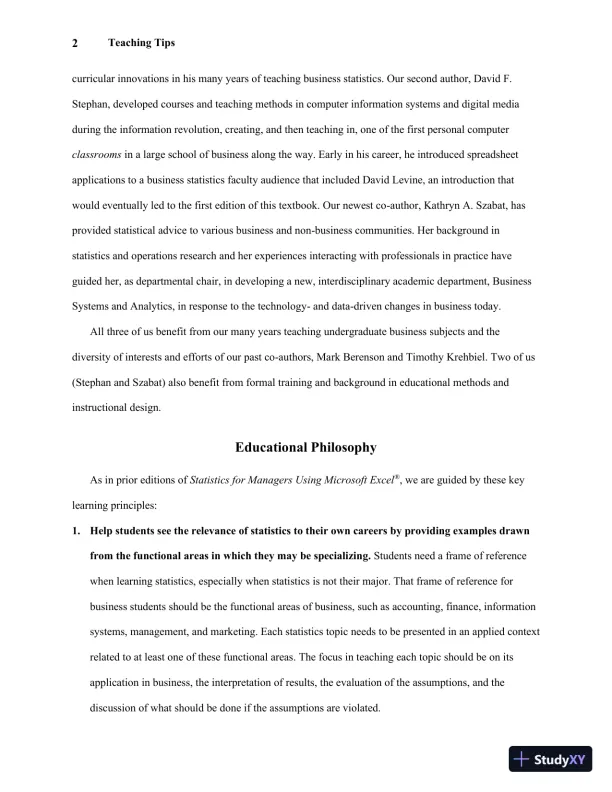
Teaching Tips1Teaching Tips forStatistics for Managers using Microsoft®Excel7thEd.Our Starting PointOver a generation ago, advances in “data processing” led to new business opportunities as first centralizedand then desktop computing proliferated. The Information Age was born. Computer science becamemuch more than just an adjunct to a mathematics curriculum, and whole new fields of studies, such ascomputer information systems, emerged.More recently, further advances in information technologies have combined with data analysistechniques to create new opportunities in what is more datasciencethan dataprocessingorcomputerscience. The world of business statistics has grown larger, bumping into other disciplines. And, in areprise of something that occurred a generation ago, new fields of study, this time with names such asinformatics, data analytics, and decision science, have emerged.This time of change makes what is taught in business statistics and how it is taught all the morecritical. These new fields of study all share statistics as a foundation for further learning. We areaccustomed to thinking about change, as seeking ways to continuously improve the teaching of businessstatistics have always guided our efforts. We actively participate in Decision Sciences Institute (DSI),American Statistical Association (ASA), and Making Statistics More Effective in Schools and Business(MSMESB) conferences. We use the ASA’s Guidelines for Assessment and Instruction (GAISE) reportsand combine them with our experiences teaching business statistics to a diverse student body at severallarge universities.What to teach and how to teach it are particularly significant questions to ask during a time of change.As an author team, we bring a unique collection of experiences that we believe helps us find the properperspective in balancing the old and the new. Our lead author, David M. Levine, was the first educator,along with Mark L. Berenson, to create a business statistics textbook that discussed using statisticalsoftware and incorporated “computer output” as illustrationsjust the first of many teaching and

Page 6

Solution Manual For Statistics for Managers Using Microsoft Excel, 7th Edition - Page 6 preview image

Loading page image...

Teaching Tips2curricular innovations in his many years of teaching business statistics. Our second author, David F.Stephan, developed courses and teaching methods in computer information systems and digital mediaduring the information revolution, creating, and then teaching in, one of the first personal computerclassroomsin a large school of business along the way. Early in his career, he introduced spreadsheetapplications to a business statistics faculty audience that included David Levine, an introduction thatwould eventually led to the first edition of this textbook. Our newest co-author, Kathryn A. Szabat, hasprovided statistical advice to various business and non-business communities. Her background instatistics and operations research and her experiences interacting with professionals in practice haveguided her, as departmental chair, in developing a new, interdisciplinary academic department, BusinessSystems and Analytics, in response to the technology-and data-driven changes in business today.All three of us benefit from our many years teaching undergraduate business subjects and thediversity of interests and efforts of our past co-authors, Mark Berenson and Timothy Krehbiel. Two of us(Stephan and Szabat) also benefit from formal training and background in educational methods andinstructional design.Educational PhilosophyAs in prior editions ofStatistics for Managers Using Microsoft Excel®, we are guided by these keylearning principles:1.Help students see the relevance of statistics to their own careers by providing examples drawnfrom the functional areas in which they may be specializing.Students need a frame of referencewhen learning statistics, especially when statistics is not their major. That frame of reference forbusiness students should be the functional areas of business, such as accounting, finance, informationsystems, management, and marketing. Each statistics topic needs to be presented in an applied contextrelated to at least one of these functional areas. The focus in teaching each topic should be on itsapplication in business, the interpretation of results, the evaluation of the assumptions, and thediscussion of what should be done if the assumptions are violated.

Page 7

Solution Manual For Statistics for Managers Using Microsoft Excel, 7th Edition - Page 7 preview image

Loading page image...

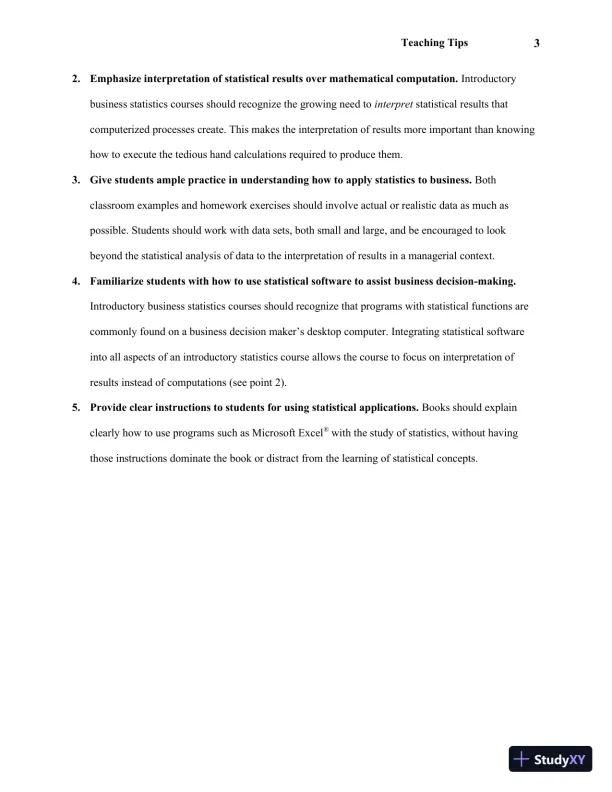
Teaching Tips32.Emphasize interpretation of statistical results over mathematical computation.Introductorybusiness statistics courses should recognize the growing need tointerpretstatistical results thatcomputerized processes create. This makes the interpretation of results more important than knowinghow to execute the tedious hand calculations required to produce them.3.Give students ample practice in understanding how to apply statistics to business.Bothclassroom examples and homework exercises should involve actual or realistic data as much aspossible. Students should work with data sets, both small and large, and be encouraged to lookbeyond the statistical analysis of data to the interpretation of results in a managerial context.4.Familiarize students with how to use statistical software to assist business decision-making.Introductory business statistics courses should recognize that programs with statistical functions arecommonly found on a business decision maker’s desktop computer.Integrating statistical softwareinto all aspects of an introductory statistics course allows the course to focus on interpretation ofresults instead of computations (see point 2).5.Provide clear instructions to students for using statistical applications.Books should explainclearly how to use programs such as Microsoft Excel®with the study of statistics, without havingthose instructions dominate the book or distract from the learning of statistical concepts.

Page 8

Solution Manual For Statistics for Managers Using Microsoft Excel, 7th Edition - Page 8 preview image

Loading page image...

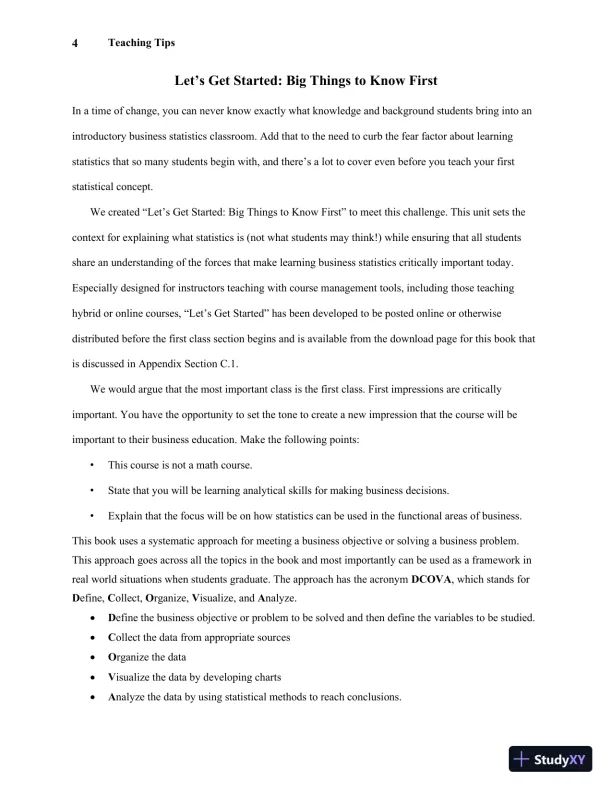
Teaching Tips4Let’s Get Started: Big Things to Know FirstIn a time of change, you can never know exactly what knowledge and background students bring into anintroductory business statistics classroom. Add that to the need to curb the fear factor about learningstatistics that so many students begin with, and there’s a lot to cover even before you teach your firststatistical concept.We created “Let’s Get Started: Big Things to Know First” to meet this challenge. This unit sets thecontext for explaining what statistics is (not what students may think!) while ensuring that all studentsshare an understanding of the forces that make learning business statistics critically important today.Especially designed for instructors teaching with course management tools, including those teachinghybrid or online courses, “Let’s Get Started” has been developed to be posted online or otherwisedistributed before the first class section begins and is available from the download page for this book thatis discussed in Appendix Section C.1.We would argue that the most important class is the first class. First impressions are criticallyimportant. You have the opportunity toset the tone to create a new impression that the course will beimportant to their business education.Make the following points:This course is not a math course.State that you will be learning analytical skills for making business decisions.Explain that the focus will be on how statistics can be used in the functional areas of business.This book uses a systematic approach for meeting a business objective or solving a business problem.This approach goes across all the topics in the book and most importantly can be used as a framework inreal world situations when students graduate. The approach has the acronymDCOVA, which stands forDefine,Collect,Organize,Visualize, andAnalyze.Define the business objective or problem to be solved and then define the variables to be studied.Collect the data from appropriate sourcesOrganize the dataVisualize the data by developing chartsAnalyze the data by using statistical methods to reach conclusions.

Page 9

Solution Manual For Statistics for Managers Using Microsoft Excel, 7th Edition - Page 9 preview image

Loading page image...

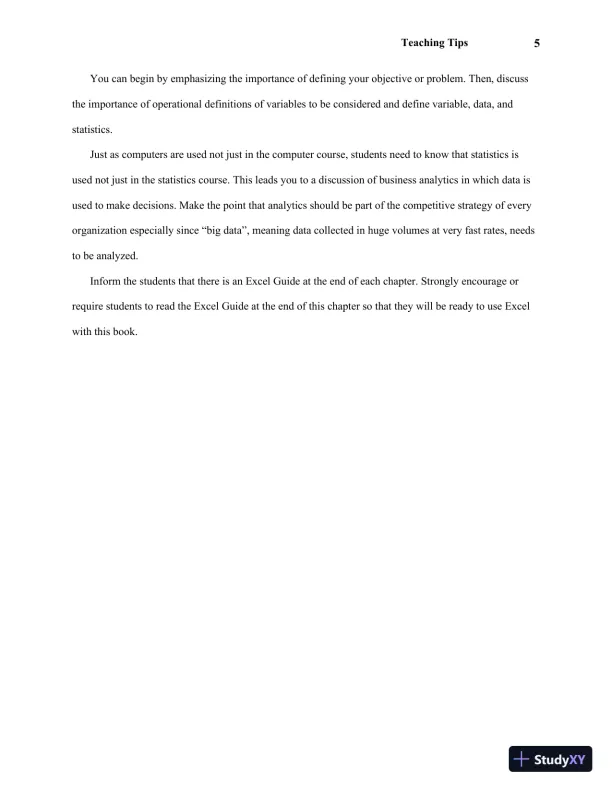
Teaching Tips5You can begin by emphasizing the importance of defining your objective or problem. Then, discussthe importance of operational definitions of variables to be considered and define variable, data, andstatistics.Just as computers are used not just in the computer course, students need to know that statistics isused not just in the statistics course.This leads you to a discussion of business analytics in which data isused to make decisions. Make the point thatanalyticsshould be part of the competitive strategy of everyorganizationespecially since “big data”,meaning data collectedin huge volumes at very fastrates,needsto be analyzed.Inform the students that there is an Excel Guide at the end of each chapter. Strongly encourage orrequire students to read the Excel Guide at the end of this chapter so that they will be ready to use Excelwith this book.

Page 10

Solution Manual For Statistics for Managers Using Microsoft Excel, 7th Edition - Page 10 preview image

Loading page image...

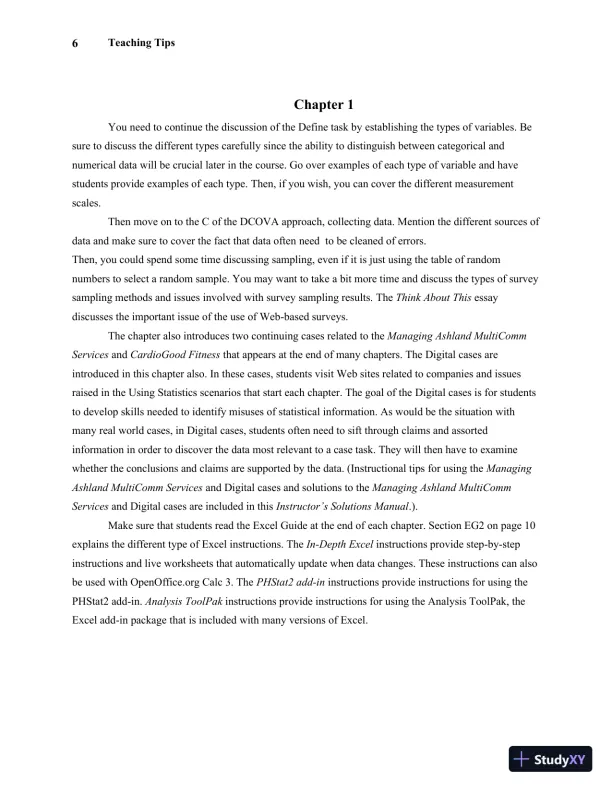
Teaching Tips6Chapter 1You need tocontinue thediscussion of the Define task byestablishing thetypes of variables.Besure to discuss the different types carefully since the ability to distinguish between categorical andnumerical data will be crucial later in thecourse. Go over examples of each type of variable and havestudents provide examples of each type.Then, if you wish, you can cover the different measurementscales.Then move on to the C of the DCOVA approach, collecting data. Mention the different sources ofdata and make sure to cover the fact that data oftenneedto be cleaned of errors.Then, you couldspend some time discussing sampling, even if it is just using the table of randomnumbers to select a random sample. You may want to take a bit more time and discuss the types of surveysampling methods and issues involved with survey sampling results.TheThink About Thisessaydiscusses the important issue of the use of Web-based surveys.The chapter also introducestwocontinuing casesrelated to theManagingAshlandMultiCommServicesandCardioGood Fitnessthat appears at the end of many chapters. TheDigitalcases areintroduced in this chapter also. In these cases, students visit Web sites related to companies and issuesraised in the Using Statistics scenarios that start each chapter. The goal of theDigitalcases is for studentsto develop skills neededto identify misuses of statistical information. As would be the situation withmany real world cases, inDigitalcases,students often need to sift through claims and assortedinformation in order to discover the data most relevant to a case task. They will then have to examinewhether the conclusions and claims are supported by the data. (Instructional tips for using theManagingAshland MultiComm ServicesandDigitalcases and solutions to theManagingAshland MultiCommServicesandDigital cases are included in thisInstructor’s Solutions Manual.).Make sure that students read the Excel Guide at the end ofeachchapter.SectionEG2 on page 10explains the different type of Excel instructions. TheIn-Depth Excelinstructions provide step-by-stepinstructions and live worksheets that automatically update when data changes. These instructions can alsobe used with OpenOffice.org Calc 3. ThePHStat2add-ininstructions provide instructions for using thePHStat2 add-in.Analysis ToolPakinstructions provide instructions for using the Analysis ToolPak, theExcel add-in packagethat is includedwith many versions of Excel.

Page 11

Solution Manual For Statistics for Managers Using Microsoft Excel, 7th Edition - Page 11 preview image

Loading page image...

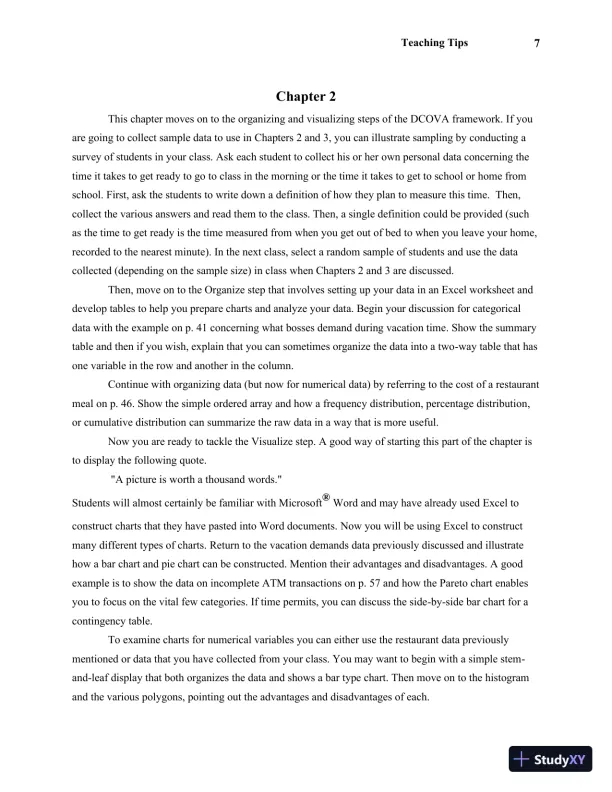
Teaching Tips7Chapter 2This chapter moves on to the organizing and visualizing steps of the DCOVA framework. If youare going to collect sample data to use inChapters2 and 3, you can illustrate sampling by conducting asurvey of students in your class. Ask each student to collect his or her own personal data concerning thetime it takes to get ready to go to class in the morning or the time it takes to get to school or home fromschool. First, ask the students to write down a definition of how they plan to measure this time. Then,collect the various answers and read them to the class. Then, a single definition could be provided (suchas the time to get ready is the time measured from when you get out of bed to when you leave your home,recorded to the nearest minute). In the next class, select a random sample of students and use the datacollected (depending on the sample size) in class when Chapters 2 and 3 are discussed.Then, move on to the Organize step that involves setting up your data in an Excel worksheet anddevelop tables to help you prepare charts and analyze your data. Begin your discussion for categoricaldata with the example on p.41concerningwhat bosses demand during vacation time. Show the summarytable and then if you wish, explain that you can sometimes organize the data into a two-way table that hasone variable in the row and another in the column.Continue with organizing data (but now for numerical data) by referring to the cost of a restaurantmeal on p.46. Show the simple ordered array and how a frequency distribution, percentage distribution,or cumulative distributioncan summarize the raw data in a way that is more useful.Now you are ready to tackle the Visualize step. A good way of starting thispart of thechapter isto display the following quote."A picture is worth a thousand words."Students will almost certainly be familiar with Microsoft®Word andmayhave already used Excel toconstruct charts that they have pasted into Word documents.Now you will be using Excel to constructmany different types of charts.Return to thevacation demandsdata previously discussed and illustratehow a bar chart and pie chart can be constructed. Mention theiradvantages and disadvantages. A goodexample is to show the data on incomplete ATM transactions on p.57and how the Pareto chart enablesyou to focus on the vital few categories. If time permits, you can discuss the side-by-side bar chart for acontingency table.To examine charts for numerical variables you can either use the restaurant data previouslymentioned or data that you have collected from your class. You may want to begin with a simple stem-and-leaf display that both organizes the data and shows a bar type chart. Then move on to the histogramand the various polygons, pointing out the advantages and disadvantages of each.

Page 12

Solution Manual For Statistics for Managers Using Microsoft Excel, 7th Edition - Page 12 preview image

Loading page image...

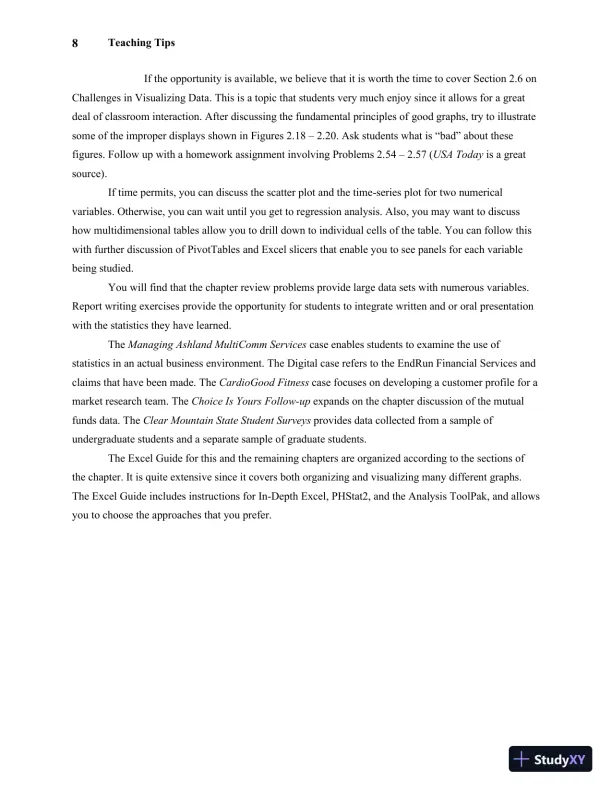
Teaching Tips8If the opportunity is available, we believe that it is worth the time to cover Section 2.6onChallenges in Visualizing Data. This is a topic that students very much enjoy since it allows for a greatdeal of classroom interaction. After discussing the fundamental principles ofgoodgraphs, try to illustratesome of the improper displays shown in Figures 2.182.20. Ask students what is “bad” about thesefigures. Follow up with a homework assignment involving Problems 2.542.57(USA Todayis a greatsource).If time permits, you can discuss the scatter plot and the time-series plot for two numericalvariables. Otherwise, you can wait until you get to regression analysis. Also, youmay wantto discusshow multidimensionaltablesallow you to drill down to individual cells of the table.You can follow thiswith further discussion of PivotTablesand Excel slicers that enable you to see panels for each variablebeing studied.You will find that the chapter review problems provide large data sets with numerous variables.Report writing exercisesprovide the opportunity for students to integrate written and or oral presentationwith the statistics they have learned.TheManagingAshland MultiComm Servicescase enables students to examine the use ofstatistics in an actual business environment.TheDigital caserefers to theEndRunFinancialServicesandclaims that have been made.TheCardioGood Fitnesscase focuses on developing a customer profile for amarket research team. TheChoice Is Yours Follow-upexpands on the chapter discussion of the mutualfunds data. TheClear Mountain State Student Surveysprovides data collected from a sample ofundergraduate students and a separate sample of graduate students.The Excel Guide for this and the remaining chaptersareorganized according to the sections ofthe chapter. It is quite extensive since it covers both organizing and visualizing many different graphs.The Excel Guideincludes instructions for In-Depth Excel, PHStat2, and the Analysis ToolPak,andallowsyou tochoose the approaches that you prefer.

Page 13

Solution Manual For Statistics for Managers Using Microsoft Excel, 7th Edition - Page 13 preview image

Loading page image...

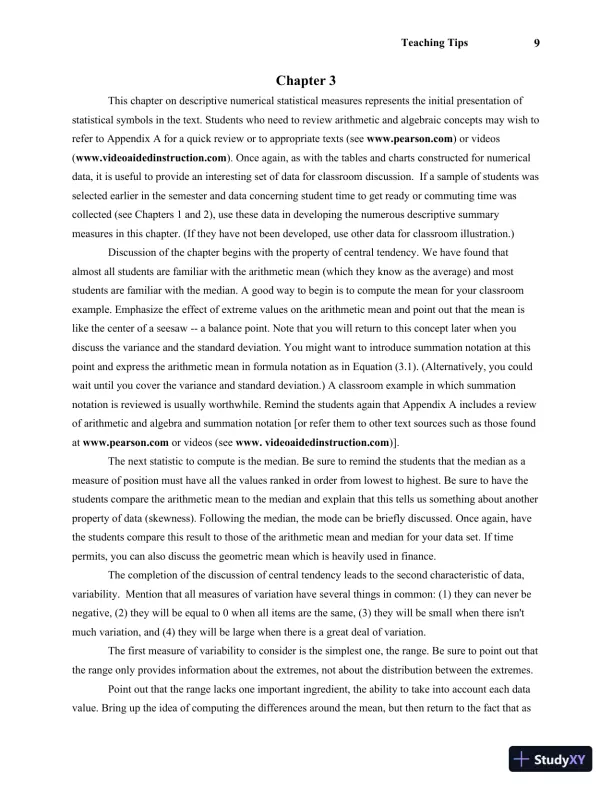
Teaching Tips9Chapter 3This chapter ondescriptivenumerical statisticalmeasures represents the initial presentation ofstatistical symbols in the text. Students who need to review arithmetic and algebraic conceptsmay wish torefer to AppendixA for a quick review or to appropriate texts (seewww.pearson.com) or videos(www.videoaidedinstruction.com). Once again, as with the tables and chartsconstructed fornumericaldata, it is useful to provide an interesting set of data for classroomdiscussion.If a sample of students wasselected earlier in the semester and data concerning student time to get ready or commuting time wascollected (see Chapters 1 and 2), use these data in developing the numerous descriptive summarymeasures in this chapter. (If they have not been developed,useother data for classroom illustration.)Discussion of the chapter begins with the property of central tendency. We have found thatalmost all students are familiar with the arithmetic mean (which they know as the average) and moststudents are familiar with the median. A good way to begin is to compute themeanfor your classroomexample. Emphasize the effect of extreme values on the arithmetic mean and point out that themeanislike the center of a seesaw--a balance point. Note that you will return to this concept later when youdiscuss the variance and the standard deviation. You might want to introduce summation notation at thispoint and express the arithmetic mean in formula notation as in Equation (3.1). (Alternatively, you couldwait until you cover the variance and standard deviation.) A classroom example in which summationnotation is reviewed is usually worthwhile. Remind the studentsagainthat Appendix Aincludesa reviewof arithmetic and algebra and summation notation [or refer them to other text sources such as those foundatwww.pearson.comor videos (seewww. videoaidedinstruction.com)].The next statistic to compute is the median. Be sure to remind the students that the median as ameasure of position must have all the values ranked in order from lowest to highest. Be sure to have thestudents compare the arithmetic mean to the median and explain that this tells us something about anotherproperty of data (skewness). Following the median, the mode can be briefly discussed. Once again, havethe students compare this result to those of the arithmetic mean and median for your data set.If timepermits, you can also discuss the geometric mean which is heavily used in finance.The completion of the discussion of central tendencyleadsto the second characteristic of data,variability. Mention that all measures of variation have several things in common: (1) they can never benegative, (2) they will be equal to 0 when all items are the same, (3) they will be small when there isn'tmuch variation, and (4) they will be large when there isagreat deal of variation.The first measure of variability to consider is the simplest one, the range. Be sure to point out thatthe range only provides information about the extremes, not about the distribution between the extremes.Point out thatthe rangelacksone important ingredient, the ability to take into account each datavalue. Bring up the idea of computing the differences around the mean, but then return to the fact that as

Page 14

Solution Manual For Statistics for Managers Using Microsoft Excel, 7th Edition - Page 14 preview image

Loading page image...

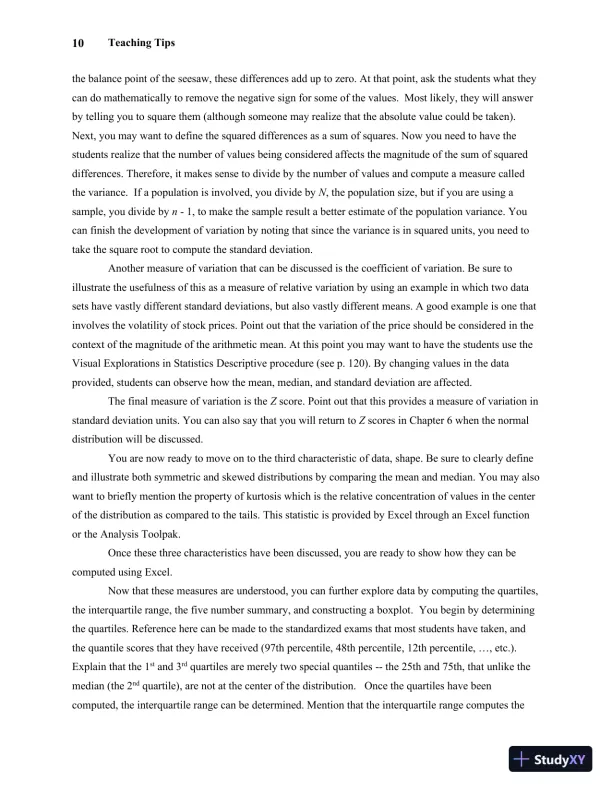
Teaching Tips10the balance point of the seesaw, these differences add up to zero. At that point, ask the students whattheycan do mathematically to remove the negative sign for some of the values. Most likely, they will answerby telling you to square them (although someone may realize that the absolute value could be taken).Next, you may want to define the squared differences as a sum of squares. Now you need to have thestudents realize that the number ofvalues being considered affects the magnitude of the sum of squareddifferences. Therefore, it makes sense to divide by the number ofvalues andcomputea measure calledthe variance. If a population is involved, you divide byN, the population size, but if you are using asample, you divide byn-1, to make the sample result a better estimate of the population variance. Youcan finish the development of variation by noting that since the variance is in squared units, you need totake the square root tocompute the standard deviation.Anothermeasure of variation that can be discussed is the coefficient of variation. Be sure toillustrate the usefulness of this as a measure of relative variation by using an example in which two datasets have vastly different standard deviations, but also vastly different means. A good example is one thatinvolves the volatility of stock prices. Point out that the variation of the price should be considered in thecontext of the magnitude of the arithmetic mean. At this pointyou may wantto have the students use theVisual Explorations in StatisticsDescriptiveprocedure(see p.120). By changing values in the dataprovided, students can observe how the mean, median, and standard deviation are affected.The final measure of variation is theZscore. Point out that this provides a measure of variation instandard deviation units. You can also say that you will return toZscores in Chapter 6 when the normaldistribution will be discussed.You are now ready to move on to the third characteristic of data,shape. Be sure to clearly defineand illustrate both symmetric and skewed distributions by comparing the mean and median.You may alsowant to briefly mention the property of kurtosis which is the relative concentration of values in the centerof the distribution as compared to the tails.Thisstatistic is provided by Excel through an Excel functionor theAnalysis Toolpak.Once these three characteristics have been discussed, you are ready to show how they can becomputed using Excel.Now that these measuresare understood, you can further explore data by computing the quartiles,the interquartile range, the five number summary, and constructing a boxplot.You begin bydeterminingthe quartiles. Reference here can be made to the standardized exams that most students have taken, andthe quantile scores that they have received (97th percentile, 48th percentile, 12thpercentile, …, etc.).Explain that the1stand 3rdquartiles are merely two special quantiles--the 25th and 75th, that unlike themedian(the 2ndquartile), are not at the center of the distribution.Once thequartiles havebeencomputed, the interquartile range can be determined.Mentionthat the interquartile range computes the

Page 15

Solution Manual For Statistics for Managers Using Microsoft Excel, 7th Edition - Page 15 preview image

Loading page image...

Teaching Tips11variation in the center of the distribution as compared to the difference in theextremes computed by therange.You can thendiscussthe five-number summary of minimum value, first quartile, median, thirdquartile, and maximum value. Then, you construct theboxplot. Present this plot from the perspective ofserving as a tool for determining the location, variability, and symmetry of a distribution by visualinspection, and as a graphical tool for comparing the distribution of several groups. Itisuseful to displayFigure 3.5on page129that indicates the shape of the boxplot for four different distributions. Then, usePHStat2 toconstructa boxplot. Note thatyou can construct theboxplot for a single group or for multiplegroups.If you desire, you can discuss descriptive measures for a population and introduce the empiricalrule and theChebyshevrule.If time permits, and you have covered scatterplots in Chapter 2, you can briefly discuss thecovariance and thecoefficient of correlation as a measure of the strength of the association between twonumerical variables.Point out that the coefficient of correlation has the advantage as compared to thecovariance of being on a scale that goes from-1 to +1.Figure 3.8on p.139is useful in depicting scatterplots for different coefficients of correlation.Once again, you will find that the chapter review problems provide large data sets with numerousvariables.TheManagingAshland MultiComm Servicescase enables students to examine the use ofdescriptive statistics in an actual business environment. TheDigital casecontinues the evaluation of theEndRunFinancialServicesdiscussed in theDigital casein Chapter 2.TheCardioGood Fitnesscasefocuses on developing a customer profile for a market research team.MoreDescriptiveChoices Follow-upexpands on the discussion of the mutual funds data. TheClear Mountain State Student Surveysprovides data collected from a sample of undergraduate students and a separate sample of graduatestudents.The Excel Guide for the chapter includes instructions on using different Excel functions tocompute various statistics. Alternatively, you can usePHStat orthe Analysis ToolPak to compute a list ofstatistics.PHStat2 can be used to construct a boxplot.

Page 16

Solution Manual For Statistics for Managers Using Microsoft Excel, 7th Edition - Page 16 preview image

Loading page image...

Teaching Tips12Chapter 4The chapter on probability represents a bridge between the descriptive statistics already coveredand the topics of statistical inference, regression, time series, andquality improvementto be covered insubsequent chapters. In many traditional statistics courses, often a great deal of time is spent onprobability topics that are of little direct applicability in basic statistics. The approach in this text is tocover only those topics that are of direct applicability in the remainder of the text.You need to begin with a relatively concise discussion of some probability rules. Essentially,students really just need to know that (1) no probability can be negative, (2) no probability can be morethan 1, and (3) the sum of the probabilities of a set of mutually exclusive events adds to 1.0. Studentsoften understand the subject best if it is taught intuitively with a minimum of formulas, with an examplethat relates to a business application shown as a two-way contingency table (see the Using Statisticsexample). If desired,you can use In-Depth Excel orPHStat2 to compute probabilities from thecontingency table.Once these basic elements of probability have been discussed, if there is time and you desire,conditional probability and Bayestheorem can be covered.TheThinkAbout Thisconcerning emailSPAM is a wonderful way of helping studentsrealize the application of probability to everyday life.Beaware that in a one-semester course where time is particularly limited, these topics may be of marginalimportance.TheDigital casein this chapter extends the evaluation of theEndRunFinancialServicestoconsider claims made about various probabilities.TheCardioGood Fitness,MoreDescriptiveChoicesFollow-up, andClear Mountain State Student Surveyseach involve developing contingency tables to beable to compute and interpret conditional and marginal probabilities.

Page 17

Solution Manual For Statistics for Managers Using Microsoft Excel, 7th Edition - Page 17 preview image

Loading page image...

Teaching Tips13Chapter 5Now that the basic principles of probability have been discussed, the probability distribution isdeveloped and the expected value and variance (and standard deviation) are computed and interpreted.Once a probability distribution has been defined, you are now ready to discuss the covariance, which is ofparticular importance to students majoring in finance. It is referred to in various finance courses includingthose on portfolio management and corporate finance. Use the example in the text to illustrate thecovariance. If desired, continue with coverage of portfolio expected return and portfolio risk. Note thatthe PHStat2Covariance and Portfolio Management menu selection allows you to readily compute thepertinent statistics. It also allows you to demonstrate changes in either the probabilities or the returns andtheir effect on the results.If you are using In-Depth Excel, you can start with the Portfolio.xls workbookand show how various Excel functions can be used to compute the desired statistics.Given that a probability distribution has been defined, you can now discuss some specificdistributions. Although every introductory course undoubtedly covers the normal distribution to bediscussed in Chapter 6, the decision about whether to cover the binomial, Poisson, or hypergeometricdistributions is matter of personal choice and depends on whether the course is part of a two-coursesequence.If the binomial distribution is covered, an interesting way of developing the binomial formula isto follow the Using Statistics example that involves an accounting information system. Note, in thisexample, the value forpis 0.10. (It is best not to use an example withp= 0.50 since this represents aspecial case). The discussion proceeds by asking how you could get three tagged order forms in a sampleof 4. Usually a response will be elicited that provides threeitems of interestout of four selections in aparticular order such as Tagged Tagged Not Tagged Tagged. Ask the class, what would be the probabilityofgetting Tagged on the first selection? When someone responds 0.1, ask them how theyfoundthatanswer and what would be the probability of getting Tagged on the second selection. When they answer0.1 again, you will be able to make the point that in saying 0.1 again, they are assuming that theprobability of Tagged stays constant from trial to trial. When you get to the third selection and thestudents respond 0.9, point out that this is a second assumption of the binomial distribution--that onlytwo outcomes are possible--in this case Tagged and Not Tagged, and the sum of the probabilities ofTagged and Not Tagged must add to 1.0. Now you can compute the probability of three out of four inthis order by multiplying (0.1)(0.1)(0.9)(0.1) to get 0.0009. Ask the class if this is the answer to theoriginal question. Point out that this is justoneway of getting three Tagged out of four selections in aspecific order, and, that therearefourways to getthree Tagged out of four selections, or (0.0009)(4) =0.0036.Thisleads to thedevelopment of the binomial formula Equation (5.11). You might want to doanother example at this point that calls for adding several probabilities such as three or more Tagged, less

Page 18

Solution Manual For Statistics for Managers Using Microsoft Excel, 7th Edition - Page 18 preview image

Loading page image...

Teaching Tips14than three Tagged, etc. Complete the discussion of the binomial distribution with the computation of themean and standard deviation of the distribution. Be sure to point out that for samples greater than five,computations can become unwieldy and the student should use PHStat2,an Excelfunction,or thebinomial tables (See the OnlineBinomial.pdftables).Once the binomial distribution has beencovered,if time permits, other discrete probabilitydistributions can be presented. If you cover the Poisson distribution, pointoutthe distinction between thebinomial and Poisson distributions. Note that the Poisson is based on an area of opportunity in which youare counting occurrences within an area such as time or space. Contrast this with the binomial distributionin which each value is classified asof interestornot of interest. Point out the equations for the mean andstandard deviation of the Poisson distribution andindicatethat the mean is equal to the variance.Since thecomputation of probabilities from these discrete probability distributions can become tedious for otherthan small sample sizes, it is important to discuss PHStat2,anExcel functionor the Poisson tables (Seethe OnlinePoisson.pdftables).The hypergeometric distribution can be developed for the situation in which one is samplingwithout replacement. Once again, use PHStat2or an Excelfunction.TheManagingAshland MultiComm Servicescase for this chapter relates to the binomialdistribution. TheDigital caseinvolves the expected value and standard deviation of a probabilitydistribution and applications of the covariance in finance.

Page 19

Solution Manual For Statistics for Managers Using Microsoft Excel, 7th Edition - Page 19 preview image

Loading page image...

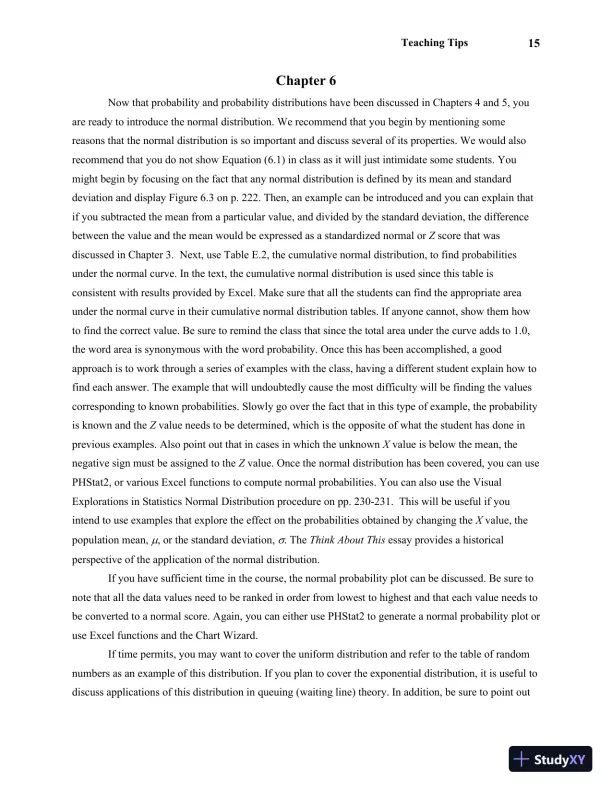
Teaching Tips15Chapter 6Now that probability and probability distributions have been discussed in Chapters4and 5, youare ready to introduce the normal distribution. We recommend that you begin by mentioning somereasons that the normal distribution is so important and discuss several of its properties. We would alsorecommend that you do not show Equation (6.1) in class as it will just intimidate some students. Youmight begin by focusing on the fact that any normal distribution is defined by its mean and standarddeviation and display Figure 6.3 on p.222. Then, an example can be introduced and you can explain thatif you subtracted the mean from a particular value, and divided by the standard deviation, the differencebetween the value and the mean would be expressed as a standardizednormalorZscorethat wasdiscussed in Chapter 3.Next, use Table E.2, the cumulative normal distribution, to find probabilitiesunder the normal curve. In the text, the cumulative normal distribution is used since this table isconsistent with results provided by Excel.Make sure that all the students can find the appropriate areaunder the normal curve in their cumulative normal distribution tables. If anyone cannot, show them howto find the correct value. Be sure to remind the class that since the total area under the curve adds to 1.0,the word area is synonymous with the word probability. Once this has been accomplished, a goodapproach is to work through a series of examples with the class, having a different student explain how tofindeach answer. The example that will undoubtedly cause the mostdifficultywill be finding the valuescorresponding to known probabilities. Slowly go over the fact that in this type of example, the probabilityis known and theZvalue needs to bedetermined, which is the opposite of what the student has done inprevious examples. Also point out that in cases in which the unknownXvalue is below the mean, thenegative sign must be assigned to theZvalue. Once the normal distribution has been covered, youcanusePHStat2,orvarious Excel functionstocomputenormal probabilities.You can alsouse the VisualExplorationsin StatisticsNormalDistributionprocedureon pp.230-231.This will be useful if youintend to use examples that explore the effect on the probabilities obtained by changing theXvalue, thepopulation mean,, or the standarddeviation,.TheThink About Thisessay provides a historicalperspective of the application of the normal distribution.If you have sufficient time in the course, the normal probability plot can be discussed. Be sure tonote that all the data values need to be ranked in order from lowest to highest and that each value needs tobe converted to a normal score. Again,you can eitheruse PHStat2to generate a normal probability plotoruse Excel functions and the Chart Wizard.If time permits, you may want to cover the uniform distribution and referto the table of randomnumbers as an example of this distribution. If you plan to cover the exponential distribution, it is useful todiscuss applications of this distribution inqueuing(waiting line) theory. In addition, be sure to point out

Page 20

Solution Manual For Statistics for Managers Using Microsoft Excel, 7th Edition - Page 20 preview image

Loading page image...

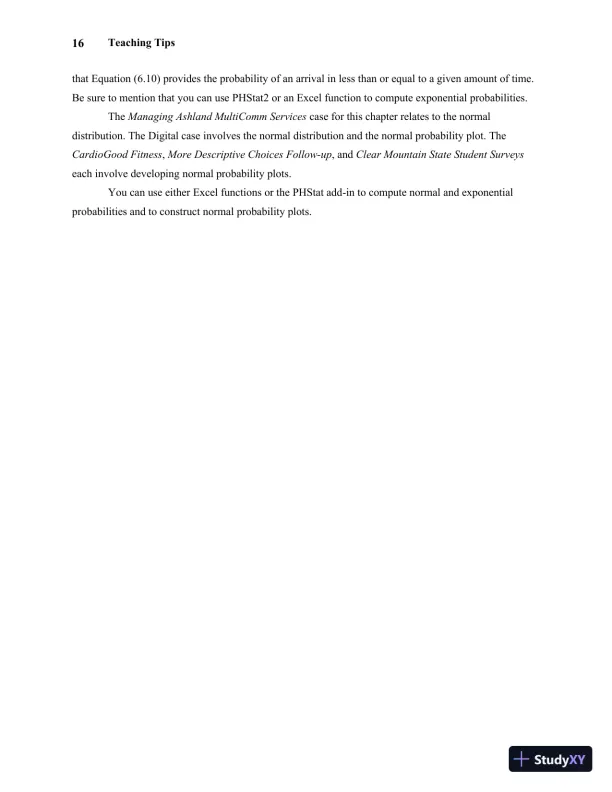
Teaching Tips16that Equation (6.10) provides the probability of an arrival in less than or equal to a given amount of time.Be sure to mention thatyou can usePHStat2oranExcel functiontocomputeexponential probabilities.TheManagingAshland MultiComm Servicescase for this chapter relates to the normaldistribution. TheDigital caseinvolves the normal distribution and the normal probability plot.TheCardioGood Fitness,MoreDescriptiveChoices Follow-up, andClear Mountain State Student Surveyseach involve developingnormal probability plots.You can use either Excel functions or the PHStat add-in to compute normal and exponentialprobabilities and to construct normal probability plots.

Page 21

Solution Manual For Statistics for Managers Using Microsoft Excel, 7th Edition - Page 21 preview image

Loading page image...

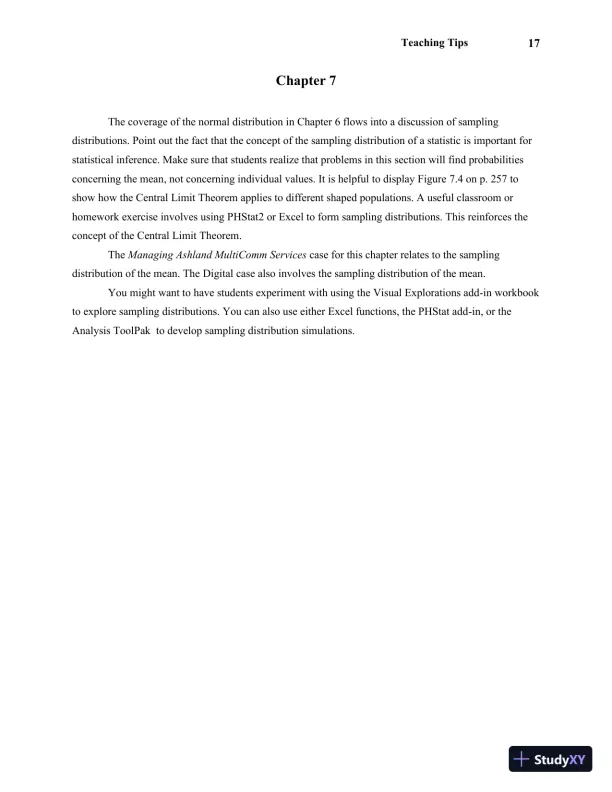
Teaching Tips17Chapter 7The coverage of the normal distributionin Chapter 6flows into a discussion of samplingdistributions. Point out the fact that the concept of the sampling distribution of a statistic is important forstatistical inference. Make sure that students realize that problems in this section will find probabilitiesconcerning the mean,not concerning individual values. It is helpful to display Figure7.4on p.257toshow how the Central Limit Theorem applies to different shaped populations. A useful classroom orhomework exercise involves using PHStat2or Exceltoformsampling distributions. This reinforces theconcept of the Central Limit Theorem.TheManagingAshland MultiComm Servicescase for this chapter relates to the samplingdistribution of the mean. TheDigital casealsoinvolves the sampling distribution of the mean.You might want to have students experiment with using the Visual Explorations add-in workbookto explore sampling distributions. You can also use either Excel functions, the PHStat add-in, or theAnalysis ToolPak to develop sampling distribution simulations.

Page 22

Solution Manual For Statistics for Managers Using Microsoft Excel, 7th Edition - Page 22 preview image

Loading page image...

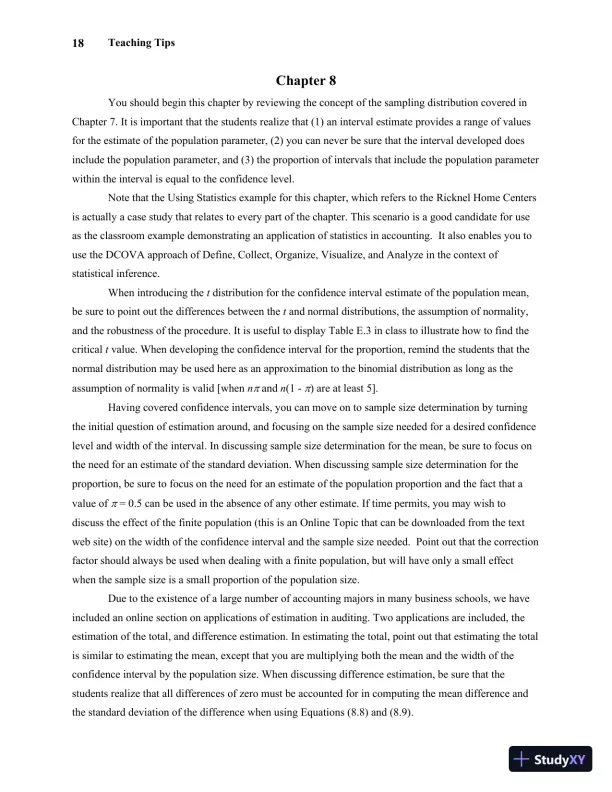
Teaching Tips18Chapter8You should begin this chapter by reviewing the concept of the sampling distribution covered inChapter7. It is important that the students realize that (1) an interval estimate provides a range of valuesfor the estimate of the population parameter, (2) you can never be sure that the interval developed doesinclude the population parameter, and (3) the proportion of intervals that include the population parameterwithin the interval is equal to the confidence level.Note that the Using Statistics example for this chapter, which refers to theRicknel Home Centersis actuallya case study that relates to every part of the chapter. Thisscenariois a good candidate for useas the classroom example demonstrating an application of statistics in accounting.It also enables you touse the DCOVA approach of Define, Collect,Organize, Visualize, and Analyze in the context ofstatistical inference.When introducing thetdistribution for the confidence interval estimate of the population mean,be sure to point out the differences between thetand normal distributions, the assumption of normality,and the robustness of the procedure. It is useful to display Table E.3 in class to illustrate how to find thecriticaltvalue. When developing the confidence interval for the proportion, remind the students that thenormal distribution may be used here as an approximation to the binomial distribution as long as theassumption of normality is valid [whennandn(1-) are at least 5].Having covered confidence intervals, you can move on to sample size determination by turningthe initial question of estimation around, and focusing on the sample size needed for a desired confidencelevel and width of theinterval. In discussing sample size determination for the mean, be sure to focus onthe need for an estimate of the standard deviation. When discussing sample size determination for theproportion, be sure to focus on the need for an estimate of the population proportion and the fact that avalue of= 0.5 can be used in the absence of any other estimate. If time permits, you may wish todiscuss the effect of the finite population (thisisan Online Topic that can be downloaded from the textweb site) on the width of the confidence interval and the sample size needed. Point out that the correctionfactor should always be used when dealing with a finite population, but will have only a small effectwhen the sample size is a small proportion of the population size.Due to the existence of a large number of accounting majors in many business schools, we haveincluded an onlinesection on applications of estimation in auditing. Two applications are included, theestimation of the total, and difference estimation. In estimating the total, point out that estimating the totalis similar to estimating the mean, except that you are multiplying both the mean and the width of theconfidence interval by the population size. When discussing difference estimation, be sure that thestudents realize that all differences of zero must be accounted for in computing themeandifference andthe standard deviation of the differencewhen using Equations (8.8) and (8.9).

Page 23

Solution Manual For Statistics for Managers Using Microsoft Excel, 7th Edition - Page 23 preview image

Loading page image...

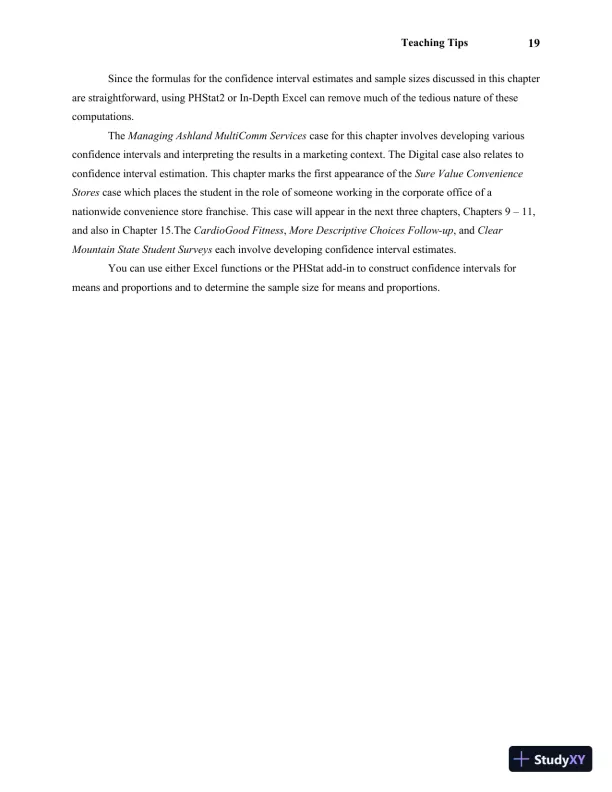
Teaching Tips19Since the formulas for the confidence interval estimates and sample sizes discussed in this chapterare straightforward, using PHStat2or In-Depth Excelcan remove much of the tedious nature of thesecomputations.TheManagingAshland MultiComm Servicescase for this chapter involvesdeveloping variousconfidence intervals and interpreting the results in a marketing context. TheDigital casealso relates toconfidence interval estimation.This chapter marks the first appearance of theSure Value ConvenienceStorescase which places the student in the role of someone working in the corporate office of anationwide convenience store franchise. This case will appear in the next three chapters, Chapters 911,and also in Chapter 15.TheCardioGood Fitness,MoreDescriptiveChoices Follow-up, andClearMountain State Student Surveyseach involve developing confidence interval estimates.You can use either Excel functions or the PHStat add-in to construct confidence intervals formeans and proportions and to determinethesample size for means and proportions.

Page 24

Solution Manual For Statistics for Managers Using Microsoft Excel, 7th Edition - Page 24 preview image

Loading page image...

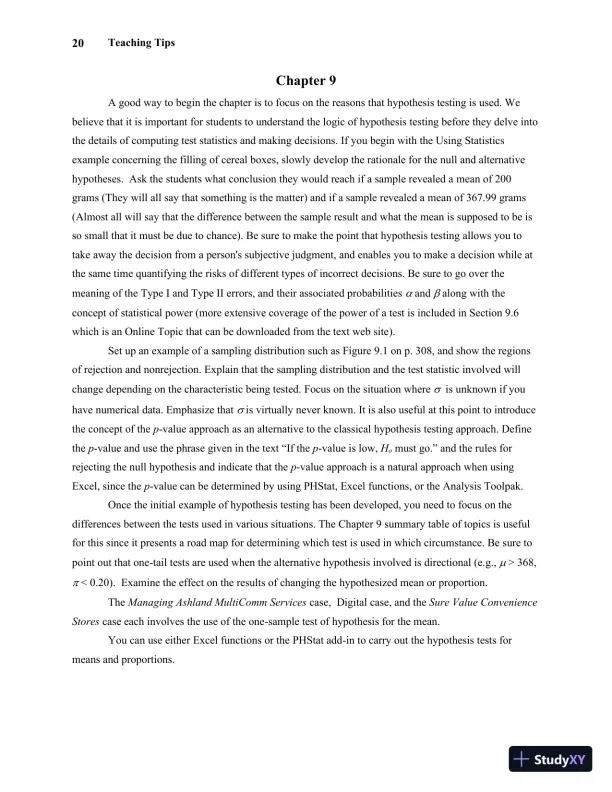
Teaching Tips20Chapter9A good way to begin the chapter is to focus on the reasons that hypothesis testing is used. Webelieve that it is important for students to understand the logic of hypothesis testing before they delve intothe details of computing test statistics and making decisions. If you begin with the Using Statisticsexample concerning the filling of cereal boxes, slowly develop the rationale for the null and alternativehypotheses. Ask the students what conclusion they would reach if a sample revealed ameanof 200grams (They will all say that something is the matter) and if a sample revealed ameanof 367.99 grams(Almost all will say that the difference between the sample result and what themeanis supposed to be isso small that it must be due to chance). Be sure to make the point that hypothesis testing allows you totake away the decision from a person's subjective judgment, and enables you to make a decision while atthe same time quantifying the risks of different types of incorrect decisions. Be sure to go over themeaning of the Type I and Type II errors, and their associated probabilitiesandalong with theconcept of statistical power (more extensive coverage of the power ofatest is included in Section9.6which is an Online Topic that can be downloaded from the text web site).Set up an example of a sampling distribution such as Figure9.1on p.308, and show the regionsof rejection and nonrejection. Explain that the sampling distribution and the test statistic involved willchange depending on the characteristic being tested.Focus on the situation whereis unknown if youhave numerical data. Emphasize thatis virtually never known.It is also useful at this point to introducethe concept of thep-value approach as an alternative to theclassicalhypothesis testing approach. Definethep-valueand usethephrasegiven in the text “If thep-value is low,Homust go.”and the rules forrejecting the null hypothesis and indicate that thep-value approach is a natural approach when usingExcel, since thep-value can bedetermined by using PHStat, Excel functions,ortheAnalysis Toolpak.Once the initial example of hypothesis testing has been developed, you need to focus on thedifferences between the tests used in various situations. The Chapter9summarytableof topicsis usefulfor this since it presents aroad map for determining which test is used in which circumstance. Be sure topoint out that one-tailtests are used when the alternative hypothesis involved is directional (e.g.,> 368,<0.20). Examine the effect on the results of changing thehypothesized mean or proportion.TheManagingAshland MultiComm Servicescase,Digital case, and theSure Value ConvenienceStorescase eachinvolvesthe use of the one-sample test of hypothesis for the mean.You can use either Excel functions or the PHStat add-in to carry out the hypothesis tests formeans and proportions.

Page 25

Solution Manual For Statistics for Managers Using Microsoft Excel, 7th Edition - Page 25 preview image

Loading page image...

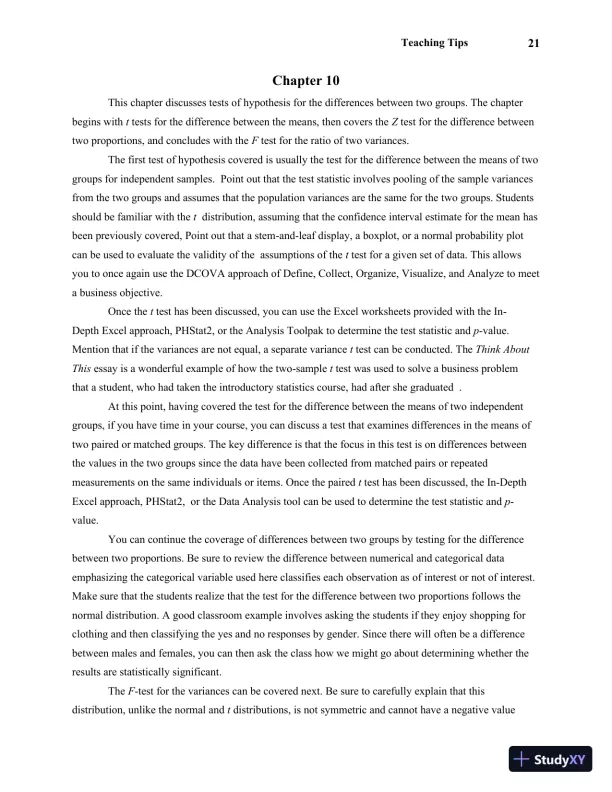
Teaching Tips21Chapter10This chapter discusses tests of hypothesis for the differences between two groups. The chapterbegins withttests for the difference between the means, then covers theZtest for the difference betweentwo proportions, and concludes with theFtest for theratio oftwo variances.The first test of hypothesis covered is usually the test for the difference between the means of twogroups for independent samples. Point out that the test statistic involves pooling of the sample variancesfrom the two groups and assumes that the population variances are the same for the two groups. Studentsshould be familiar with thetdistribution, assuming that the confidence interval estimate for the meanhasbeen previously covered,Point out that a stem-and-leaf display, a boxplot, or a normal probability plotcan be used to evaluate the validity of the assumptions of thettest for a given set of data.This allowsyou to once again use the DCOVA approach of Define, Collect,Organize, Visualize, and Analyze to meeta business objective.Once thettest has been discussed,you can use the Excel worksheets provided with the In-Depth Excel approach, PHStat2,ortheAnalysis Toolpaktodeterminethe test statistic andp-value.Mention that if the variances are not equal, a separate variancettest can beconducted.TheThink AboutThisessay is a wonderful example of how the two-samplettest was used to solve a business problemthat a student,who had taken the introductory statistics course,had after she graduated.At this point, having covered the test for the difference between the means of two independentgroups,if you have time in your course,you can discuss a test thatexaminesdifferences in the means oftwo paired or matched groups. The key difference is that the focus in this test is on differences betweenthevalues in the two groups since the data have been collected from matched pairs or repeatedmeasurements on the same individuals or items. Once the pairedttest has been discussed, theIn-DepthExcel approach, PHStat2,orthe Data Analysis tool can be used todeterminethe test statistic andp-value.You can continue the coverage of differences between two groups by testing for the differencebetween two proportions. Be sure to review the difference between numerical and categorical dataemphasizing the categorical variable used here classifies each observation asof interestornot of interest.Make sure that the students realize that the test for the difference between two proportions follows thenormal distribution. A good classroom example involves asking the students if they enjoy shopping forclothing and then classifying the yes and no responses by gender. Since there willoftenbe a differencebetween males and females, you can then ask the class how we might go about determining whether theresults are statistically significant.TheF-test for the variances can be covered next. Be sure to carefully explain that thisdistribution, unlike the normal andtdistributions, is not symmetric and cannot have a negative value

Page 26

Solution Manual For Statistics for Managers Using Microsoft Excel, 7th Edition - Page 26 preview image

Loading page image...

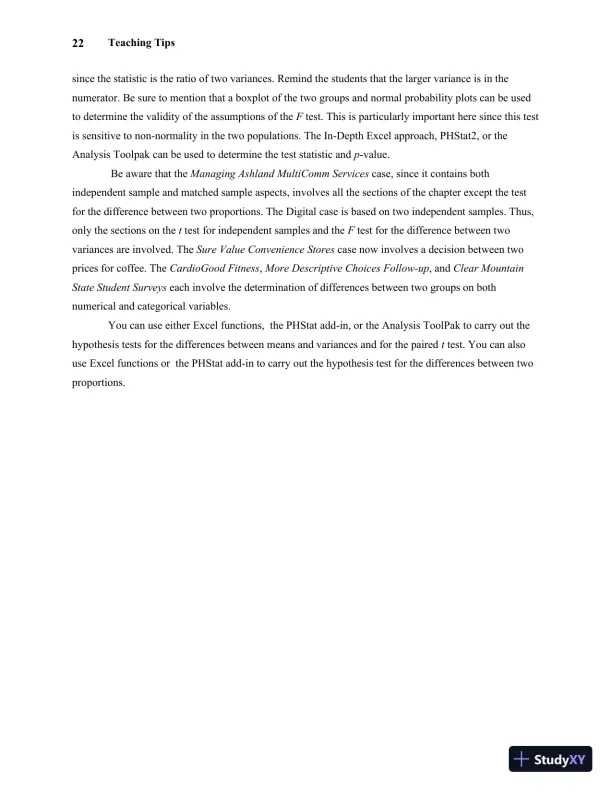
Teaching Tips22since the statistic is the ratio of two variances.Remind the students that the larger variance is in thenumerator.Be sure to mention that a boxplot of the two groups and normal probability plots can be usedto determine the validity of the assumptions of theFtest.This is particularly important here sincethis testis sensitive to non-normality in the two populations.TheIn-Depth Excel approach, PHStat2,ortheAnalysis Toolpakcan be used todeterminethe test statistic andp-value.BeawarethattheManagingAshland MultiComm Servicescase,since it contains bothindependent sample and matchedsample aspects,involves all the sections of the chapter except the testfor the difference between two proportions. TheDigital caseis based on two independent samples. Thus,only the sections on thettest for independent samples and theFtest for the difference between twovariances are involved.TheSure Value Convenience Storescase now involves a decision between twoprices for coffee. TheCardioGood Fitness,MoreDescriptiveChoices Follow-up, andClear MountainState Student Surveyseach involve the determination of differences between two groups on bothnumerical and categorical variables.You can use either Excel functions, the PHStat add-in, or the Analysis ToolPak to carry out thehypothesis tests for the differences between means and variances and for the pairedttest. You can alsouse Excel functions or the PHStat add-in to carry out the hypothesis test for the differences between twoproportions.

Page 27

Solution Manual For Statistics for Managers Using Microsoft Excel, 7th Edition - Page 27 preview image

Loading page image...

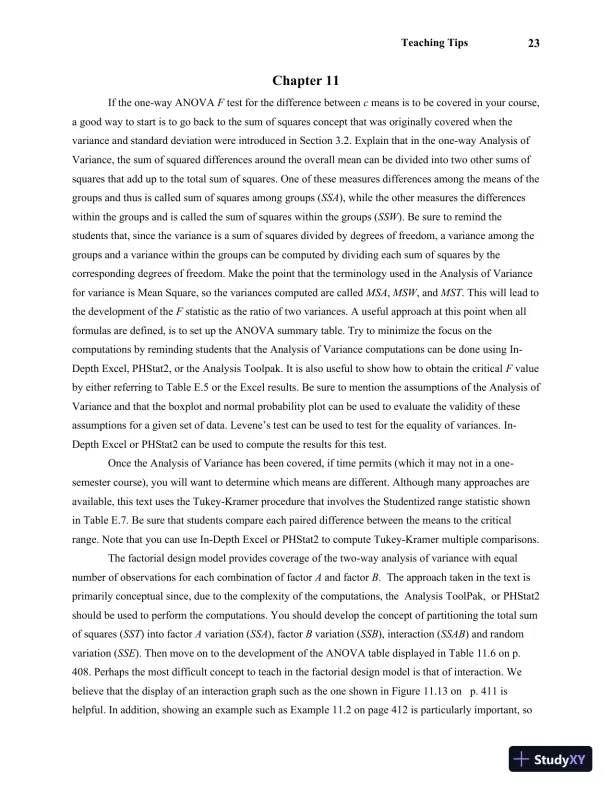
Teaching Tips23Chapter 11If the one-way ANOVAFtest for the difference betweencmeans is to be covered in your course,a good way to start is to go back to the sum of squares concept that was originally covered when thevariance and standard deviation were introduced in Section 3.2. Explain that in theone-way Analysis ofVariance, the sum of squared differences around the overall mean can be divided into two other sums ofsquares that add up to the total sum of squares. One of these measures differences among the means of thegroups and thus is called sum of squares among groups (SSA), while the other measures the differenceswithin the groups and is called the sum of squares within the groups (SSW). Be sure to remind thestudents that, since the variance is a sum of squares divided by degrees of freedom, a variance among thegroups and a variance within the groups can becomputed by dividingeachsum of squares by thecorrespondingdegrees of freedom. Make the point that the terminology used in the Analysis of Variancefor variance is Mean Square, so the variances computed are calledMSA,MSW, andMST. This will lead tothe development of theFstatistic as the ratio of two variances. A useful approach at this point when allformulas are defined, is to set up the ANOVA summary table. Try to minimize the focus on thecomputations by reminding students that the Analysis of Variance computations can be done usingIn-Depth Excel, PHStat2,ortheAnalysisToolpak. It is also useful to show how to obtain the criticalFvalueby either referring to Table E.5or the Excel results. Be sure to mention the assumptions of the Analysis ofVariance and thattheboxplot and normal probability plotcan be used to evaluate the validity of theseassumptions for a given set of data. Levene’s test can be used to test for the equality of variances.In-Depth ExcelorPHStat2can be used to compute the results for this test.Once the Analysis of Variance has been covered, if time permits (which it may not in a one-semester course), you will want to determine which means are different. Although many approaches areavailable, this text uses the Tukey-Kramer procedure that involves the Studentized range statistic shownin Table E.7. Be sure that students compare each paired difference betweenthemeans to the criticalrange. Note thatyou can use In-Depth ExcelorPHStat2tocomputeTukey-Kramer multiple comparisons.The factorial design model provides coverage of the two-way analysis of variance with equalnumber of observations for each combination of factorAand factorB. The approach taken in the text isprimarily conceptual since, due to thecomplexityof the computations, the AnalysisToolPak,orPHStat2should be used to perform the computations. You should develop the concept of partitioning the total sumof squares (SST) into factorAvariation (SSA), factorBvariation (SSB), interaction (SSAB) and randomvariation (SSE). Then move on to the development of the ANOVA table displayed in Table11.6on p.408. Perhaps the most difficult concept to teach in the factorial design model is that of interaction. Webelieve that the display of an interaction graph such as the one shown in Figure11.13onp.411ishelpful. In addition, showing an example such as Example11.2on page 412is particularly important, so

Page 28

Solution Manual For Statistics for Managers Using Microsoft Excel, 7th Edition - Page 28 preview image

Loading page image...

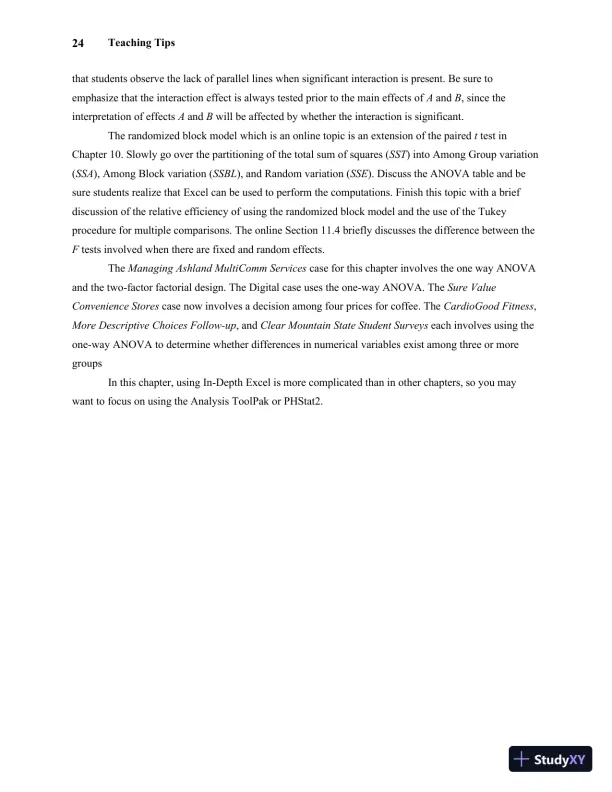
Teaching Tips24that students observe the lack of parallel lines when significant interaction is present. Be sure toemphasize that the interaction effect is always tested prior to the main effects ofAandB, since theinterpretation of effectsAandBwill be affected by whether the interaction is significant.The randomized block model which is an online topic is an extension of the pairedttest inChapter 10.Slowly go over the partitioning of the total sum of squares (SST) into Among Group variation(SSA), Among Block variation (SSBL), and Random variation (SSE). Discuss the ANOVA table and besure students realize thatExcelcan be used to perform the computations. Finish this topic with a briefdiscussion of the relative efficiency of using the randomized block model and the use of the Tukeyprocedure for multiple comparisons.The online Section 11.4 briefly discusses the difference between theFtests involved when there are fixed and random effects.TheManagingAshland MultiComm Servicescase for this chapter involves the one way ANOVAand the two-factor factorial design. TheDigital caseuses theone-way ANOVA.TheSure ValueConvenience Storescase now involves a decisionamongfour prices for coffee. TheCardioGood Fitness,MoreDescriptiveChoices Follow-up, andClear Mountain State Student Surveyseach involves usingtheone-way ANOVA to determine whether differences in numerical variables exist among three or moregroupsIn this chapter, using In-Depth Excel is more complicated than in other chapters, so you maywant to focus on using the Analysis ToolPak or PHStat2.

Page 29

Solution Manual For Statistics for Managers Using Microsoft Excel, 7th Edition - Page 29 preview image

Loading page image...

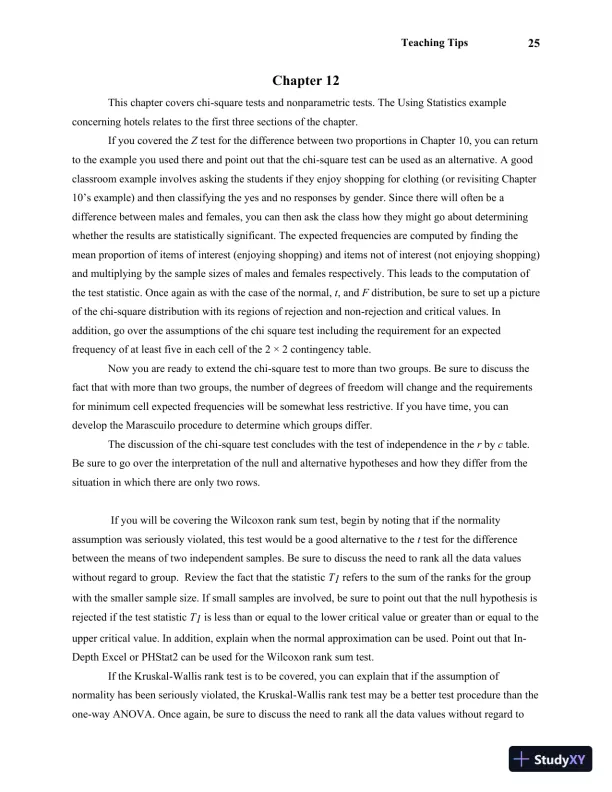
Teaching Tips25Chapter 12This chapter covers chi-square tests and nonparametric tests. The Using Statistics exampleconcerning hotels relates to the first three sections of the chapter.If you covered theZtest for the difference between two proportions in Chapter10, you can returnto the example you used there and point out that the chi-square test can be used as an alternative. A goodclassroom example involves asking the students if they enjoy shopping for clothing(or revisiting Chapter10’s example)and then classifying the yes and no responses by gender. Since there willoftenbe adifference between males and females, you can then ask the class howthey might go about determiningwhether the results are statistically significant. The expected frequencies arecomputed by finding themeanproportion ofitems of interest(enjoying shopping) anditems not of interest(not enjoying shopping)and multiplying by the sample sizes of males and females respectively. This leads to the computation ofthe test statistic. Once again as with the case of the normal,t, andFdistribution, be sure to set up a pictureof the chi-square distribution with its regions of rejection and non-rejection and critical values. Inaddition, go over the assumptions of the chi square test including the requirement for an expectedfrequency of at least five in each cell of the2 × 2contingency table.Now you are ready to extend the chi-square test to more than two groups. Be sure to discuss thefact that with more than two groups, the number of degrees of freedom will change and the requirementsfor minimum cell expected frequencies will be somewhat less restrictive. If you have time, you candevelop the Marascuilo procedure to determine which groups differ.The discussion of the chi-square test concludes with the test of independence in therbyctable.Be sure to go over the interpretation of the null and alternative hypotheses and how they differ from thesituation in which there are only two rows.If you will be covering the Wilcoxon rank sum test, begin by noting that if the normalityassumption was seriously violated, this test would be a good alternative to thettest for the differencebetween the means of two independent samples. Be sure to discuss the need to rank all the data valueswithout regard to group. Review the fact that the statisticT1refers to the sum of the ranks for the groupwith the smaller sample size. If small samples are involved, be sure to point out that the null hypothesis isrejected if the test statisticT1is less than or equal to the lower critical value or greater than or equal to theupper critical value. In addition, explain when the normal approximation can be used. Point out thatIn-Depth ExcelorPHStat2can be used for the Wilcoxon rank sum test.If the Kruskal-Wallisranktest is to be covered, you can explain that if the assumption ofnormality has been seriously violated, the Kruskal-Wallisranktest may be a better test procedure than theone-way ANOVA. Once again, be sure to discuss the need to rank all the data values without regard to

Page 30

Solution Manual For Statistics for Managers Using Microsoft Excel, 7th Edition - Page 30 preview image

Loading page image...

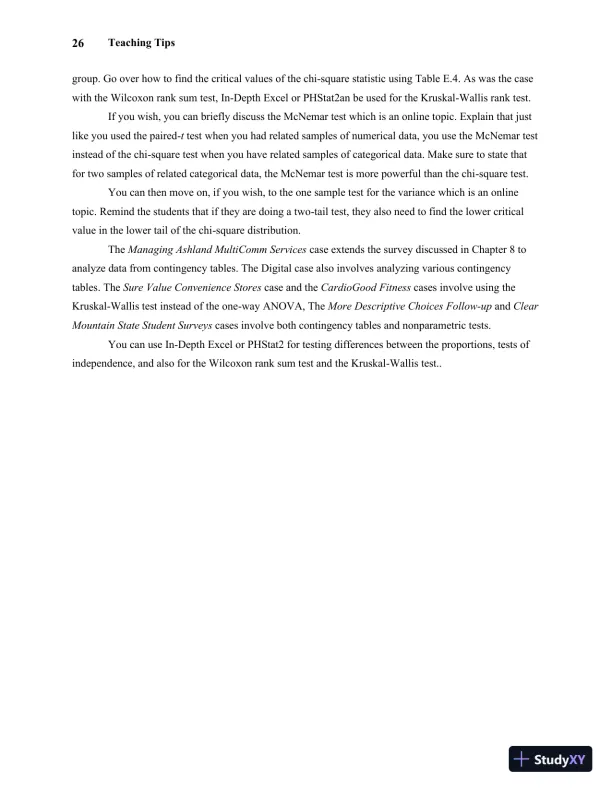
Teaching Tips26group. Go over how tofind thecritical values of thechi-square statistic using Table E.4. As was the casewith the Wilcoxon rank sum test,In-Depth ExcelorPHStat2an be used for the Kruskal-Wallisranktest.If you wish, you can briefly discuss the McNemar testwhich is an online topic. Explain that justlike you usedthe paired-ttest when you had related samples of numerical data, you use the McNemar testinstead of the chi-square test when you have related samples of categorical data. Make sure to state thatfor two samples of related categorical data, the McNemar test is more powerful than the chi-square test.You can then move on, if you wish, to the one sample test for the variancewhich is an onlinetopic. Remind the students that if they are doing a two-tail test, theyalsoneed to find the lower criticalvalue in the lower tail of the chi-square distribution.TheManagingAshland MultiComm Servicescase extends the survey discussed inChapter8toanalyze data from contingency tables. TheDigital casealso involves analyzing various contingencytables.TheSure Value Convenience Storescaseand theCardioGood Fitnesscases involve using theKruskal-Wallis test instead of the one-way ANOVA, TheMore Descriptive Choices Follow-upandClearMountain State Student Surveyscases involve both contingency tables and nonparametric tests.You can useIn-DepthExcelorPHStat2for testing differences between the proportions, tests ofindependence, and also for the Wilcoxon rank sum test and the Kruskal-Wallis test..

Page 31

Solution Manual For Statistics for Managers Using Microsoft Excel, 7th Edition - Page 31 preview image

Loading page image...

Teaching Tips27Chapter 13Regression analysis is probably the most widely used and misused statistical method in businessand economics.You may want to start the chapter with theThink About Thisessay on p.510to showstudents the importance of this topic in business.In an era of easily available statistical and spreadsheetapplications, we believe that the best approach is one that focuses on the interpretation of regressionresultsobtained from suchapplications, the assumptions of regression, how those assumptions can beevaluated, and what can be done if they are violated. Although we also feel that is useful for students towork out at least one example with the aid of a hand calculator, we believe that the focus on handcalculations should be minimized.A good way to begin the discussion of regression analysis is to focus ondevelopinga model thatcan providea better prediction of a variable of interest. The Using Statistics example, which forecastssales for a clothing store, is useful for this purpose.You can extend the DCOVA approach discussedearlier by defining the business objective, discussing data collection, and data organization before movingon to the visualization and analysis in this chapter.Be sure to clearly define the dependent variable andthe independent variable at this point.Once the two types of variables have been defined, the example should be introduced. Explain thegoal of the analysis and how regression can be useful. Follow this with a scatterplotof the two variables.Before developing the Least Squares method, review the straight-line formula and note that differentnotation is used in statistics for the intercept and the slope than in mathematics. At this point,you need todevelop the concept of how the straight line that best fits the data can be found. One approach involvesplotting several lines on a scatterplotand asking the students how they can determine which line fits thedata better than any other. This usually leads to a criterion that minimizes the differences between theactualYvalue and the value that would be predicted by the regression line. Remind the class that whenyou computed the mean in Chapter 3, you found out that the sum of the differences around the mean wasequal to zero. Tell the class that the regression line in two dimensions is similar to the mean in onedimension, and that the differences between the actualYvalue and the value that would be predicted bythe regression line will sum to zero. Students at this point, having covered the variance, will usually tellyou just to square the differences. At this juncture, you might want to substitute the regression equationfor the predicted value, and tell the students that since you are minimizing a quantity, derivatives are used.We discourage you from doing the actual proof, but mentioningderivatives may help some studentsrealize that the calculus they may have learned in mathematics courses is actually used to develop thetheory behind the statistical method. The least-squares concepts discussed can be reinforced by using theVisual Explorationsin StatisticsSimple Linear RegressionCoefficientsprocedureon p.480. Thisprocedure produces a scatterplotwith an unfitted line of regression and a floating control panel of
Preview Mode

This document has 1418 pages. Sign in to access the full document!

Study Now!

XY-Copilot AI
Unlimited Access
Secure Payment
Instant Access
24/7 Support
Document Chat

Related Documents

View all