STAT 250-004 Data Analysis Assignment 4
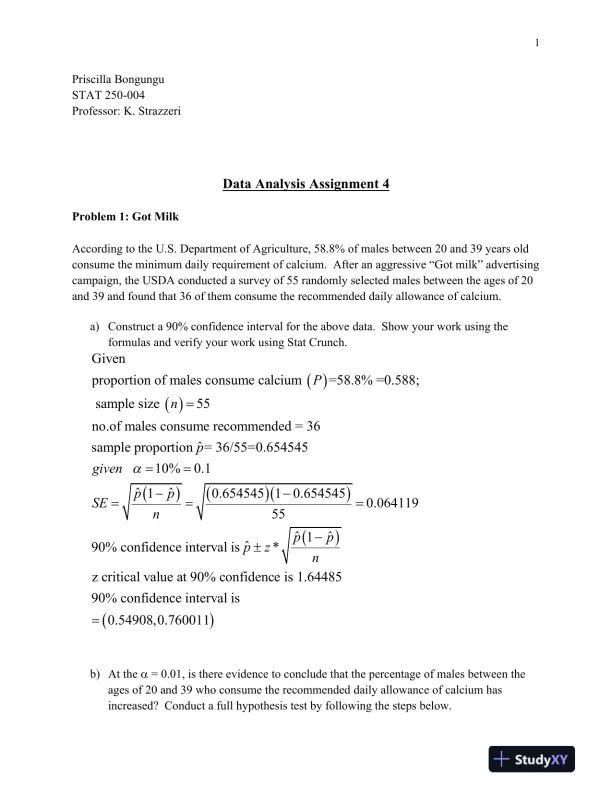
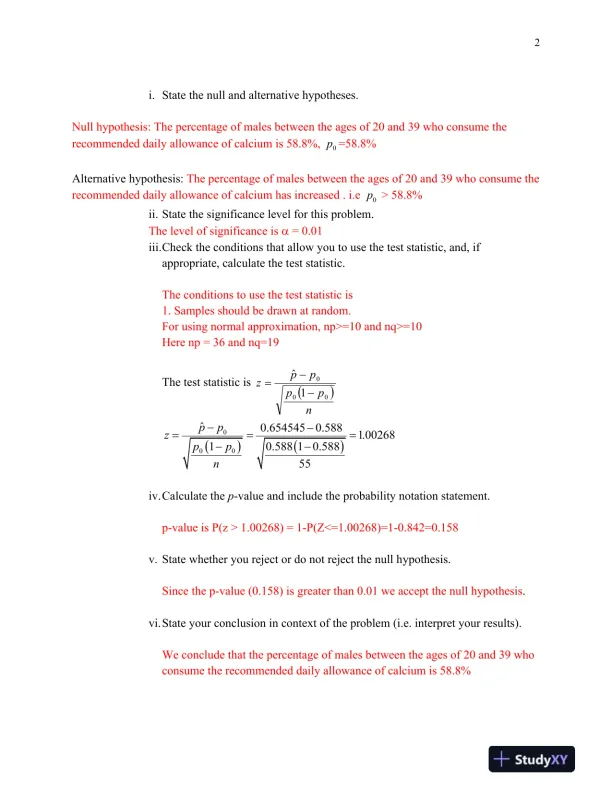
Solved assignment for STAT 250-004, covering data analysis techniques.
Anna Wilson
Contributor
4.1
38
1 day ago
Preview (3 of 8)
Sign in to access the full document!
1
Priscilla Bongungu
STAT 250-004
Professor: K. Strazzeri
Data Analysis Assignment 4
Problem 1: Got Milk
According to the U.S. Department of Agriculture, 58.8% of males between 20 and 39 years old
consume the minimum daily requirement of calcium. After an aggressive “Got milk” advertising
campaign, the USDA conducted a survey of 55 randomly selected males between the ages of 20
and 39 and found that 36 of them consume the recommended daily allowance of calcium.
a) Construct a 90% confidence interval for the above data. Show your work using the
formulas and verify your work using Stat Crunch.
Given
proportion of males consume calcium =58.8% =0.588;
sample size 55
no.of males consume recommended = 36
ˆsample proportion = 36/55=0.654545
10% 0.1
ˆ ˆ1 0.654545 1 0.654545 0.064119
55
P
n
p
given
p p
SE n
ˆ ˆ1
ˆ90% confidence interval is *
z critical value at 90% confidence is 1.64485
90% confidence interval is
0.54908,0.760011
p p
p z n
b) At the = 0.01, is there evidence to conclude that the percentage of males between the
ages of 20 and 39 who consume the recommended daily allowance of calcium has
increased? Conduct a full hypothesis test by following the steps below.
2
i. State the null and alternative hypotheses.
Null hypothesis: The percentage of males between the ages of 20 and 39 who consume the
recommended daily allowance of calcium is 58.8%, 0p =58.8%
Alternative hypothesis: The percentage of males between the ages of 20 and 39 who consume the
recommended daily allowance of calcium has increased . i.e 0p > 58.8%
ii. State the significance level for this problem.
The level of significance is = 0.01
iii.Check the conditions that allow you to use the test statistic, and, if
appropriate, calculate the test statistic.
The conditions to use the test statistic is
1. Samples should be drawn at random.
For using normal approximation, np>=10 and nq>=10
Here np = 36 and nq=19
The test statistic is
n
pp
pp
z
00
0
1
ˆ
0
0 0
ˆ 0.654545 0.588 1.00268
1 0.588 1 0.588
55
p p
z p p
n
iv.Calculate the p-value and include the probability notation statement.
p-value is P(z > 1.00268) = 1-P(Z<=1.00268)=1-0.842=0.158
v. State whether you reject or do not reject the null hypothesis.
Since the p-value (0.158) is greater than 0.01 we accept the null hypothesis.
vi.State your conclusion in context of the problem (i.e. interpret your results).
We conclude that the percentage of males between the ages of 20 and 39 who
consume the recommended daily allowance of calcium is 58.8%
Preview Mode
Sign in to access the full document!
100%
Study Now!
XY-Copilot AI
Unlimited Access
Secure Payment
Instant Access
24/7 Support
Document Chat
Document Details
Subject
Statistics