Statistical Analysis of Factors Influencing GPA: Pearson and Spearman Correlations, Regression Models, and Interpretation

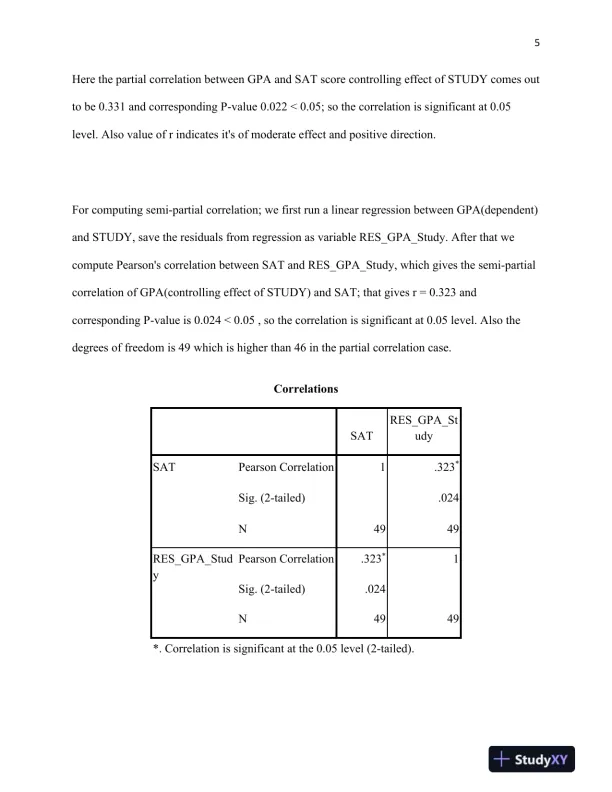
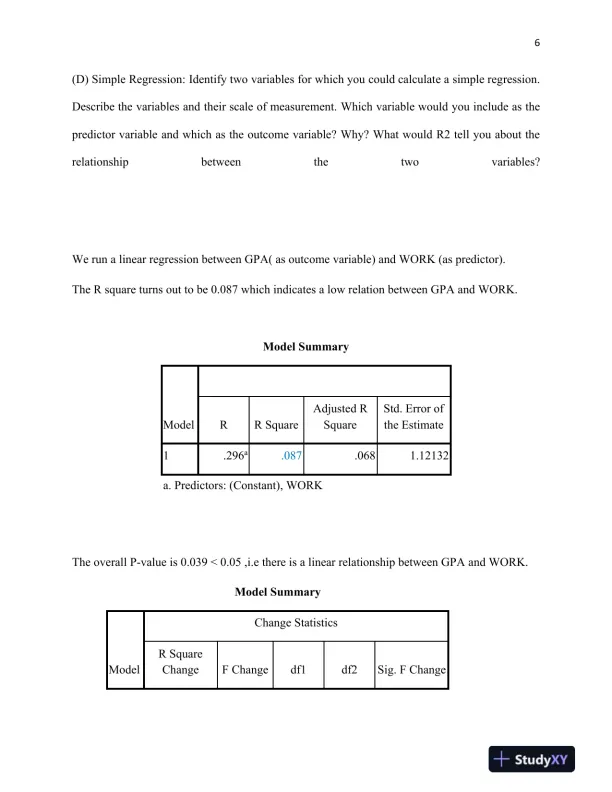
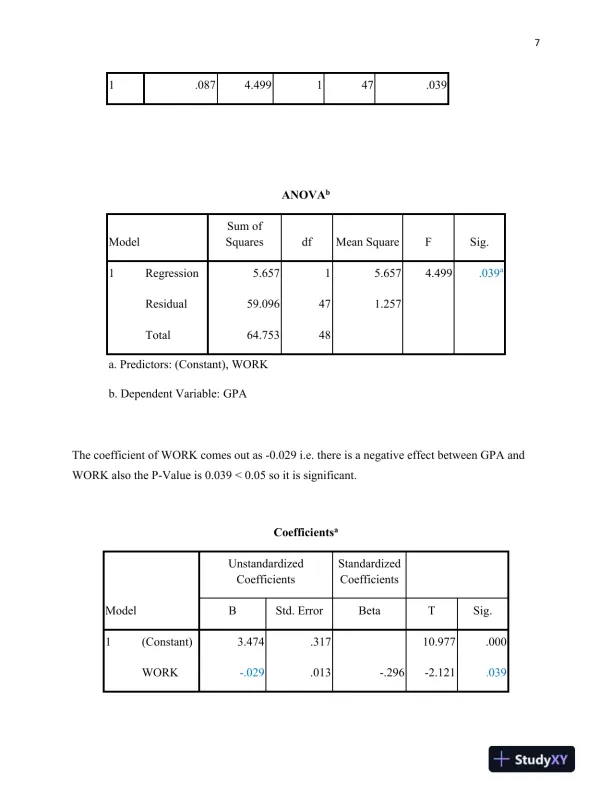
An assignment analyzing GPA factors using statistical correlation and regression models.

Michael Davis
Contributor
4.6
39
5 months ago
Preview (8 of 24 Pages)
100%
Purchase to unlock

Page 1

Statistical Analysis of Factors Influencing GPA: Pearson and Spearman Correlations, Regression Models, and Interpretation - Page 1 preview image

Loading page image...

1Statistical Analysis of Factors Influencing GPA: Pearson and SpearmanCorrelations, Regression Models, and InterpretationThe dataset consist of the followingvariablesunder study:1. GPA (Grade Point Average)Dependentvariable in this study,measured on ratio scale.2. SAT (Scores of Scholastic Aptitude Test)Independentvariable in this study, measured onratio scale.3. STUDY (No. of hours of study)Independentvariable in this study, measured on ratio scale.4. WORK (No. of hours of work)Independentvariable in this study, measured on ratio scale.A fictitious data of49 observations on each of the variables was generated for this analysis.Derived variables:1. exc_gpa : if GPA > 3.51 then exc_gpa =1;else exc_gpa =0. Created to conductlogisticregression.2. RES_GPA_Study: Residualsafter running a linear regression of GPA (dependent variable) onSTUDY(Independent variable). Created for computing semi-partial correlation.All the SPSS outputsare availablein the APPENDIX at the endof this document.(A)Pearson Correlation: Identify two variables for which you could calculate a Pearsoncorrelation coefficient. Describe the variables and their scale of measurement. Now, assume youconducted a Pearson correlation and came up with a significant positive or negative value. Createa mock r value (for example, .3 or-.2). Report your mock finding in APA style (note the text

Page 2

Statistical Analysis of Factors Influencing GPA: Pearson and Spearman Correlations, Regression Models, and Interpretation - Page 2 preview image

Loading page image...

Page 3

Statistical Analysis of Factors Influencing GPA: Pearson and Spearman Correlations, Regression Models, and Interpretation - Page 3 preview image

Loading page image...

2does not use APA style) and interpret the statistic in terms of effect size and R2 while also takingintoaccountthethirdvariableproblemandwellasdirectionofcausality.CorrelationsGPAWORKGPAPearson Correlation1-.296*Sig. (2-tailed).039N4949WORKPearson Correlation-.296*1Sig. (2-tailed).039N4949*. Correlation is significant at the 0.05 level (2-tailed).Here we are computing thePearson'scorrelation between GPA and WORK, which turns outto be r =-0.296 and corresponding P-value is 0.039 < 0.05;so the correlation is significant at0.05 level.Also from the r value we can say it is of moderate effect and direction is negative, i.e.if GPA increases then WORK decreases and vice versa.(B) Spearman’s Correlation: Identify two variables for which you could calculate a Spearman’scorrelation coefficient. Describe the variables and their scale of measurement. Now, assume youconducted a correlation and came up with a significant positive or negative value. Create a mock

Page 4

Statistical Analysis of Factors Influencing GPA: Pearson and Spearman Correlations, Regression Models, and Interpretation - Page 4 preview image

Loading page image...

3r value (for example, .3 or-.2). Report your mock finding in APA style (note the text does notuse APA style) and interpret the statistic in terms of effect size and R2 while also taking intoaccountthethirdvariableproblemandwellasdirectionofcausality.CorrelationsGPAWORKSpearman's rhoGPACorrelationCoefficient1.000-.423**Sig. (2-tailed)..002N4949WORKCorrelationCoefficient-.423**1.000Sig. (2-tailed).002.N4949**. Correlation is significant at the 0.01 level (2-tailed).Here the Spearman's rho between GPA and WORK turns out as r =-0.423 and also thecorresponding P-value is 0.002 < 0.01; sothe correlation is significant at 0.01 level. Again fromthe r value, we cansayit's a moderate effect and negative direction, same interpretation as inPearson's correlation in part (a) above.

Page 5

Statistical Analysis of Factors Influencing GPA: Pearson and Spearman Correlations, Regression Models, and Interpretation - Page 5 preview image

Loading page image...

4(C)Partial Correlation vs. Semi-PartialCorrelation: Identify three variables for which you maybe interested calculating either a partial or semi-partial correlation coefficient. Compare/contrastthese two types of analyses using your variables and research example. Which would you useandwhy?Let there beone dependentvariableY and two independent variables (x1 and x2)Partial Correlation: the correlation between Y and x1 keeping x2 effect isolated from both Y andx1.Semi-Partial Correlation: The correlation between Y and x1 keeping x2 effect isolated fromeitherY or x1.Let's considerthe three variablesto beGPA, SAT and STUDY.Partial CorrCorrelationsControl VariablesGPASATSTUDYGPACorrelation1.000.331Significance (2-tailed)..022Df046SATCorrelation.3311.000Significance (2-tailed).022.Df460

Page 6

Statistical Analysis of Factors Influencing GPA: Pearson and Spearman Correlations, Regression Models, and Interpretation - Page 6 preview image

Loading page image...

5Here the partial correlation between GPA and SAT score controlling effect of STUDY comes outto be 0.331 and corresponding P-value 0.022 < 0.05; so the correlation is significant at 0.05level. Alsovalue of r indicates it's of moderate effect and positive direction.For computing semi-partialcorrelation; we first run a linear regression between GPA(dependent)and STUDY, save the residuals from regression asvariableRES_GPA_Study. After that wecomputePearson'scorrelation between SAT and RES_GPA_Study, which gives the semi-partialcorrelationofGPA(controlling effect of STUDY) and SAT; thatgivesr = 0.323 andcorresponding P-value is 0.024 < 0.05 , so the correlation is significant at 0.05level.Also thedegreesof freedom is 49 which is higher than 46 in the partial correlation case.CorrelationsSATRES_GPA_StudySATPearson Correlation1.323*Sig. (2-tailed).024N4949RES_GPA_StudyPearson Correlation.323*1Sig.(2-tailed).024N4949*. Correlation is significant at the 0.05 level (2-tailed).

Page 7

Statistical Analysis of Factors Influencing GPA: Pearson and Spearman Correlations, Regression Models, and Interpretation - Page 7 preview image

Loading page image...

6(D)Simple Regression: Identify two variables for which you could calculate a simple regression.Describe the variables and their scale of measurement. Whichvariable would you include as thepredictor variable and which as the outcome variable? Why? What would R2 tell you about therelationshipbetweenthetwovariables?We run a linear regression between GPA( as outcome variable) and WORK (as predictor).The R square turns out to be 0.087 which indicates a low relation between GPA and WORK.Model SummaryModelRR SquareAdjusted RSquareStd. Error ofthe Estimate1.296a.087.0681.12132a. Predictors: (Constant), WORKThe overallP-value is 0.039 < 0.05 ,i.e thereis a linear relationship between GPAand WORK.Model SummaryModelChange StatisticsR SquareChangeF Changedf1df2Sig. F Change

Page 8

Statistical Analysis of Factors Influencing GPA: Pearson and Spearman Correlations, Regression Models, and Interpretation - Page 8 preview image

Loading page image...

71.0874.499147.039ANOVAbModelSum ofSquaresdfMean SquareFSig.1Regression5.65715.6574.499.039aResidual59.096471.257Total64.75348a. Predictors: (Constant), WORKb. Dependent Variable: GPAThe coefficient of WORK comes out as-0.029 i.e. there is a negative effect between GPA andWORK alsothe P-Value is 0.039 < 0.05 so it is significant.CoefficientsaModelUnstandardizedCoefficientsStandardizedCoefficientsBStd. ErrorBetaTSig.1(Constant)3.474.31710.977.000WORK-.029.013-.296-2.121.039
Preview Mode

This document has 24 pages. Sign in to access the full document!

Study Now!

XY-Copilot AI
Unlimited Access
Secure Payment
Instant Access
24/7 Support
Document Chat

Document Details

Subject
Statistics

Related Documents

View all