Statistics For Management And Economics, 9th Edition Solution Manual

Statistics For Management And Economics, 9th Edition Solution Manual helps you grasp fundamental concepts with detailed textbook-based explanations.

Christopher Lee
Contributor
4.3
39
5 months ago
Preview (16 of 854 Pages)
100%
Purchase to unlock

Page 1

Statistics For Management And Economics, 9th Edition Solution Manual - Page 1 preview image

Loading page image...

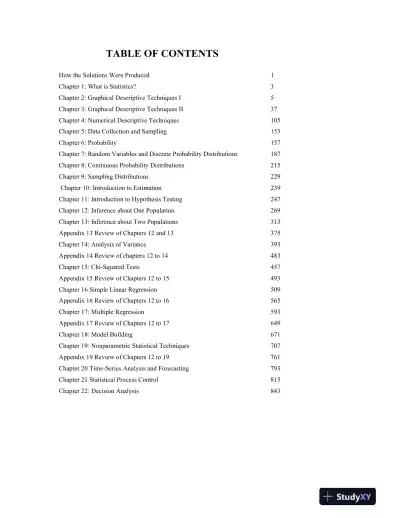
TABLE OF CONTENTSHow the Solutions Were Produced1Chapter 1: What is Statistics?3Chapter 2: Graphical Descriptive TechniquesI5Chapter 3:Graphical Descriptive TechniquesII37Chapter 4: Numerical Descriptive Techniques105Chapter 5: Data Collection and Sampling153Chapter 6: Probability157Chapter 7: Random Variables and Discrete Probability Distributions187Chapter 8: Continuous Probability Distributions215Chapter 9: Sampling Distributions229Chapter 10: Introduction to Estimation239Chapter 11: Introduction to Hypothesis Testing247Chapter 12: Inference about One Population269Chapter 13: Inference about Two Populations313Appendix 13Review of Chapters 12 and 13375Chapter 14: Analysis of Variance393Appendix14Reviewof chapters12to 14483Chapter 15: Chi-Squared Tests457Appendix 15 Review of Chapters 12 to 15493Chapter 16Simple Linear Regression509Appendix 16 Review of Chapters 12 to 16565Chapter 17: Multiple Regression593Appendix 17 Review of Chapters 12 to 17649Chapter 18: Model Building671Chapter 19: Nonparametric Statistical Techniques707Appendix 19 Review of Chapters 12 to 19761Chapter20Time-Series Analysis and Forecasting793Chapter 21Statistical Process Control815Chapter 22:Decision Analysis843

Page 2

Statistics For Management And Economics, 9th Edition Solution Manual - Page 2 preview image

Loading page image...

Page 3

Statistics For Management And Economics, 9th Edition Solution Manual - Page 3 preview image

Loading page image...

1Howthe Solutions WereProducedAll answers have been-double-checked for accuracy. However, we cannot be absolutely certain thatthere are no errors. When and if we discover mistakes we will post corrected answers on our webpage. If you find any errors, please email the author (address on web page). We will be happy toacknowledge you with the discovery.Chapters2and 3Excel was employed to draw the histograms, bar charts, pie charts, line charts, and scatter diagrams.Chapter 4Excel was used to draw box plots andcompute thedescriptive statistics for exercises with data sets.Chapters 6 through 9Probabilities were computed manually. Probability trees were used where possible.Chapters 10 through19 and 21Calculations forexercises that provided statistics either in the exerciseitselfor in Appendix Awerecompleted manually.The solutions to exercises requiring the use of a computer were produced usingExcel.Confidence interval estimates used critical values obtained from the tables in AppendixB. In somecases we were required to use approximations.As a consequence some confidence interval estimates willdiffer slightly from those produced by computer.Intests ofhypothesis where the sampling distributionisnormal,p-values werecomputed manually using Table 3. Excel was employed to calculate the p-value forall other tests.Chapters 13,and Appendixes 13 to 17, and 19We employed the F-test of two variances at the 5% significance level to decide which one of the equal-variances or unequal-variances t-test and estimator of the difference between two means to use to solve theproblem. Additionally, for exercises that compare two populations and are accompanied by data files, our

Page 4

Statistics For Management And Economics, 9th Edition Solution Manual - Page 4 preview image

Loading page image...

2answers were derived by defining the sample from population 1 as the data stored in the first column (oftencolumn A in Excel and column 1 in Minitab). The data stored in the second column represent the samplefrom population 2. Paired differences were defined as the difference between the variable in the firstcolumn minus the variable in the second column.Chapter19 and Appendix 19In the exercises whose datasets contained interval data weuseda nonparametric technique after examiningthe relevant histograms and subjectivelyjudging the variable to be “extremelynonnormal.”Chapters17 and18Excel produced all the solutions to these exercises.Chapter 20Most solutions were produced manually. Excel solved the more time-consuming exercises.Chapter 21All control charts were produced by Excel.Chapter 22Solutions to these exercises were completed manually.

Page 5

Statistics For Management And Economics, 9th Edition Solution Manual - Page 5 preview image

Loading page image...

3Chapter 11.2 Descriptive statistics summarizes a set of data. Inferential statistics makes inferences aboutpopulations from samples.1.3aThe political choices of the 25,000 registered votersb The political choices of the 200 voters interviewedc Statistic1.4aThe complete production runb 1000 chipsc Proportion of the production run that is defectived Proportion of sample chips that are defective (7.5%)e Parameterf Statisticg Because the sample proportion is less than 10%, we can conclude that the claim is true.1.5 Survey graduates of your major as well as others and ask each person to report his or herhighest starting salary offer. Use statistical techniques to compare results.1.6a Flip the coin 100 times and count the number of heads and tailsb Outcomes of flipsc Outcomes of the 100 flipsd Proportion of headse Proportion of heads in the 100 flips1.8a The population consists of the fuel mileage of all the taxis in the fleet.b The owner would like to know the mean mileage.c The sample consists of the 50 observations.d The statistic the owner would use is the mean of the 50 observations.e The statistic would be used to estimate the parameter from which the owner can calculate totalcosts.We computed the sample mean to be 19.8 mpg.

Page 6

Statistics For Management And Economics, 9th Edition Solution Manual - Page 6 preview image

Loading page image...

5Chapter 22.1 Nominal: Occupation, undergraduate major. Ordinal: Rating of university professor, Taste testratings. Interval: age, income2.2 a Intervalb Intervalc Nominald Ordinal2.3 a Intervalb Nominalc Ordinald Intervale Interval2.4 a Nominalb Intervalc Nominald Intervale Ordinal2.5 a Intervalb Intervalc Nominald Intervale Nominal2.6 a Intervalb Intervalc Nominald Ordinale Interval2.7 a Intervalb Nominalc. Nominal

Page 7

Statistics For Management And Economics, 9th Edition Solution Manual - Page 7 preview image

Loading page image...

6d IntervaleIntervalf Ordinal2.8 a Intervalb Ordinalc Nominald Ordinal2.9 a Intervalb Nominalc Nominal2.10 a Ordinalb Ordinalc Ordinal2.11050,000,000,000100,000,000,000150,000,000,000200,000,000,000250,000,000,000300,000,000,000

Page 8

Statistics For Management And Economics, 9th Edition Solution Manual - Page 8 preview image

Loading page image...

72.12Brazil, 1%Canada, 14%China, 1%Iran, 11%Iraq, 9%Kazakhstan, 2%Kuwait, 8%Libya, 4%Nigeria, 3%Qatar, 1%Russia, 5%Saudi Arabia,22%United ArabEmirates, 8%UnitedStates, 2%Venezuela, 8%2.1305,000,00010,000,00015,000,00020,000,00025,000,000

Page 9

Statistics For Management And Economics, 9th Edition Solution Manual - Page 9 preview image

Loading page image...

82.14Gasoline51%Distillate fuel oil15%Jet fuel13%Still gas5%Marketablecoke5%Residual fuel oil3%Liquifiedrefinerygas3%Asphalt androad oil2%Lubricants1%Other2%2.15Coal48.0%Oil28.8%Natural gas17.6%Nuclear0.0%Hydroelectric1.2%Biomass4.1%Other0.3%

Page 10

Statistics For Management And Economics, 9th Edition Solution Manual - Page 10 preview image

Loading page image...

92.16010002000300040005000600070002.170100200300400500600BelgiumBrazilCanadaChinaFranceGermanyIndiaIranItalyJapanMexicoPolandRussiaSouth KoreaSpainTaiwanTurkeyUkraineUnited KingdomUnited States

Page 11

Statistics For Management And Economics, 9th Edition Solution Manual - Page 11 preview image

Loading page image...

102.18Paper andpaperboard,34%Glass, 5%Metals, 8%Plastics, 12%Rubber andleather, 3%Textiles, 5%Wood, 5%Food scraps,12%Yard trimmings,13%Other, 3%2.19ResidentialRecycled Plastic,1%Recycled Glass,3%Recycled Paper,14%RecycledMetal, 1%RecycledOrganic/Food,7%RecycledOrganic/ Yard,10%Recycled Other,4%DisposedPlastic, 7%DiscposedPaper, 12%Disposed Metal,2%DisposedOrganic, 23%Disposed Other,17%

Page 12

Statistics For Management And Economics, 9th Edition Solution Manual - Page 12 preview image

Loading page image...

11Non-ResidentialRecycled Glass ,1%RecycledPaper, 11%RecycledMetal, 3%RecycledOrganic, 1%RecycledConstruction/Demolition, 1%RecycledOther, 1%DisposedPlastic, 10%Disposed Glass,3%Disposed Paper,31%Disposed Metal,8%Disposed Organic,18%DisposedConstruction/Demolition, 7%Disposed Other,6%2.20 a.0100200300400500600700800

Page 13

Statistics For Management And Economics, 9th Edition Solution Manual - Page 13 preview image

Loading page image...

12b.Algeria5%Angola6%Canada22%Iraq6%Kuwait2%Mexico16%Nigeria12%Saudi Arabia17%United Kingdom1%Venezuela13%The bar chart provides the frequencies and the pie chart displays the relative frequencies.2.21Males0.05.010.015.020.025.030.035.0Under 1818-2425-3435-4545-64

Page 14

Statistics For Management And Economics, 9th Edition Solution Manual - Page 14 preview image

Loading page image...

13Females0.05.010.015.020.025.030.035.0Under 1818-2425-3435-4545-642.22050100150200250300FourticketsParkingTwo ballcapsTwo beersTwo drinksFour hotdogsNFLCFL

Page 15

Statistics For Management And Economics, 9th Edition Solution Manual - Page 15 preview image

Loading page image...

142.2301234562.24Buy something40%Pay down debt27%Invest19%Pay medicalbills6%Save5%Other3%

Page 16

Statistics For Management And Economics, 9th Edition Solution Manual - Page 16 preview image

Loading page image...

152.25Homeimprovement13%Appliances3%Automobles3%Clothing8%Electronics8%Furniture3%Gas19%Spa/salon time3%Groceries23%Vacation11%Impulse4%Down paymenthouse2%2.26Location39%Majors22%Academicreputation10%Career focus16%Community5%Number ofstudents8%
Preview Mode

This document has 854 pages. Sign in to access the full document!

Study Now!

XY-Copilot AI
Unlimited Access
Secure Payment
Instant Access
24/7 Support
Document Chat

Document Details

Subject
Statistics

Related Documents

View all