Elementary Statistics, 13th Edition Test Bank

Elementary Statistics, 13th Edition Test Bank ensures you're fully prepared with expert-verified questions and solutions.

Christopher Lee
Contributor
4.6
160
9 months ago
Preview (31 of 239 Pages)
100%
Purchase to unlock

Page 1

Elementary Statistics, 13th Edition Test Bank - Page 1 preview image

Loading page image...

ONLINETESTBANKLAURAIOSSIBroward CollegeELEMENTARYSTATISTICSTHIRTEENTH EDITIONMario F. Triola

Page 2

Elementary Statistics, 13th Edition Test Bank - Page 2 preview image

Loading page image...

Page 3

Elementary Statistics, 13th Edition Test Bank - Page 3 preview image

Loading page image...

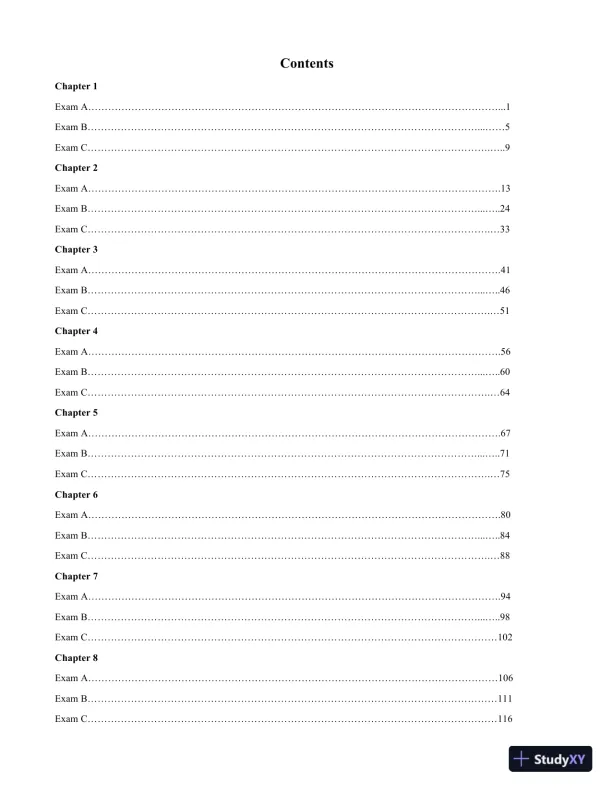
ContentsChapter 1Exam A……………………………………………………………………………………………………………...1Exam B………………………………………………………………………………………………………...……5Exam C………………………………………………………………………………………………………….…..9Chapter 2Exam A…………………………………………………………………………………………………………….13Exam B………………………………………………………………………………………………………...…..24Exam C………………………………………………………………………………………………………….…33Chapter 3Exam A…………………………………………………………………………………………………………….41Exam B………………………………………………………………………………………………………...…..46Exam C………………………………………………………………………………………………………….…51Chapter 4Exam A…………………………………………………………………………………………………………….56Exam B………………………………………………………………………………………………………...…..60Exam C………………………………………………………………………………………………………….…64Chapter 5Exam A…………………………………………………………………………………………………………….67Exam B………………………………………………………………………………………………………...…..71Exam C………………………………………………………………………………………………………….…75Chapter 6Exam A…………………………………………………………………………………………………………….80Exam B………………………………………………………………………………………………………...…..84Exam C………………………………………………………………………………………………………….…88Chapter 7Exam A…………………………………………………………………………………………………………….94Exam B………………………………………………………………………………………………………...…..98Exam C……………………………………………………………………………………………………………102Chapter 8Exam A……………………………………………………………………………………………………………106Exam B……………………………………………………………………………………………………………111Exam C……………………………………………………………………………………………………………116

Page 4

Elementary Statistics, 13th Edition Test Bank - Page 4 preview image

Loading page image...

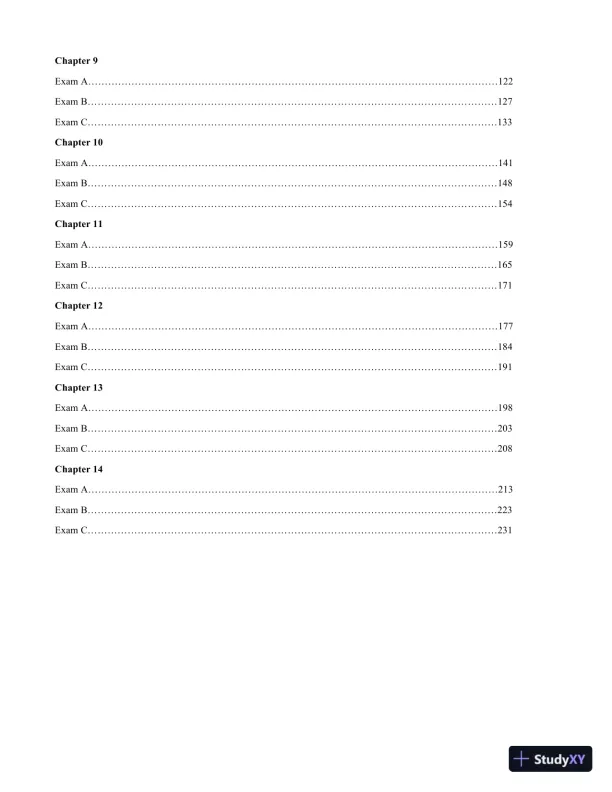
Chapter 9Exam A……………………………………………………………………………………………………………122Exam B……………………………………………………………………………………………………………127Exam C……………………………………………………………………………………………………………133Chapter 10Exam A……………………………………………………………………………………………………………141Exam B……………………………………………………………………………………………………………148Exam C……………………………………………………………………………………………………………154Chapter 11Exam A……………………………………………………………………………………………………………159Exam B……………………………………………………………………………………………………………165Exam C……………………………………………………………………………………………………………171Chapter 12Exam A……………………………………………………………………………………………………………177Exam B……………………………………………………………………………………………………………184Exam C……………………………………………………………………………………………………………191Chapter 13Exam A……………………………………………………………………………………………………………198Exam B……………………………………………………………………………………………………………203Exam C……………………………………………………………………………………………………………208Chapter 14Exam A……………………………………………………………………………………………………………213Exam B……………………………………………………………………………………………………………223Exam C……………………………………………………………………………………………………………231

Page 5

Elementary Statistics, 13th Edition Test Bank - Page 5 preview image

Loading page image...

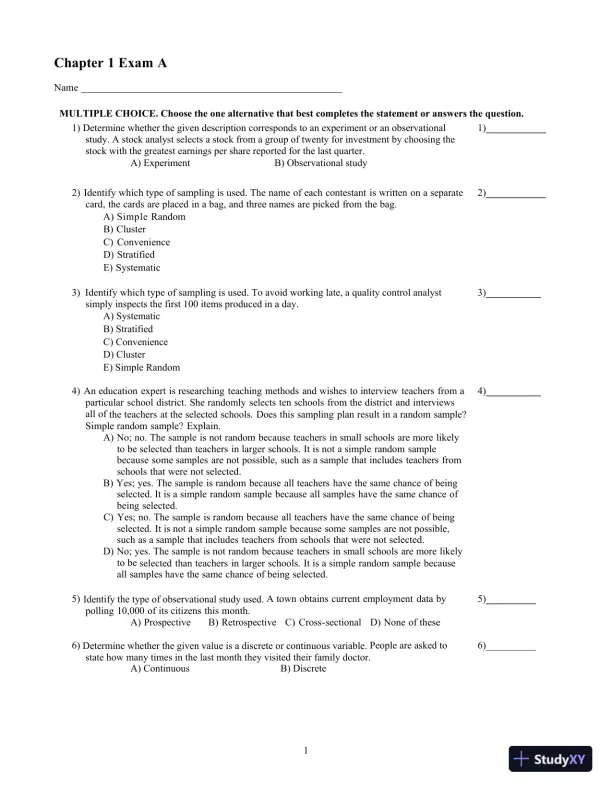
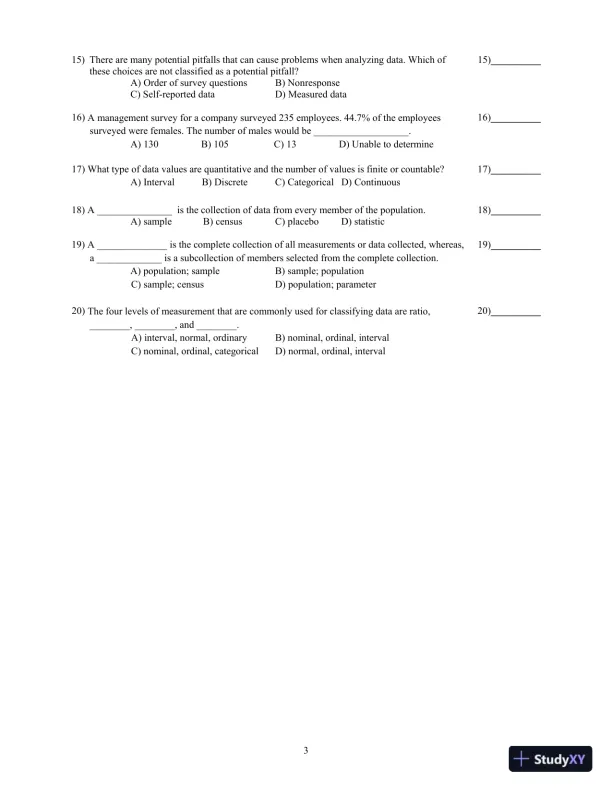
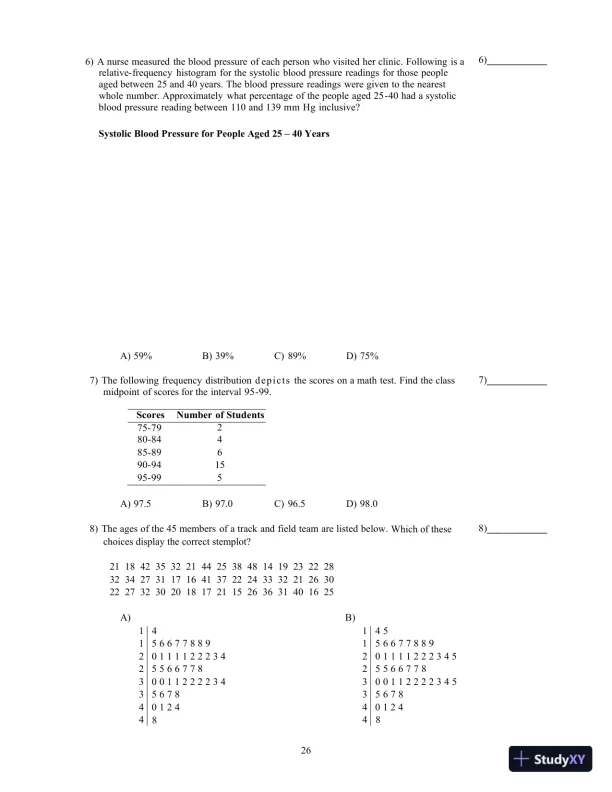
1Chapter 1 ExamANameMULTIPLE CHOICE. Choose the one alternative that best completes the statement or answers the question.1) Determine whether the given description corresponds to an experiment or an observationalstudy. A stock analyst selects a stock from a group of twenty for investment by choosing thestock with the greatest earnings per share reported for the last quarter.A) ExperimentB) Observational study1)____________2)Identify which type of sampling is used.The name of each contestant is written on a separatecard, the cards are placed in a bag, andthreenames are picked from thebag.A) SimpleRandomB)ClusterC)ConvenienceD)StratifiedE)Systematic2)____________3)Identify which type of sampling is used.To avoid working late, a quality control analystsimply inspects the first 100 items produced in a day.A) SystematicB) StratifiedC) ConvenienceD) ClusterE) Simple Random3)___________4) An education expert is researching teaching methods and wishes to interview teachers fromaparticular school district. She randomly selects ten schools from the district and interviewsallofthe teachers at the selected schools. Does this sampling plan result in a random sample?Simplerandom sample?Explain.A) No; no. The sample is not random because teachers in small schools are more likelytobeselected than teachers in larger schools. It is not a simple random samplebecausesomesamples are not possible, such as a sample that includes teachers fromschools that werenot selected.B) Yes; yes. The sample is random because all teachers have the same chance of beingselected.It is a simple random sample because all samples have the same chance ofbeingselected.C) Yes; no. The sample is random because all teachers have the same chance of beingselected.Itis not a simple random sample because some samples are not possible,such as a samplethatincludes teachers from schools that were notselected.D) No; yes. The sample is not random because teachers in small schools are more likelytobeselected than teachers in larger schools. It is a simple random sample becauseallsampleshave the same chance of beingselected.4)___________5) Identify the type of observational study used. A town obtains current employment data bypolling 10,000 of its citizens thismonth.A) ProspectiveB) RetrospectiveC) Cross-sectionalD) None ofthese5)__________6) Determine whether the given value is a discrete or continuous variable. People are asked tostate how many times in the last month they visited their family doctor.A) ContinuousB) Discrete6)__________

Page 6

Elementary Statistics, 13th Edition Test Bank - Page 6 preview image

Loading page image...

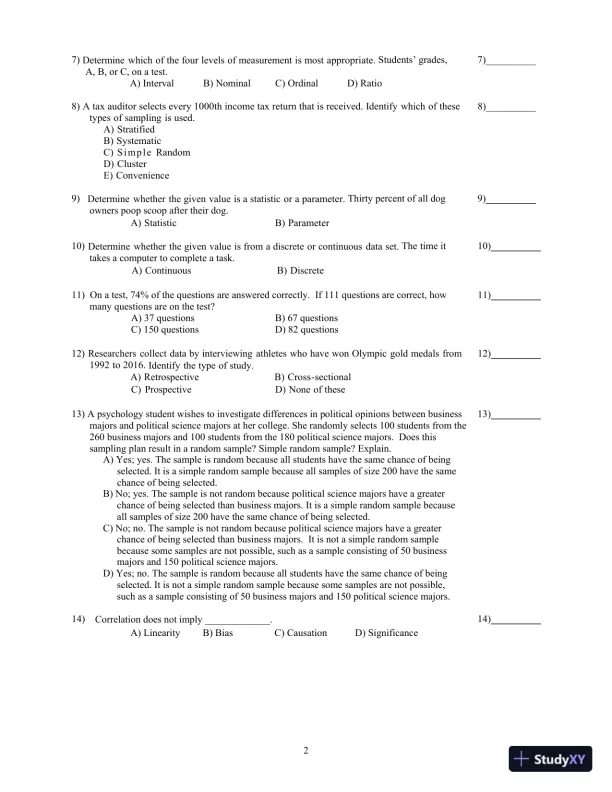
27) Determine which of the four levels of measurement is mostappropriate.Students’ grades,A, B, or C, on a test.A) IntervalB) NominalC) OrdinalD) Ratio7)__________8) A tax auditor selects every 1000th income tax return that is received.Identify which of thesetypes of sampling is used.A)StratifiedB)SystematicC) S i m p l eRandomD)ClusterE)Convenience8)__________9)Determine whether the given value is a statistic or aparameter.Thirty percent of all dogowners poop scoop after their dog.A) StatisticB)Parameter9)__________10) Determine whether the given value is from a discrete or continuous dataset.The time ittakes a computer to complete a task.A) ContinuousB)Discrete10)__________11) On a test, 74% of the questions are answered correctly. If 111 questions are correct, howmany questions are on the test?A) 37 questionsB) 67 questionsC) 150 questionsD) 82 questions11)__________12) Researchers collect data by interviewing athletes who have won Olympic gold medals from1992to 2016.Identify the type of study.A) RetrospectiveB)Cross-sectionalC) ProspectiveD) None ofthese12)__________13) A psychology student wishes to investigate differences in political opinions between businessmajors and political science majors at her college. She randomly selects 100 students from the260 business majors and 100 students from the 180 political science majors. Does thissampling plan result in a random sample? Simple random sample? Explain.A) Yes; yes. The sample is random because all students have the same chance of beingselected. It is a simple random sample because all samples of size 200 have the samechance of being selected.B) No; yes. The sample is not random because political science majors have a greaterchance of being selected than business majors. It is a simple random sample becauseall samples of size 200 have the same chance of being selected.C) No; no. The sample is not random because political science majors have a greaterchance of being selected than business majors. It is not a simple random samplebecause some samples are not possible, such as a sample consisting of 50 businessmajors and 150 political science majors.D) Yes; no. The sample is random because all students have the same chance of beingselected. It is not a simple random sample because some samples are not possible,such as a sample consisting of 50 business majors and 150 political science majors.13)__________14)Correlation does not imply _____________.A) LinearityB) BiasC) CausationD) Significance14)__________

Page 7

Elementary Statistics, 13th Edition Test Bank - Page 7 preview image

Loading page image...

315) There are many potential pitfalls that can cause problems when analyzing data. Which ofthese choices are not classified as a potential pitfall?A) Order of survey questionsB) NonresponseC) Self-reported dataD) Measured data15)__________16) A management survey for a company surveyed 235 employees. 44.7% of the employeessurveyed were females. The number of males would be ___________________.A) 130B) 105C) 13D) Unable to determine16)__________17) What type of data values are quantitative and the number of values is finite or countable?A) IntervalB) DiscreteC) CategoricalD) Continuous17)__________18) A _______________ is the collection of data from every member of the population.A) sampleB) censusC) placeboD) statistic18)__________19) A ______________ is the complete collection of all measurements or data collected, whereas,a _____________ is a subcollection of members selected from the complete collection.A) population; sampleB) sample; populationC) sample; censusD) population; parameter19)__________20) The four levels of measurement that are commonly used for classifying data are ratio,________, ________, and ________.A) interval, normal, ordinaryB) nominal, ordinal, intervalC) nominal, ordinal, categoricalD) normal, ordinal, interval20)__________

Page 8

Elementary Statistics, 13th Edition Test Bank - Page 8 preview image

Loading page image...

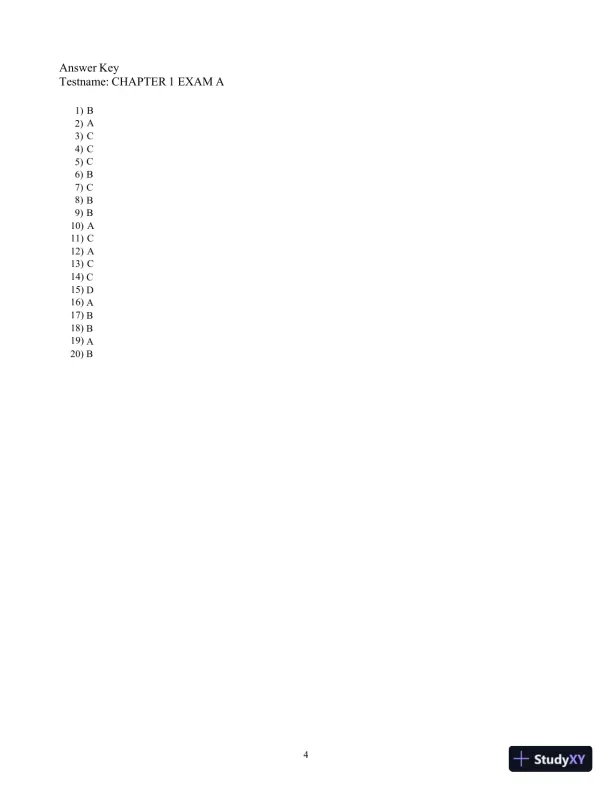
4Answer KeyTestname: CHAPTER 1 EXAM A1)B2)A3)C4)C5)C6)B7)C8)B9)B10)A11)C12)A13)C14)C15)D16)A17)B18) B19)A20) B

Page 9

Elementary Statistics, 13th Edition Test Bank - Page 9 preview image

Loading page image...

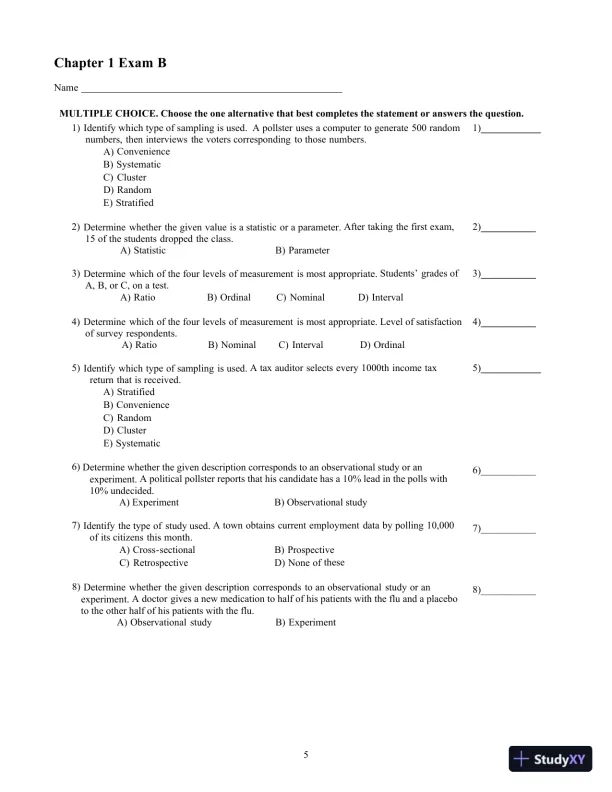
5Chapter 1 ExamBNameMULTIPLE CHOICE. Choose the one alternative that best completes the statement or answers the question.1)Identify which type of sampling is used.A pollster uses a computer to generate 500 randomnumbers, then interviews thevoterscorresponding to thosenumbers.A)ConvenienceB)SystematicC)ClusterD)RandomE)Stratified1)____________2) Determine whether the given value is a statistic or aparameter.After taking the first exam,15 of the students dropped theclass.A) StatisticB)Parameter2)___________3) Determine which of the four levels of measurement is mostappropriate.Students’ grades ofA, B, or C, on atest.A) RatioB) OrdinalC) NominalD)Interval3)___________4) Determine which of the four levels of measurement is mostappropriate.Level of satisfactionof surveyrespondents.A) RatioB) NominalC) IntervalD)Ordinal4)___________5) Identify which type of sampling is used. A tax auditor selects every 1000th income taxreturn that isreceived.A)StratifiedB)ConvenienceC)RandomD)ClusterE)Systematic5)____________6) Determine whether the given description corresponds to an observational study or anexperiment. A political pollster reports that his candidate has a 10% lead in the polls with10% undecided.A) ExperimentB) Observational study6)___________7) Identify the type of study used. A town obtains current employment data by polling 10,000of its citizens thismonth.A) Cross-sectionalB) ProspectiveC) RetrospectiveD) None ofthese7)___________8) Determine whether the given description corresponds to an observational study or anexperiment.A doctor gives a new medication to half of his patients with the flu and a placeboto the other half of his patients with the flu.A) Observational studyB)Experiment8)___________

Page 10

Elementary Statistics, 13th Edition Test Bank - Page 10 preview image

Loading page image...

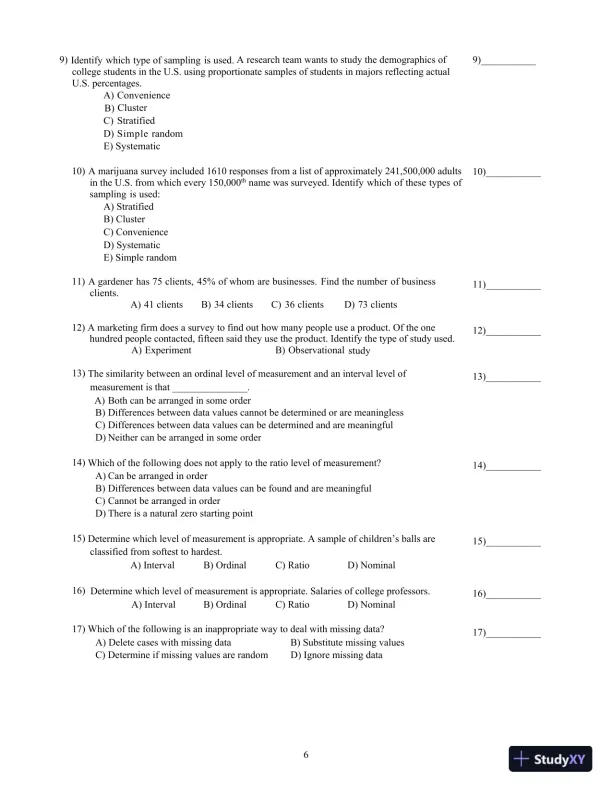
69) Identify which type of sampling is used. A research team wants to study the demographics ofcollege students in the U.S. using proportionate samples of students in majors reflecting actualU.S. percentages.A)ConvenienceB)ClusterC)StratifiedD) SimplerandomE) Systematic9)___________10) A marijuana survey included 1610 responses from a list of approximately 241,500,000 adultsin the U.S. from which every 150,000thname was surveyed.Identify which of these types ofsampling is used:A) StratifiedB) ClusterC) ConvenienceD) SystematicE) Simple random10)___________11) A gardener has 75 clients, 45% of whom are businesses. Find the number of businessclients.A) 41 clientsB) 34 clientsC) 36 clientsD) 73clients11)___________12) A marketing firm does a survey to find out how many people use a product. Of the onehundred people contacted, fifteen said they use the product. Identify the type of study used.A) ExperimentB) Observationalstudy12)___________13) The similarity between an ordinal level of measurement and an interval level ofmeasurement is that _______________.A)Both can be arranged in some orderB)Differences between data values cannot be determined or are meaninglessC)Differences between data values can be determined and are meaningfulD)Neither can be arranged in some order13)___________14) Which of the following does not apply to the ratio level of measurement?A)Can be arranged in orderB)Differences between data values can be found and are meaningfulC)Cannot be arranged in orderD)There is a natural zero starting point14)___________15) Determine which level of measurement is appropriate. A sample of children’s balls areclassified from softest to hardest.A) IntervalB) OrdinalC) RatioD) Nominal15)___________16) Determine which level of measurement is appropriate. Salaries of college professors.A) IntervalB) OrdinalC) RatioD) Nominal16)___________17) Which of the following is an inappropriate way to deal with missing data?A) Delete cases with missing dataB) Substitute missing valuesC) Determine if missing values are randomD) Ignore missing data17)___________

Page 11

Elementary Statistics, 13th Edition Test Bank - Page 11 preview image

Loading page image...

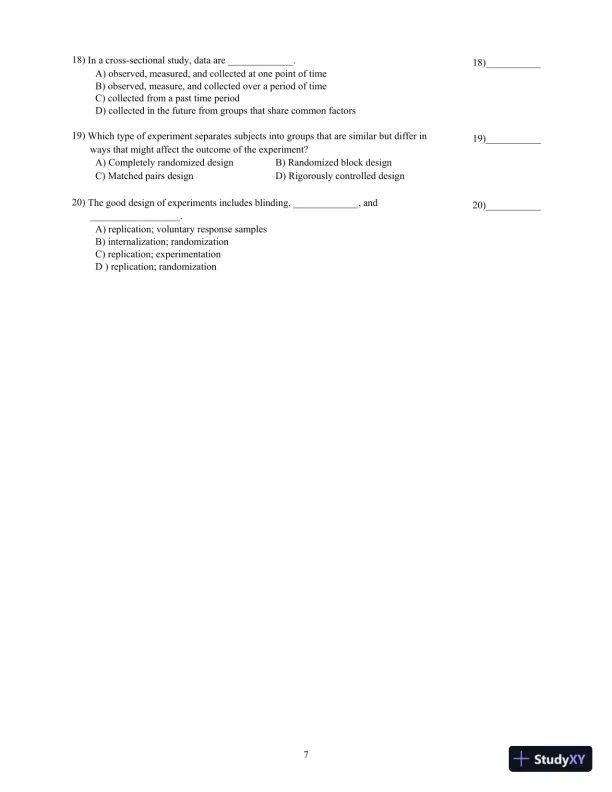
718) In a cross-sectional study, data are _____________.A) observed, measured, and collected at one point of timeB) observed, measure, and collected over a period of timeC) collected from a past time periodD) collected in the future from groups that share common factors18)___________19) Which type of experiment separates subjects into groups that are similar but differ inways that might affect the outcome of the experiment?A) Completely randomized designB) Randomized block designC) Matched pairs designD) Rigorously controlled design19)___________20) The good design of experiments includes blinding, _____________, and__________________.A) replication; voluntary response samplesB) internalization; randomizationC) replication; experimentationD ) replication; randomization20)___________

Page 12

Elementary Statistics, 13th Edition Test Bank - Page 12 preview image

Loading page image...

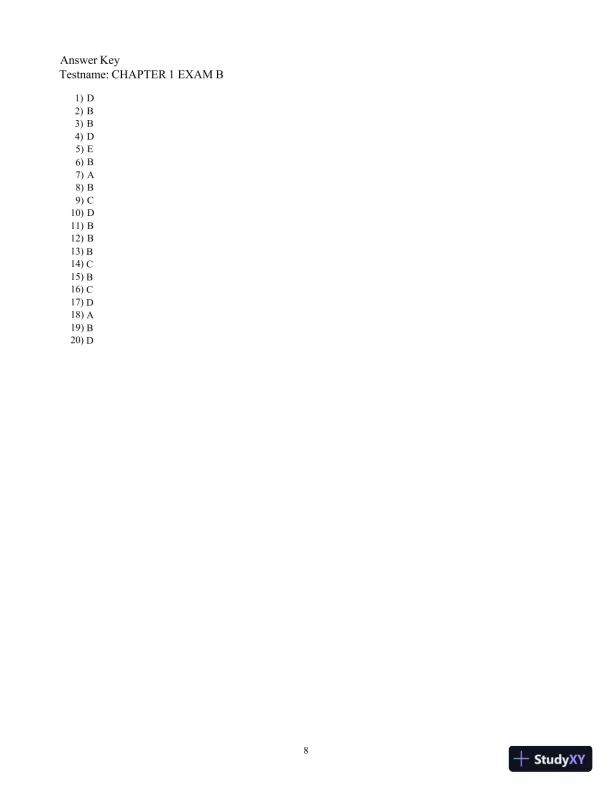
8Answer KeyTestname: CHAPTER 1 EXAM B1)D2)B3)B4)D5)E6)B7)A8)B9)C10)D11)B12)B13) B14) C15) B16) C17) D18)A19)B20) D

Page 13

Elementary Statistics, 13th Edition Test Bank - Page 13 preview image

Loading page image...

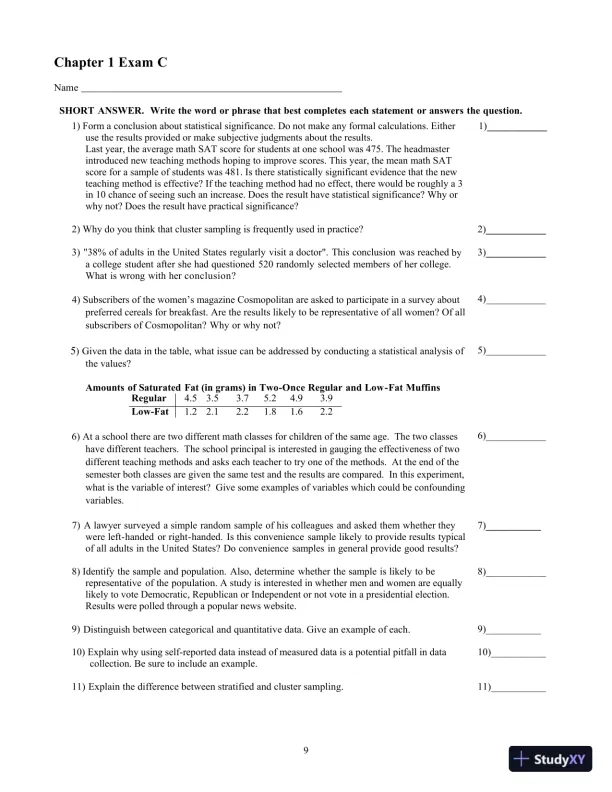
9Chapter 1 ExamCNameSHORT ANSWER. Write the word or phrase that best completes each statement or answers thequestion.1) Form a conclusion about statistical significance. Do not make any formal calculations. Eitheruse the results provided or make subjective judgments about the results.Last year, the average math SAT score for students at one school was 475. The headmasterintroduced new teaching methods hoping to improve scores. This year, the mean math SATscore for a sample of students was 481. Is there statistically significant evidence that the newteaching method is effective? If the teaching method had no effect, there would be roughly a 3in 10 chance of seeing such an increase. Does the result have statistical significance? Why orwhy not? Does the result have practical significance?1)____________2) Why do you think that cluster sampling is frequently used in practice?2)____________3) "38% of adults in the United States regularly visit a doctor". This conclusion wasreachedbya college student after she had questioned 520 randomly selected members ofhercollege.What is wrong with her conclusion?3)____________4) Subscribers of the women’s magazine Cosmopolitan are asked to participate in a survey aboutpreferred cereals for breakfast. Are the results likely to be representative of all women? Of allsubscribers of Cosmopolitan? Why or whynot?4)____________5)Given the data in the table, what issue can be addressed by conducting a statistical analysis ofthe values?Amounts of Saturated Fat (in grams) in Two-Once Regular andLow-FatMuffinsRegular4.53.53.75.24.93.9Low-Fat1.22.12.21.81.62.25)____________6) At a school there are two different math classes for children of the same age. The two classeshave different teachers. The school principal is interested in gauging the effectiveness of twodifferent teaching methods and asks each teacher to try one of the methods. At the end of thesemester both classes are given the same test and the results are compared. In this experiment,what is the variable of interest? Give some examples of variables which could be confoundingvariables.6)____________7) A lawyer surveyed a simple random sample of his colleagues and asked themwhethertheywere left-handed or right-handed. Is this convenience sample likely toprovideresults typicalof all adults in the United States? Do convenience samples ingeneralprovide goodresults?7)___________8) Identify the sample and population. Also, determine whether the sample is likely to berepresentative of thepopulation.A study is interested in whether men and women are equallylikely to vote Democratic, Republican or Independent or not vote in a presidential election.Results were polled through a popular news website.8)____________9)Distinguishbetweencategoricalandquantitativedata.Giveanexampleofeach.9)___________10) Explain why using self-reported data instead of measured data is a potential pitfall in datacollection. Be sure to include an example.10)___________11)Explainthedifferencebetweenstratifiedandclustersampling.11)___________

Page 14

Elementary Statistics, 13th Edition Test Bank - Page 14 preview image

Loading page image...

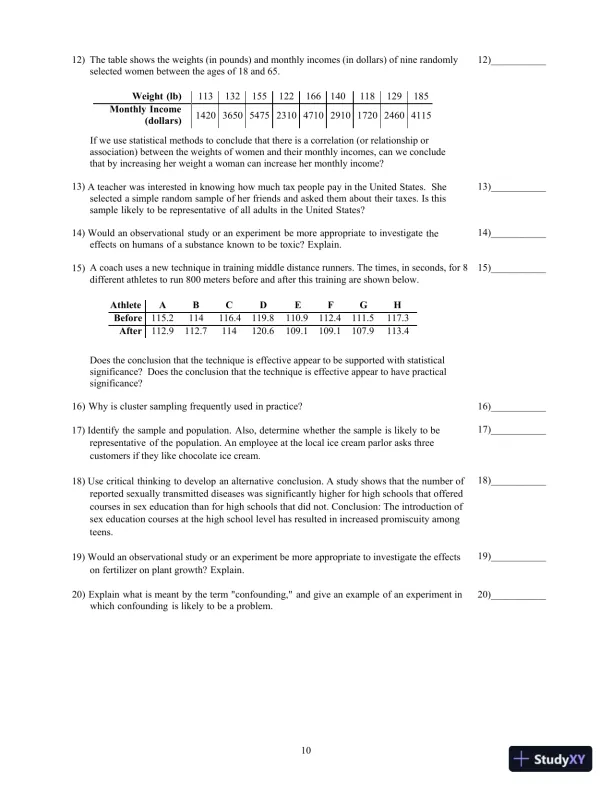
1012) The table shows the weights (in pounds) and monthly incomes (in dollars) of nine randomlyselected women between the ages of 18 and 65.If we use statistical methods to conclude that there is a correlation (or relationship orassociation) between the weights of women and their monthly incomes, can we concludethat by increasing her weight a woman can increase her monthly income?Weight(lb)113132155122166140118129185Monthly Income(dollars)14203650547523104710291017202460411512)___________13) A teacher was interested in knowing how much tax people pay in the United States.Sheselected a simple random sample of her friends and asked them about their taxes. Isthissample likely to be representative of all adults in the UnitedStates?13)___________14) Would an observational study or an experiment be more appropriate to investigatetheeffects on humans of a substance known to be toxic?Explain.14)___________15) A coach uses a new technique in training middle distance runners. The times, in seconds, for 8different athletes to run 800 meters before and after this training are shown below.Does the conclusion that the technique is effective appear to be supported with statisticalsignificance? Does the conclusion that the technique is effective appear to have practicalsignificance?AthleteABCDEFGHBefore115.2114116.4119.8110.9112.4111.5117.3After112.9112.7114120.6109.1109.1107.9113.415)___________16)Why isclustersamplingfrequentlyusedinpractice?16)___________17)Identify the sample and population. Also, determine whether the sample is likely to berepresentative of thepopulation.An employee at the local ice cream parlor asks threecustomers if they like chocolate ice cream.17)___________18)Use critical thinking to develop an alternativeconclusion. A study shows that the number ofreported sexually transmitted diseases was significantly higher for high schools that offeredcourses in sex education than for high schools that did not. Conclusion: The introduction ofsex education courses at the high school level has resulted in increased promiscuity amongteens.18)___________19) Would an observational study or an experiment be more appropriate to investigate the effectson fertilizer on plant growth?Explain.19)___________20) Explain what is meant by the term "confounding," and give an example of anexperimentinwhich confounding is likely to be aproblem.20)___________

Page 15

Elementary Statistics, 13th Edition Test Bank - Page 15 preview image

Loading page image...

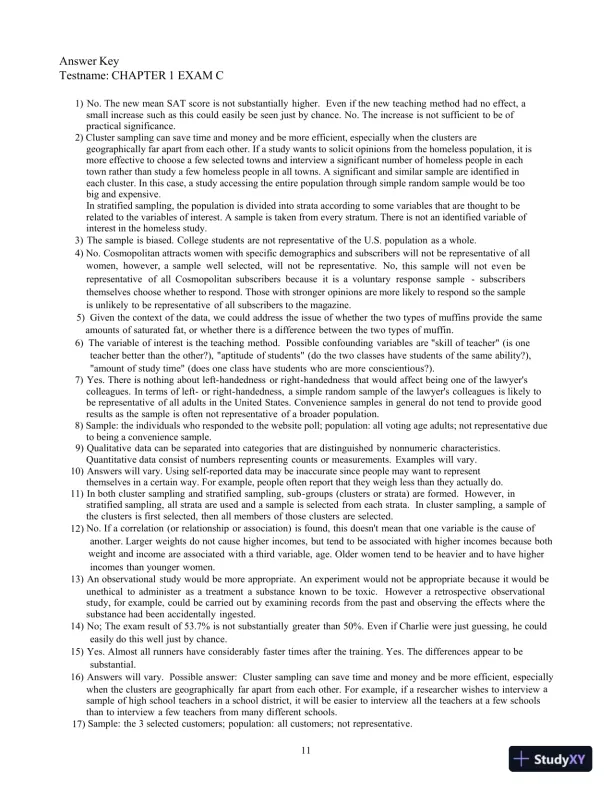
11Answer KeyTestname: CHAPTER 1 EXAM C1) No. The new mean SAT score is not substantially higher. Even if the new teaching method had no effect, asmallincrease such as this could easily be seen just by chance. No. The increase is not sufficient to be ofpractical significance.2) Cluster sampling can save time and money and be more efficient, especially when the clusters aregeographically far apart from each other. If a study wants to solicit opinions from the homeless population, it ismore effective to choose a few selected towns and interview a significant number of homeless people in eachtown rather than study a few homeless people in all towns. A significant and similar sample are identified ineach cluster. In this case, a study accessing the entire population through simple random sample would be toobig and expensive.In stratified sampling, the population is divided into strata according to some variables that are thought to berelated to the variables of interest. A sample is taken from every stratum. There is not an identified variable ofinterest in the homeless study.3) The sample is biased. College students are not representative of the U.S. population as awhole.4)No. Cosmopolitan attracts women with specific demographics and subscribers will not be representative ofallwomen, however, a sample well selected, will not be representative. No,this sample will not even berepresentative of all Cosmopolitan subscribers because it is a voluntary response sample-subscribersthemselves choose whether to respond. Those with stronger opinions are more likely to respond so the sampleisunlikely to be representative of all subscribers to the magazine.5)Given the context of the data, we could address the issue of whether the two types of muffins provide thesameamounts of saturated fat, or whether there is a difference between the two types ofmuffin.6)The variable of interest is the teaching method. Possible confounding variables are "skill of teacher" (is oneteacherbetter than the other?), "aptitude of students" (do the two classes have students of the same ability?),"amount ofstudytime" (does one class have students who are moreconscientious?).7) Yes. There is nothing about left-handedness or right-handedness that would affect being one of thelawyer'scolleagues. In terms of left- or right-handedness, a simple random sample of the lawyer's colleagues is likely toberepresentative of all adults in the United States. Convenience samples in general do not tend to provide goodresultsas the sample is often not representative of a broaderpopulation.8) Sample: the individuals who responded to the website poll; population: all voting age adults; not representative dueto being a convenience sample.9) Qualitative data can be separated into categories that are distinguished by nonnumeric characteristics.Quantitativedata consist of numbers representing counts or measurements. Examples willvary.10) Answers will vary. Using self-reported data may be inaccurate since people may want to representthemselves in a certain way. For example, people often report that they weigh less than they actually do.11) In both cluster sampling and stratified sampling,sub-groups (clusters or strata) are formed. However, instratifiedsampling, all strata are used and a sample is selected from each strata. In cluster sampling, a sample ofthe clustersisfirst selected, then all members of those clusters areselected.12)No. If a correlation (or relationship or association) is found, this doesn't mean that one variable is the cause ofanother.Larger weights do not cause higher incomes, but tend to be associated with higher incomes because bothweightandincome are associated with a third variable, age. Older women tend to be heavier and to have higherincomesthanyoungerwomen.13) An observational study would be more appropriate. An experiment would not be appropriate because it wouldbeunethical to administer as a treatment a substance known to be toxic.However a retrospective observationalstudy,for example, could be carried out by examining records from the past and observing the effects where thesubstancehad been accidentallyingested.14) No; The exam result of 53.7% is not substantially greater than 50%. Even if Charlie were just guessing, he couldeasilydo this well just bychance.15) Yes. Almost all runners have considerably faster times after thetraining.Yes. The differences appear to besubstantial.16) Answers will vary. Possible answer: Cluster sampling can save time and money and be more efficient,especiallywhen the clusters are geographically far apart from each other. For example, if a researcher wishes to interviewasample of high school teachers in a school district, it will be easier to interview all the teachers at a few schoolsthantointerview a few teachers from many differentschools.17) Sample: the 3 selected customers; population: all customers; notrepresentative.

Page 16

Elementary Statistics, 13th Edition Test Bank - Page 16 preview image

Loading page image...

1218) Sex education gives students information about sexual activities including the results of engaging in thoseactivities, such as pregnancy and disease.Promiscuous behavior is more about a lack of information. Thisfallacy explanation is saying that since sex education is being taught in high schools, the teachings increase thepromiscuity of teenagers. This is completely false because yes the teenagers are learning how to have safe andprotective sex, but it’s up to them and how they choose to use that information about sex to alter the cause oftheir promiscuity.19) An experiment would be more appropriate..20) Confounding occurs in an experiment when the effects of two or more variables cannot be distinguished fromeachother. Examples will vary. One example is that of a school district that conducts a study regarding whetherthescience laboratory approach or the computer simulation approach is better for learning chemistry amongseniors.Astandardized achievement test is used to measure learning, and the results of the two schools arecompared.Unlesscontrolled in the study, two confounding variables are teaching expertise and studentmotivation.

Page 17

Elementary Statistics, 13th Edition Test Bank - Page 17 preview image

Loading page image...

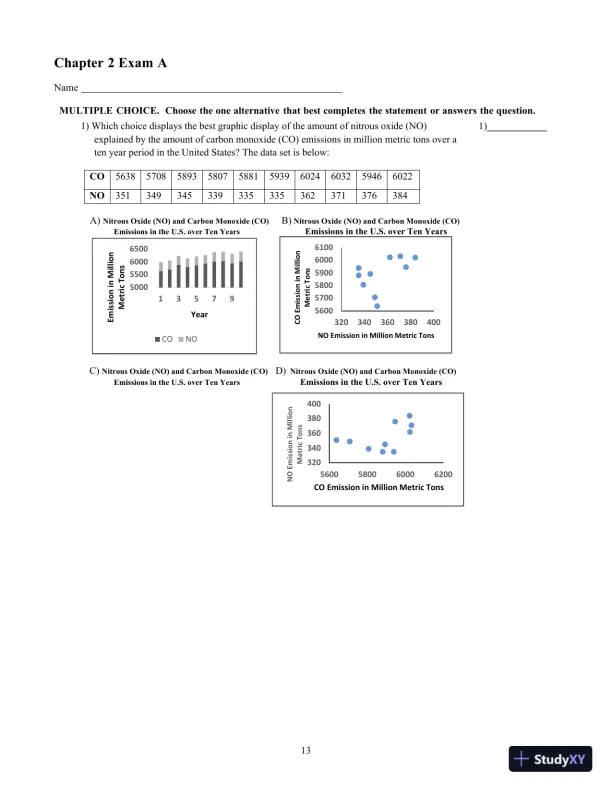
13Chapter 2 ExamANameMULTIPLE CHOICE. Choose the one alternative that best completes the statement or answers thequestion.1) Which choice displays the best graphic display of the amount of nitrous oxide (NO)explained by the amount of carbon monoxide (CO) emissions in million metric tons over aten year period in the United States? The data set is below:CO5638570858935807588159396024603259466022NO351349345339335335362371376384A)Nitrous Oxide (NO) and Carbon Monoxide (CO)B)Nitrous Oxide (NO) and Carbon Monoxide (CO)Emissions in the U.S. over Ten YearsEmissions in the U.S. over Ten YearsC)Nitrous Oxide (NO) and Carbon Monoxide(CO)D)Nitrous Oxide (NO) and Carbon Monoxide (CO)Emissions in the U.S. over Ten YearsEmissions in the U.S. over Ten Years1)____________500055006000650013579Emission in MillionMetric TonsYearCONO560057005800590060006100320340360380400CO Emission in MillionMetric TonsNO Emission in Million Metric Tons3203403603804005600580060006200NO Emission in MillionMetric TonsCO Emission in Million Metric Tons

Page 18

Elementary Statistics, 13th Edition Test Bank - Page 18 preview image

Loading page image...

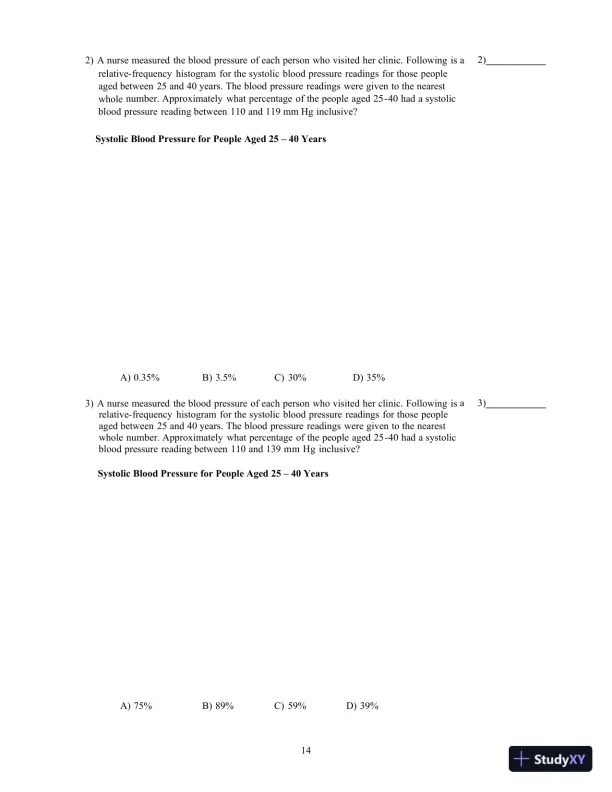
142) A nurse measured the blood pressure of each person who visited her clinic. Following isarelative-frequency histogram for the systolic blood pressure readings for those peopleagedbetween 25 and 40 years. The blood pressure readings were given to the nearestwholenumber.Approximately what percentage of the people aged25-40 had a systolicblood pressurereadingbetween 110 and 119 mm Hginclusive?Systolic Blood Pressure for People Aged 25 – 40 YearsA) 0.35%B) 3.5%C) 30%D)35%2)____________3) A nurse measured the blood pressure of each person who visited her clinic. Following isarelative-frequency histogram for the systolic blood pressure readings for those peopleagedbetween 25 and 40 years. The blood pressure readings were given to the nearestwholenumber.Approximately what percentage of the people aged25-40 had a systolicblood pressurereadingbetween 110 and 139 mm Hginclusive?Systolic Blood Pressure for People Aged 25 – 40 YearsA) 75%B) 89%C) 59%D)39%3)____________

Page 19

Elementary Statistics, 13th Edition Test Bank - Page 19 preview image

Loading page image...

154) The Kappa Iota Sigma Fraternity polled its members on the weekend party theme. Thevote wasasfollows: six for toga, four for hayride, eight for luau, and two for masquerade.Displaythevote count in a Paretochart.4)____________

Page 20

Elementary Statistics, 13th Edition Test Bank - Page 20 preview image

Loading page image...

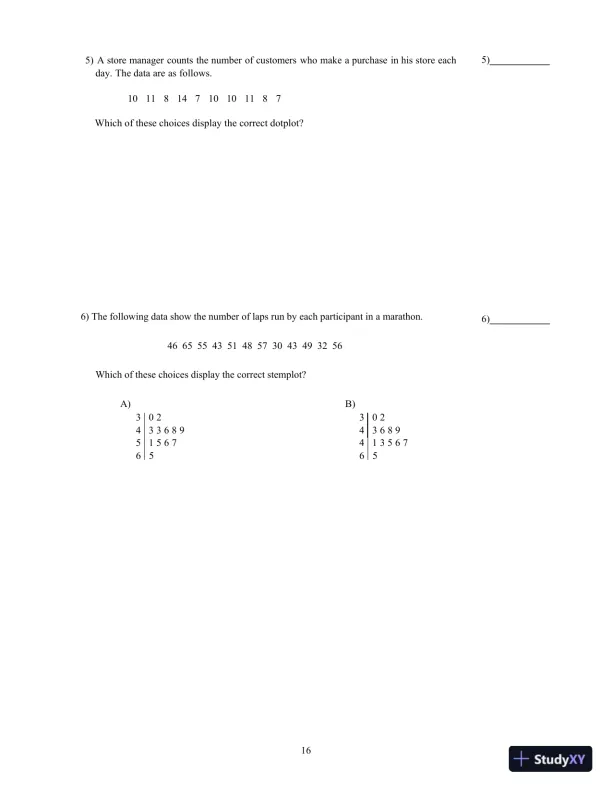
165) A store manager counts the number of customers who make a purchase in his store eachday.Thedata are asfollows.1011814710101187Which of these choices display the correct dotplot?5)____________6) The following data show the number of laps run by each participant in a marathon.46 65 55 43 51 48 57 30 43 49 32 56Which of these choices display the correct stemplot?A)B)30230243 3 6 8943 6 8951 5 6741 3 5 6765656)____________

Page 21

Elementary Statistics, 13th Edition Test Bank - Page 21 preview image

Loading page image...

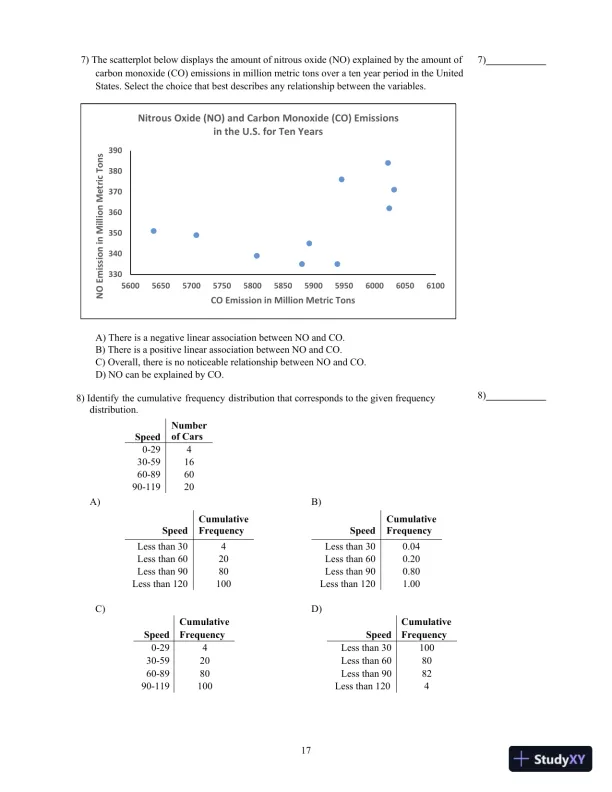
177) The scatterplot below displays the amount of nitrous oxide (NO) explained by the amount ofcarbon monoxide (CO) emissions in million metric tons over a ten year period in the UnitedStates. Select the choice that best describes any relationship between the variables.A) There is a negative linear association between NO and CO.B) There is a positive linear association between NO and CO.C) Overall, there is no noticeable relationship between NO and CO.D) NO can be explained by CO.7)____________8) Identify the cumulative frequency distribution that corresponds to the given frequencydistribution.SpeedNumberof Cars0-29430-591660-896090-11920A)B)SpeedCumulativeFrequencySpeedCumulativeFrequencyLess than 304Less than 300.04Less than 6020Less than 600.20Less than 9080Less than 900.80Less than 120100Less than 1201.008)____________C)D)SpeedCumulativeFrequencySpeedCumulativeFrequency0-294Less than 3010030-5920Less than 608060-8980Less than 908290-119100Less than 120433034035036037038039056005650570057505800585059005950600060506100NO Emission in Million Metric TonsCO Emission in Million Metric TonsNitrous Oxide (NO) and Carbon Monoxide (CO) Emissionsin the U.S. for Ten Years

Page 22

Elementary Statistics, 13th Edition Test Bank - Page 22 preview image

Loading page image...

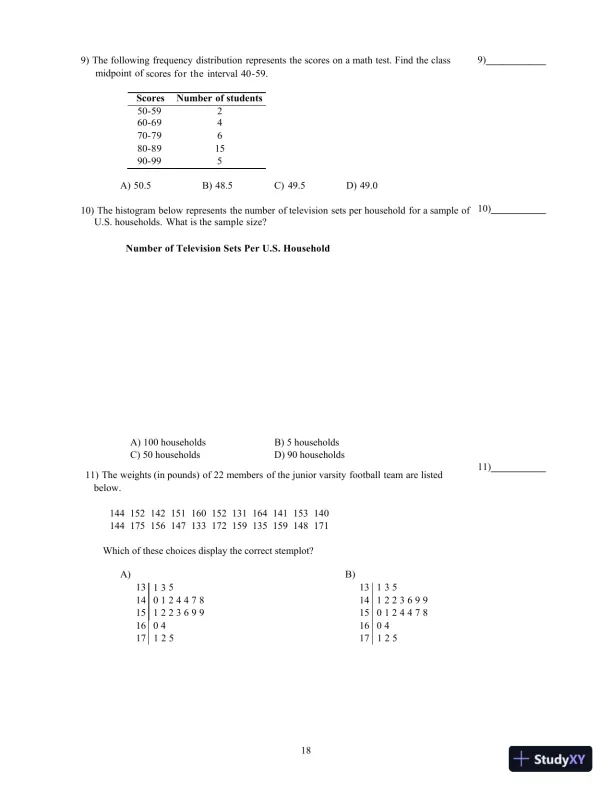
189) The following frequency distribution represents the scores on a math test. Find the classmidpointofscores for the interval40-59.ScoresNumber ofstudents50-59260-69470-79680-891590-995A) 50.5B) 48.5C) 49.5D)49.09)____________10) The histogram below represents the number of television sets per household for a sample ofU.S.households. What is the sample size?Number of Television Sets Per U.S. HouseholdA) 100 householdsB) 5 householdsC) 50 householdsD) 90 households10)___________11) The weights (in pounds) of 22 members of the junior varsity football team are listedbelow.144 152 142 151 160 152 131 164 141 153140144 175 156 147 133 172 159 135 159 148171Which of these choices display the correct stemplot?A)B)131 35131 35140 1 2 4 4 78141 2 2 3 6 99151 2 2 3 6 99150 1 2 4 4 7816041604171 25171 2511)___________

Page 23

Elementary Statistics, 13th Edition Test Bank - Page 23 preview image

Loading page image...

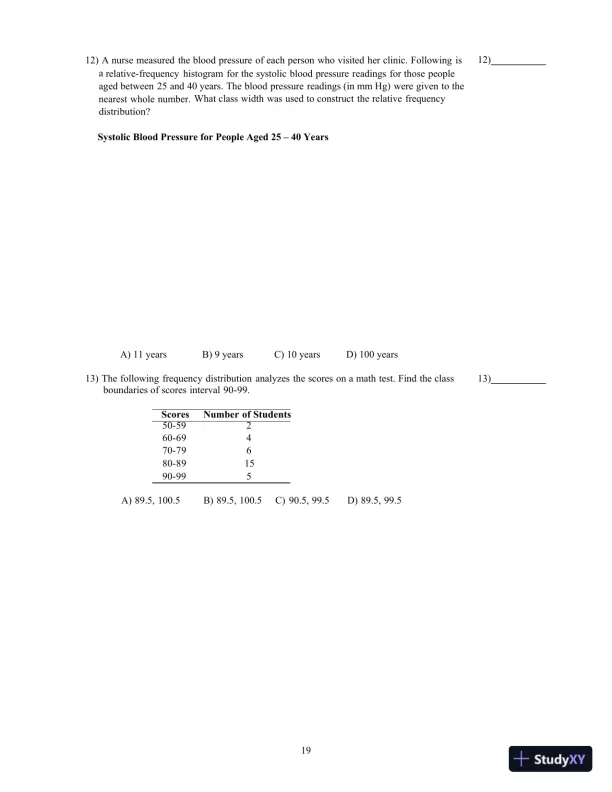
1912) A nurse measured the blood pressure of each person who visited her clinic. Following isarelative-frequency histogram for the systolic blood pressure readings for those peopleagedbetween 25 and 40 years. The blood pressure readings (in mm Hg) were given to thenearest whole number.Whatclass width was used to construct the relative frequencydistribution?Systolic Blood Pressure for People Aged 25 – 40 YearsA) 11 yearsB) 9 yearsC) 10 yearsD) 100 years12)___________13) The following frequency distribution analyzes the scores on a math test. Find the classboundariesof scores interval90-99.ScoresNumber ofStudents50-59260-69470-79680-891590-995A) 89.5, 100.5B) 89.5, 100.5C) 90.5, 99.5D) 89.5,99.513)___________

Page 24

Elementary Statistics, 13th Edition Test Bank - Page 24 preview image

Loading page image...

2014)x0.51 0.020.14 0.290.340.8 0.470.71y0.31 0.46 –0.12 0.34 –0.050.8 0.350.47Which of these choices display the correct scatterplot?14)___________

Page 25

Elementary Statistics, 13th Edition Test Bank - Page 25 preview image

Loading page image...

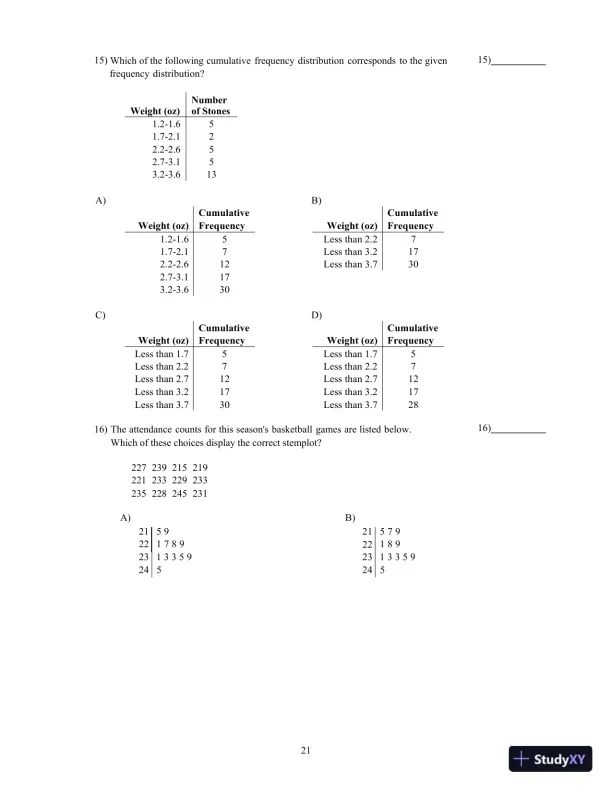
2115) Which of the following cumulative frequency distribution corresponds to the givenfrequencydistribution?Weight (oz)Numberof Stones1.2-1.651.7-2.122.2-2.62.7-3.13.2-3.65513A)B)Weight (oz)CumulativeFrequencyWeight (oz)CumulativeFrequency1.2-1.65Less than 2.271.7-2.17Less than 3.2172.2-2.612Less than 3.7302.7-3.1173.2-3.630C)D)Weight (oz)CumulativeFrequencyWeight (oz)CumulativeFrequencyLess than 1.75Less than 1.75Less than 2.27Less than 2.27Less than 2.712Less than 2.712Less than 3.217Less than 3.217Less than 3.730Less than 3.72815)___________16) The attendance counts for this season's basketball games are listedbelow.Which of these choices display the correct stemplot?227 239 215219221 233 229233235 228 245231A)B)2159215 79221 7 89221 89231 3 3 59231 3 3 5924524516)___________

Page 26

Elementary Statistics, 13th Edition Test Bank - Page 26 preview image

Loading page image...

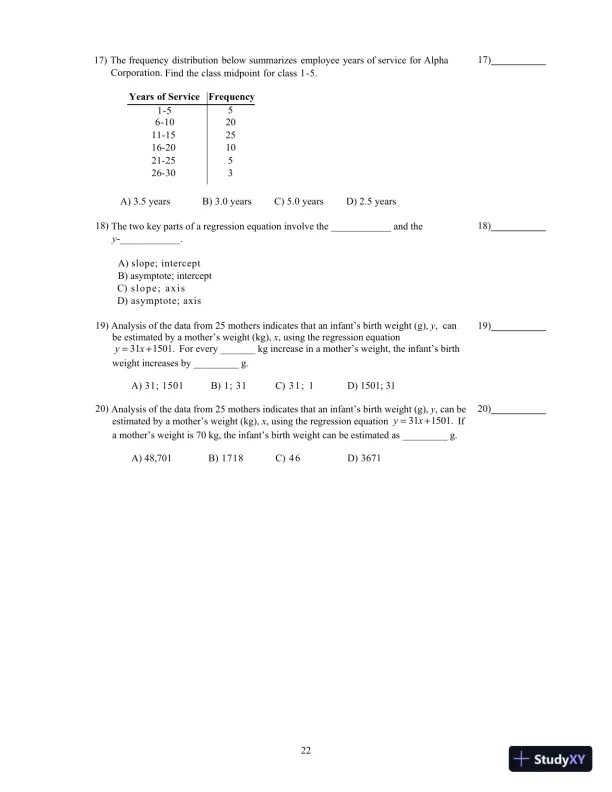
2217) The frequency distribution below summarizes employee years of service for AlphaCorporation.Find the class midpoint for class1-5.Years ofServiceFrequency1-556-102011-152516-201021-25526-303A) 3.5 yearsB) 3.0 yearsC) 5.0 yearsD) 2.5 years17)___________18) The two key parts of a regression equation involve the ____________ and they-____________.A) slope; interceptB) asymptote; interceptC) s l o p e ; a x i sD) asymptote; axis18)___________19) Analysis of the data from 25 mothers indicates that an infant’s birth weight (g),y, canbe estimated by a mother’s weight (kg),x, using the regression equation311501.yx=+For every _______ kg increase in a mother’s weight, the infant’s birthweight increases by _________ g.A) 31; 1501B) 1; 31C) 3 1 ; 1D) 1501; 3119)___________20) Analysis of the data from 25 mothers indicates that an infant’s birth weight (g),y, can beestimated by a mother’s weight (kg),x, using the regression equation311501.yx=+Ifa mother’s weight is 70 kg, the infant’s birth weight can be estimated as _________ g.A) 48,701B) 1718C) 4 6D)367120)___________

Page 27

Elementary Statistics, 13th Edition Test Bank - Page 27 preview image

Loading page image...

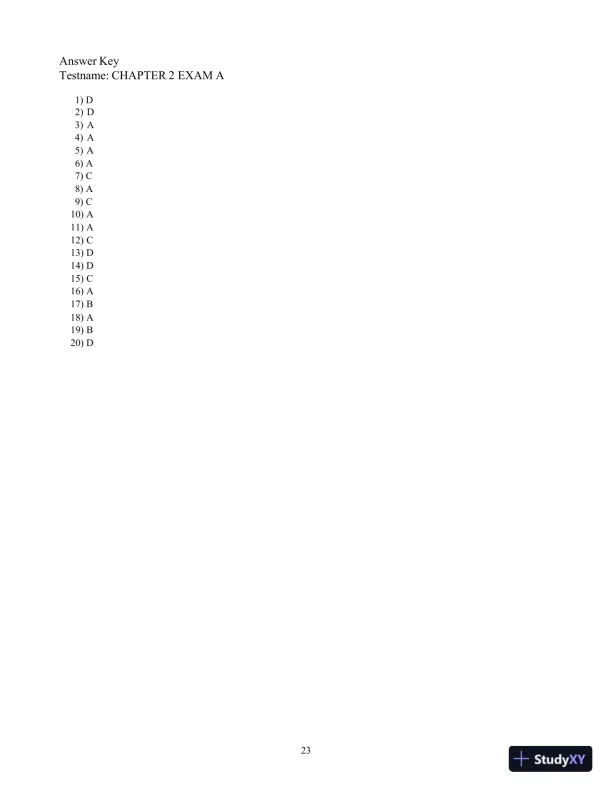
23Answer KeyTestname: CHAPTER 2 EXAM A1) D2)D3)A4)A5)A6) A7) C8) A9) C10) A11) A12) C13) D14) D15) C16) A17) B18) A19) B20) D

Page 28

Elementary Statistics, 13th Edition Test Bank - Page 28 preview image

Loading page image...

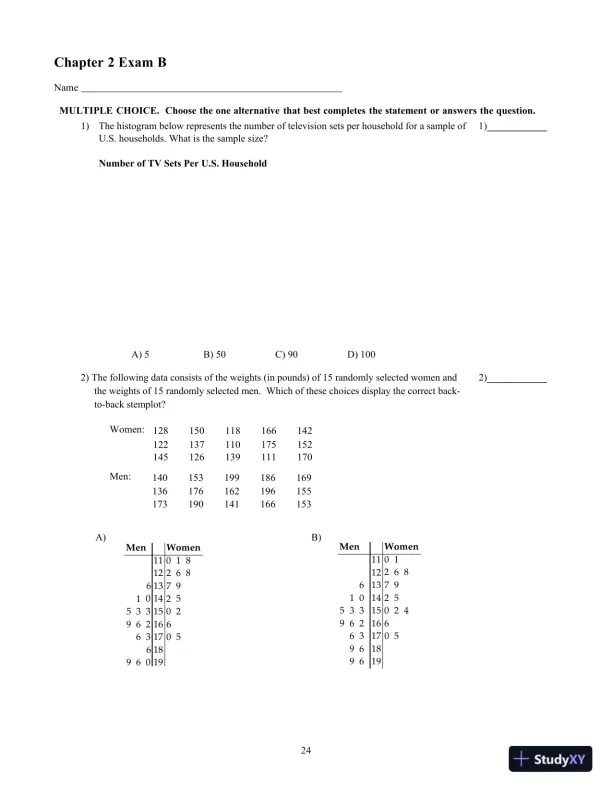
24Chapter 2 ExamBNameMULTIPLE CHOICE. Choose the one alternative that best completes the statement or answers thequestion.1)The histogram below represents the number of television sets per household for a sample ofU.S. households. What is the sample size?Number of TV Sets Per U.S. HouseholdA) 5B) 50C) 90D) 1001)____________2) The following data consists of the weights (in pounds) of 15 randomly selected women andthe weights of 15 randomly selected men. Which of these choices display the correct back-to-back stemplot?Women:128150118166142122137110175152145126139111170Men:140153199186169136176162196155173190141166153A)B)2)____________MenWomen6105 339 626369 601112131415161718190 182 68792502605MenWomen6105 339 62639696111213141516171819012 6879250 24605

Page 29

Elementary Statistics, 13th Edition Test Bank - Page 29 preview image

Loading page image...

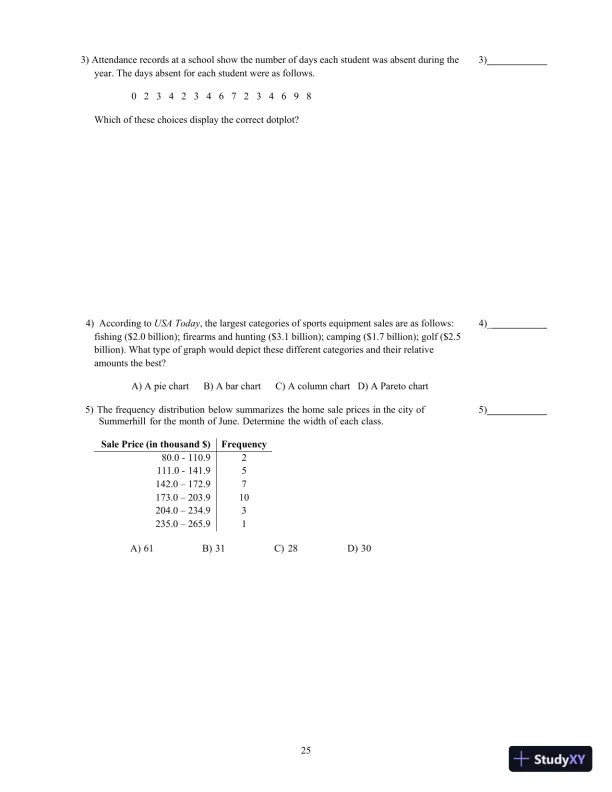
253) Attendance records at a school show the number of days each student was absent during theyear. The days absent for each student were as follows.023423467234698Which of these choices display the correct dotplot?3)____________4) According toUSA Today, the largest categories of sports equipment sales are as follows:fishing ($2.0 billion); firearms and hunting ($3.1 billion); camping ($1.7 billion); golf ($2.5billion). What type of graph would depict these different categories and their relativeamounts the best?A) A pie chartB) A bar chartC) A column chartD) A Pareto chart4)____________5) The frequency distribution below summarizes the home sale prices in the city ofSummerhillforthe month of June. Determine the width of eachclass.Sale Price (in thousand $)Frequency80.0 - 110.92111.0 - 141.95142.0 – 172.97173.0 – 203.910204.0 – 234.93235.0 – 265.91A) 61B) 31C) 28D)305)____________

Page 30

Elementary Statistics, 13th Edition Test Bank - Page 30 preview image

Loading page image...

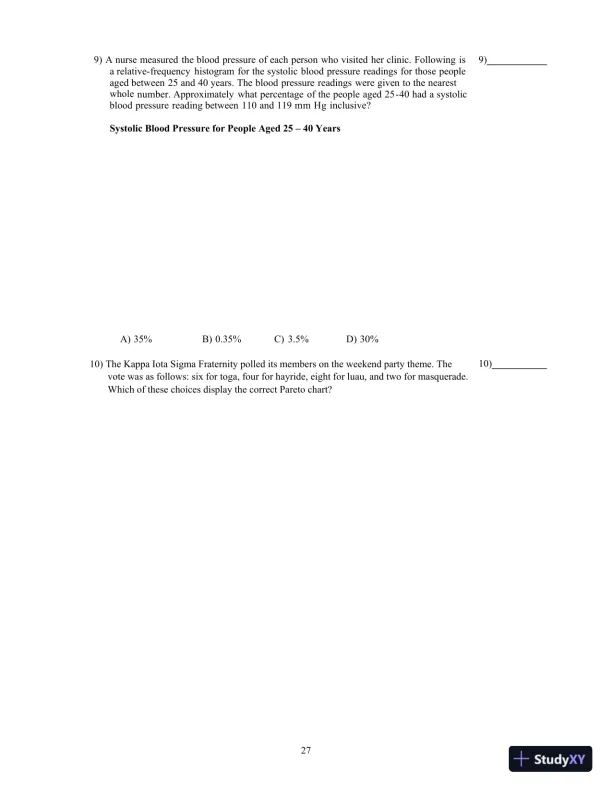
266) A nurse measured the blood pressure of each person who visited her clinic. Following isarelative-frequency histogram for the systolic blood pressure readings for those peopleagedbetween 25 and 40 years. The blood pressure readings were given to the nearestwholenumber.Approximately what percentage of the people aged25-40 had a systolicblood pressurereadingbetween 110 and 139 mm Hginclusive?Systolic Blood Pressure for People Aged 25 – 40 YearsA) 59%B) 39%C) 89%D)75%6)____________7) The following frequency distribution d ep ic ts the scores on a math test. Find the classmidpointofscores for the interval95-99.ScoresNumber ofStudents75-79280-84485-89690-941595-995A) 97.5B) 97.0C) 96.5D)98.07)____________8) The ages of the 45 members of a track and field team are listed below. Which of thesechoices display the correct stemplot?21 18 42 35 32 21 44 25 38 48 14 19 23 222832 34 27 31 17 16 41 37 22 24 33 32 21 263022 27 32 30 20 18 17 21 15 26 36 31 40 1625A)B)1414515 6 6 7 7 8 8915 6 6 7 7 8 8920 1 1 1 1 2 2 2 3420 1 1 1 1 2 2 2 3 4 525 5 6 6 7 7825 5 6 6 7 7830 0 1 1 2 2 2 2 3430 0 1 1 2 2 2 2 3 4535 6 7835 6 7840 1 2440 1 2448488)____________

Page 31

Elementary Statistics, 13th Edition Test Bank - Page 31 preview image

Loading page image...

279) A nurse measured the blood pressure of each person who visited her clinic. Following isarelative-frequency histogram for the systolic blood pressure readings for those peopleagedbetween 25 and 40 years. The blood pressure readings were given to the nearestwholenumber.Approximately what percentage of the people aged25-40 had a systolicblood pressurereadingbetween 110 and 119 mm Hginclusive?Systolic Blood Pressure for People Aged 25 – 40 YearsA) 35%B) 0.35%C) 3.5%D)30%9)____________10) The Kappa Iota Sigma Fraternity polled its members on the weekend party theme. Thevote was as follows: six for toga, four for hayride, eight for luau, and two for masquerade.Which of these choices display the correct Pareto chart?10)___________
Preview Mode

This document has 239 pages. Sign in to access the full document!

Study Now!

XY-Copilot AI
Unlimited Access
Secure Payment
Instant Access
24/7 Support
Document Chat

Related Documents

View all