Macroeconomics , 5th Edition Solution Manual

Macroeconomics , 5th Edition Solution Manual provides key summaries, making it easier to absorb textbook material.

Benjamin Fisher
Contributor
4.2
59
5 months ago
Preview (16 of 128 Pages)
100%
Purchase to unlock

Page 1

Macroeconomics , 5th Edition Solution Manual - Page 1 preview image

Loading page image...

Chapter 1IntroductionTeaching GoalsMacroeconomics primarily studies economic growth and business cycles. Over time, there is a prevailingupward trend in the standard of living. However, such growth can be rather erratic. There are someperiodsof very rapid growth, some periods of rather anemic growth, and also some periods of temporaryeconomic decline. Explanations for the overall upward trend in standards of living are the subject ofeconomic growth analysis. Explanations of variations in growth over shorter time horizons are the subjectof business cycle analysis. Students should be able to distinguish between microeconomic topics andmacroeconomic topics. Students should understand the distinction between growth analysis and businesscycle analysis.Although microeconomics and macroeconomics are separate branches of study, both branches areguided by the same set of economic principles. Standard economic theory is guided by the assumption ofmaximizing behavior. As a first approximation, we therefore view the macroeconomy as a collection ofmarkets with maximizing participants. These participants are price-taking agents and the economy isclosely approximated by a competitive equilibrium.Because the economy as a whole is extremely complex, macroeconomists must rely on somewhat abstractmodels. Although the structure of such models does not correspond to all of the details of life in a complexsociety, these models offer the best hope of providing simple, yet accurate descriptions of how themacroeconomy works, and how government policies may affect macroeconomic outcomes.Economists are in broad consensus about the mechanisms of economic growth. There is less agreementabout the causes and consequences of business cycles. While there are strong regularities inmacroeconomic data, competing theories have been developed that each have a claim to explaining thoseregularities. There are Keynesian and non-Keynesian models of the business cycle. Examples of theformer are Keynesian coordination failure models and New Keynesian sticky price models. Examples ofthe latter are the Lucas-Friedman money surprise model, the real business cycle model, and newmonetarist models.Classroom Discussion TopicsOne good way to get the ball rolling is to list some macroeconomic concerns like stagnant economicgrowth, unemployment, inflation, the recent recession, government budget deficits, tax burdens, balanceof trade deficits, financing of Social Security, and the like. Draw on current news or look at various policyproposals discussed in Washington. Ask or poll students as to whether they are personally concernedabout such problems and what original prejudices they might have about causes and effects. Sometimesstudents express concerns about topics that are perhaps more microeconomic in nature, like inequality inthe distribution of income and environmental concerns. Emphasize that economic growth may provideenough extra resources to help deal with these issues.

Page 2

Macroeconomics , 5th Edition Solution Manual - Page 2 preview image

Loading page image...

Page 3

Macroeconomics , 5th Edition Solution Manual - Page 3 preview image

Loading page image...

Chapter 1Introduction2Students often have conflicting ideas about the current state of the economy. Sometimes their perspectivesmay be governed by their individual circumstances, what they read in the paper, what they see on TV andthe like. Ask them whether they believe that times are currently good or bad. Ask them why they think theway that they do. Ask them how they can more objectively back up or check out their casual impressionsabout the current state of the economy.OutlineI.What Is Macroeconomics?II.Gross National Product, Economic Growth, and Business CyclesIII.Macroeconomic ModelsIV.Microeconomic PrinciplesV.Disagreement in MacroeconomicsVI.What Do We Learn from Macroeconomic Analysis?A.Fundamentals: Preferences and Productive CapacityB.The Efficiency of MarketOutcomesC.The Implications of UnemploymentD.The Source of Long-run Improvements in the Standard of LivingE.A Tax Cut is not a Free LunchF.Credit MarketsG.Expectations about the FutureH.The Role of MoneyI.Business CyclesJ.International Trade in Goods and AssetsK.Money Growth and InflationL.The Phillips CurveVII.Understanding Current and Recent Macroeconomic EventsA.Aggregate ProductivityB.Unemployment and VacanciesC.Taxes, Government Spending, and theGovernment DeficitD.InflationE.Interest RatesF.Business Cycles in the United StatesG.Credit Markets and the Financial CrisisH.The Current Account SurplusSolutions to End-of-Chapter Problems1.Calculating percentage growth rates, and log approximations to percentage growth rates, weobtain:YearPercentage Growth RateLog Approximation20031.5974841.584858

Page 4

Macroeconomics , 5th Edition Solution Manual - Page 4 preview image

Loading page image...

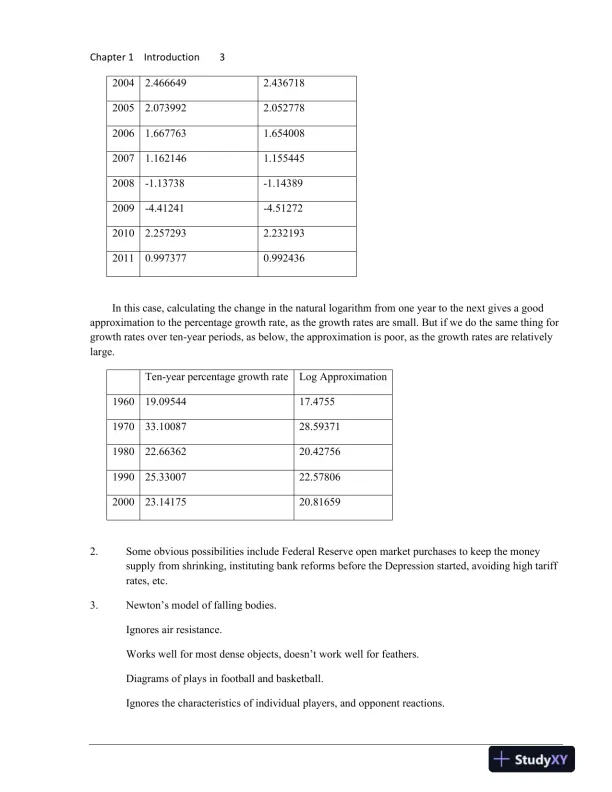
Chapter 1Introduction320042.4666492.43671820052.0739922.05277820061.6677631.65400820071.1621461.1554452008-1.13738-1.143892009-4.41241-4.5127220102.2572932.23219320110.9973770.992436In this case, calculating the change in the natural logarithm from one year to the next gives a goodapproximation to the percentage growth rate, as the growth rates are small. But if we do the same thing forgrowth rates over ten-year periods, as below, the approximation is poor, as the growth rates are relativelylarge.Ten-year percentage growth rateLog Approximation196019.0954417.4755197033.1008728.59371198022.6636220.42756199025.3300722.57806200023.1417520.816592.Some obvious possibilities include Federal Reserve open market purchases to keep the moneysupply from shrinking, instituting bank reforms before the Depression started, avoiding high tariffrates, etc.3.Newton’s model of falling bodies.Ignores air resistance.Works well for most dense objects, doesn’t work well for feathers.Diagrams of plays in football and basketball.Ignores the characteristics of individual players, and opponent reactions.

Page 5

Macroeconomics , 5th Edition Solution Manual - Page 5 preview image

Loading page image...

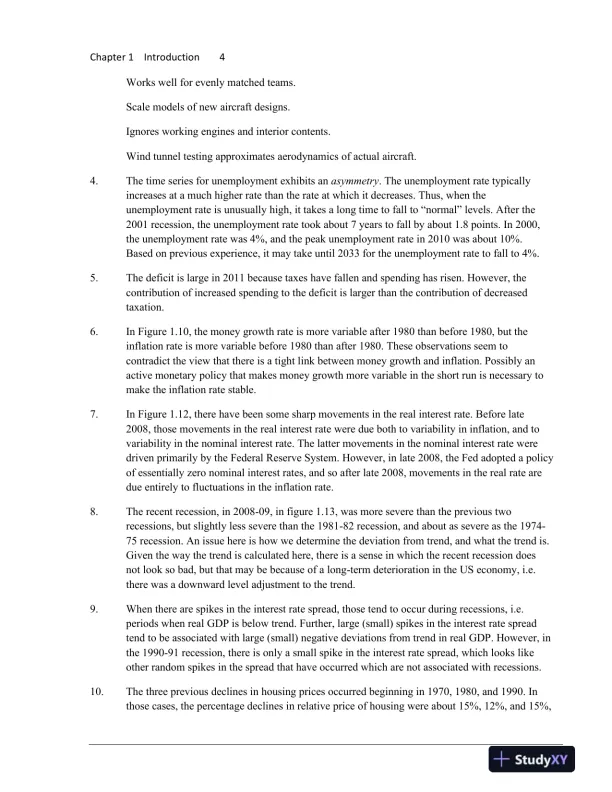
Chapter 1Introduction4Works well for evenly matched teams.Scalemodels of new aircraft designs.Ignores working engines and interior contents.Wind tunnel testing approximates aerodynamics of actual aircraft.4.The time series for unemployment exhibits anasymmetry. The unemployment rate typicallyincreases at a much higher rate than the rate at which it decreases. Thus, when theunemployment rate is unusually high, it takes a long time to fall to “normal” levels. After the2001 recession, the unemployment rate took about 7 years to fall by about 1.8 points. In 2000,the unemployment rate was 4%, and the peak unemployment rate in 2010 was about 10%.Based on previous experience, it may take until 2033 for the unemployment rate to fall to 4%.5.The deficit is large in 2011 because taxes have fallen and spending has risen. However, thecontribution of increased spending to the deficit is larger than the contribution of decreasedtaxation.6.In Figure 1.10, the money growth rate is more variable after 1980 than before 1980, but theinflation rate is more variable before 1980 than after 1980. These observations seem tocontradict the view that there is a tight link between money growth and inflation. Possibly anactive monetary policy that makes money growth more variable in the short run is necessary tomake the inflation rate stable.7.In Figure 1.12, there have been some sharp movements in the real interest rate. Before late2008, those movements in the real interest rate were due both to variability in inflation, and tovariability in the nominal interest rate. The latter movements in the nominal interest rate weredriven primarily by the Federal Reserve System. However, in late 2008, the Fed adopted a policyof essentially zero nominal interest rates, and so after late 2008, movements in the real rate aredue entirely to fluctuations in the inflation rate.8.The recent recession, in 2008-09, in figure 1.13, was more severe than the previous tworecessions, but slightly less severe than the 1981-82 recession, and about as severe as the 1974-75 recession. An issue here is how we determine the deviation from trend, and what the trend is.Given the way the trend is calculated here, there is a sense in which the recent recession doesnot look so bad, but that may be because of a long-term deterioration in the US economy, i.e.there was a downward level adjustment to the trend.9.When there are spikes in the interest rate spread, those tend to occur during recessions, i.e.periods when real GDP is below trend. Further, large (small) spikes in the interest rate spreadtend to be associated with large (small) negative deviations from trend in real GDP. However, inthe 1990-91 recession, there is only a small spike in the interest rate spread, which looks likeother random spikes in the spread that have occurred which are not associated with recessions.10.The three previous declines in housing prices occurred beginning in 1970, 1980, and 1990. Inthose cases, the percentage declines in relative price of housing were about 15%, 12%, and 15%,

Page 6

Macroeconomics , 5th Edition Solution Manual - Page 6 preview image

Loading page image...

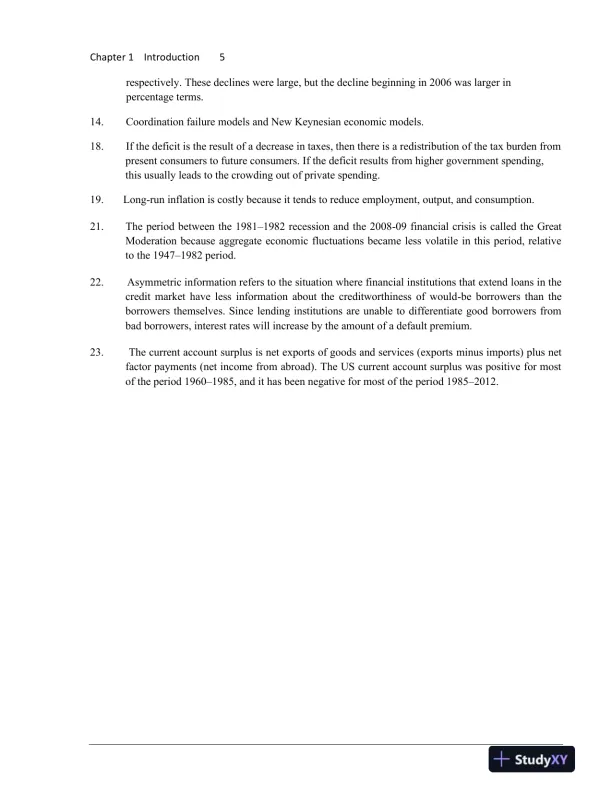
Chapter 1Introduction5respectively. These declines were large, but the decline beginning in 2006 was larger inpercentage terms.14.Coordination failure models and New Keynesian economic models.18.If the deficit is the result of a decrease in taxes, then there is a redistribution of the tax burden frompresent consumers to future consumers. If the deficit results from higher government spending,this usually leads to the crowding out of private spending.19.Long-run inflation is costly because it tends to reduce employment, output, and consumption.21.The period between the 19811982 recession and the 2008-09 financial crisis is called the GreatModeration because aggregate economic fluctuations became less volatile in this period, relativeto the 19471982 period.22.Asymmetric information refers to the situation where financial institutions that extend loans in thecredit market have less information about the creditworthiness of would-be borrowers than theborrowers themselves. Since lending institutions are unable to differentiate good borrowers frombad borrowers, interest rates will increase by the amount of a default premium.23.The current account surplus is net exports of goods and services (exportsminus imports) plus netfactor payments (net income from abroad). The US current account surplus was positive for mostof the period 19601985, and it has been negative for most of the period 19852012.

Page 7

Macroeconomics , 5th Edition Solution Manual - Page 7 preview image

Loading page image...

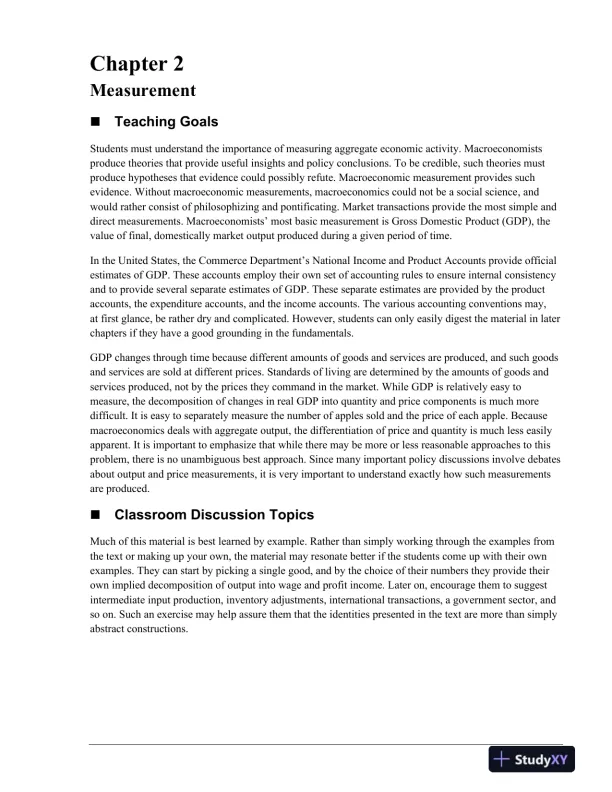
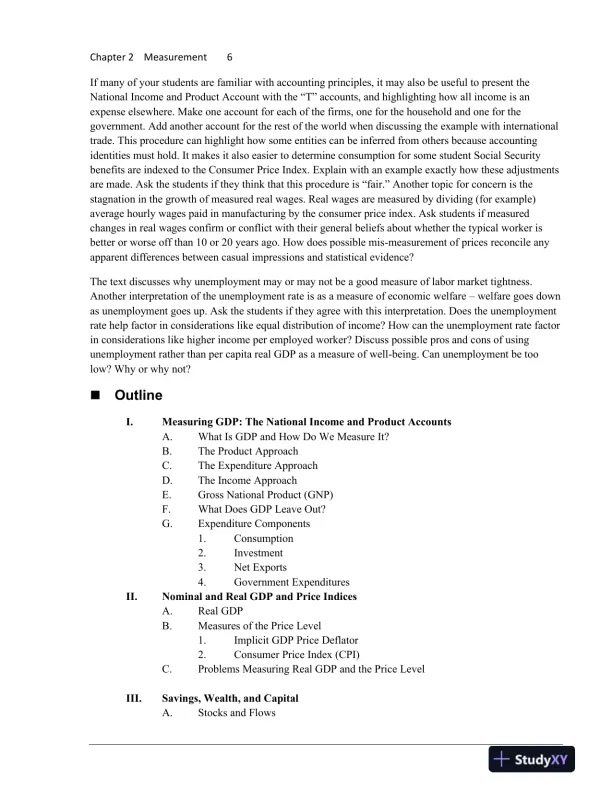
Chapter 2MeasurementTeaching GoalsStudents must understand the importance of measuring aggregate economic activity. Macroeconomistsproduce theories that provide useful insights and policy conclusions. To be credible, such theories mustproduce hypotheses that evidence could possibly refute. Macroeconomic measurement provides suchevidence. Without macroeconomic measurements, macroeconomics could not be a social science,andwould rather consist of philosophizing and pontificating. Market transactions provide the most simple anddirect measurements. Macroeconomists’ most basic measurement is Gross Domestic Product (GDP), thevalue of final, domestically market output produced during a given period of time.In the United States, the Commerce Department’s National Income and Product Accounts provide officialestimates of GDP. These accounts employ their own set of accounting rules to ensure internal consistencyand to provide several separate estimates of GDP. These separate estimates are provided by the productaccounts, the expenditure accounts, and the income accounts. The various accounting conventions may,at first glance, be rather dry and complicated. However, students can only easily digest the material in laterchapters if they have a good grounding in the fundamentals.GDP changes through time because different amounts of goods and services are produced, and such goodsand services are sold at different prices. Standards of living are determined by the amounts of goods andservices produced, not by the prices they command in the market. While GDP is relatively easy tomeasure, the decomposition of changes in real GDP into quantity and price components is much moredifficult. It is easy to separately measure the number of apples sold and the price of each apple. Becausemacroeconomics deals with aggregate output, the differentiation of price and quantity is much less easilyapparent. It is important to emphasize that while there may be more or less reasonable approaches to thisproblem, there is no unambiguous best approach. Since many important policy discussions involve debatesabout output and price measurements, it is very important to understand exactly how such measurementsare produced.Classroom Discussion TopicsMuch of this material is best learned by example. Rather than simply working through the examples fromthe text or making up your own, the material may resonate better if the students come up with their ownexamples. They can start by picking a single good, and by the choice of their numbers they provide theirown implied decomposition of output into wage and profit income. Later on, encourage them to suggestintermediate input production, inventory adjustments, international transactions, a government sector, andso on. Such an exercise may help assure them that the identities presented in the text are more than simplyabstract constructions.

Page 8

Macroeconomics , 5th Edition Solution Manual - Page 8 preview image

Loading page image...

Chapter 2Measurement6If many of your students are familiar with accounting principles, it may also be useful to present theNational Income and Product Account with the “T” accounts, and highlighting how all income is anexpense elsewhere. Make one account for each of the firms, one for the household and one for thegovernment. Add another account for the rest of the world when discussing the example with internationaltrade. This procedure can highlight how some entities can be inferred from others because accountingidentities must hold. It makes it also easier to determine consumption for some student Social Securitybenefits are indexed to the Consumer Price Index. Explain with an example exactly how these adjustmentsare made. Ask the students if they think that this procedure is “fair.” Another topic for concern is thestagnation in the growth of measured real wages. Real wages are measured by dividing (for example)average hourly wages paid in manufacturing by the consumer price index. Ask students if measuredchanges in real wages confirm or conflict with their general beliefs about whether the typical worker isbetter or worse off than 10 or 20 years ago. How does possible mis-measurement of prices reconcile anyapparent differences between casual impressions and statistical evidence?The text discusses why unemployment may or may not be a good measure of labor market tightness.Another interpretation of the unemployment rate is as a measure of economic welfarewelfare goes downas unemployment goes up. Ask the students if they agree with this interpretation. Does the unemploymentrate help factor in considerations like equal distribution of income? How can the unemployment rate factorin considerations like higher income per employed worker? Discuss possible pros and cons of usingunemployment rather than per capita real GDP as a measure of well-being. Can unemployment be toolow? Why or why not?OutlineI.Measuring GDP: The National Income and Product AccountsA.What Is GDP and How Do We Measure It?B.The Product ApproachC.The Expenditure ApproachD.The Income ApproachE.Gross National Product (GNP)F.What Does GDPLeave Out?G.Expenditure Components1.Consumption2.Investment3.Net Exports4.Government ExpendituresII.Nominal and Real GDP and Price IndicesA.Real GDPB.Measures of the Price Level1.Implicit GDP Price Deflator2.Consumer Price Index (CPI)C.Problems Measuring Real GDP and the Price LevelIII.Savings, Wealth, and CapitalA.Stocks and Flows

Page 9

Macroeconomics , 5th Edition Solution Manual - Page 9 preview image

Loading page image...

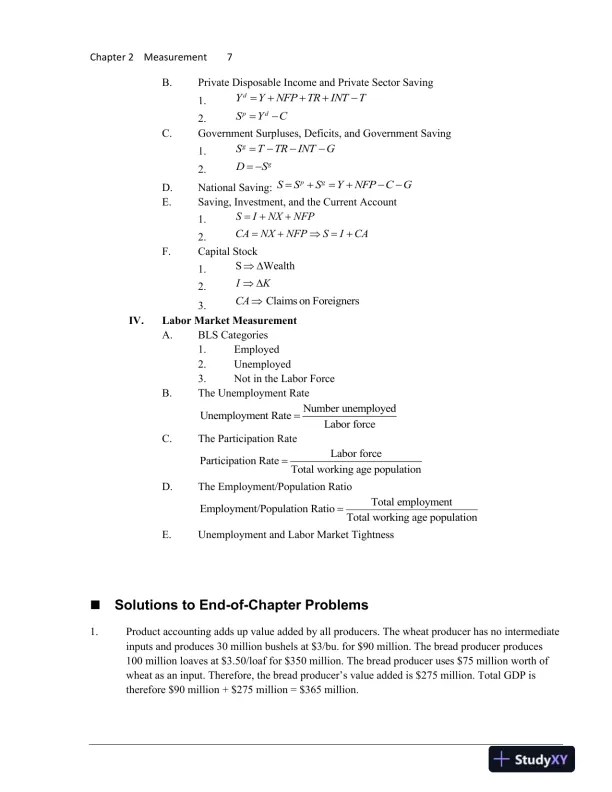
Chapter 2Measurement7B.Private Disposable Income and Private Sector Saving1.dYYNFPTRINTT=+++2.pdSYC=C.Government Surpluses, Deficits, and Government Saving1.gSTTRINTG=2.gDS= −D.National Saving:pgSSSYNFPCG=+=+E.Saving, Investment, and the Current Account1.SINXNFP=++2.CANXNFPSICA=+=+F.Capital Stock1.SWealth 2.IK 3.Claims on ForeignersCAIV.Labor Market MeasurementA.BLS Categories1.Employed2.Unemployed3.Not in the Labor ForceB.The Unemployment RateNumber unemployedUnemployment RateLabor force=C.The Participation RateLabor forceParticipation RateTotal working age population=D.The Employment/Population RatioTotal employmentEmployment/Population RatioTotal working age population=E.Unemployment and LaborMarket TightnessSolutions to End-of-Chapter Problems1.Product accounting adds up value added by all producers. The wheat producer has no intermediateinputs and produces 30 million bushels at $3/bu. for $90 million. The bread producerproduces100 million loaves at $3.50/loaf for $350 million. The bread producer uses $75 million worth ofwheat as an input. Therefore, the bread producer’s value added is $275 million. Total GDP istherefore $90 million+$275 million=$365 million.

Page 10

Macroeconomics , 5th Edition Solution Manual - Page 10 preview image

Loading page image...

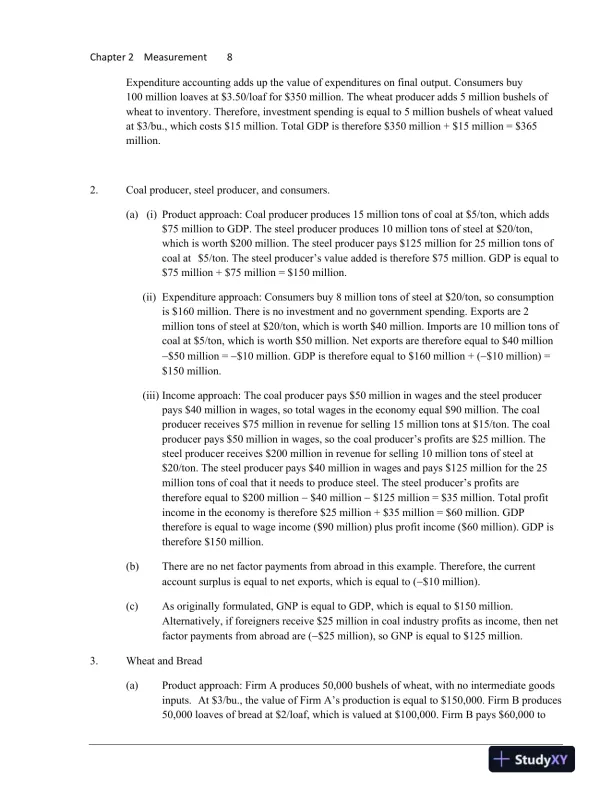
Chapter 2Measurement8Expenditure accounting adds up the value of expenditures on final output. Consumers buy100 million loaves at $3.50/loaf for $350 million. The wheat producer adds 5 million bushels ofwheat to inventory. Therefore, investment spending is equal to 5 million bushels of wheat valuedat $3/bu., which costs $15 million. Total GDP is therefore $350 million+$15 million=$365million.2.Coal producer, steel producer, and consumers.(a)(i)Product approach: Coal producer produces 15 million tons of coal at $5/ton, which adds$75 million to GDP. The steel producer produces 10 million tons of steel at $20/ton,which is worth $200 million. The steel producer pays $125 million for 25 million tons ofcoal at$5/ton. The steel producer’s value added is therefore $75 million. GDP is equal to$75 million+$75 million=$150 million.(ii)Expenditure approach: Consumers buy 8 million tons of steel at $20/ton, so consumptionis $160 million. There is no investment and no government spending. Exports are 2million tons of steel at $20/ton, which is worth $40 million. Imports are 10 million tons ofcoal at $5/ton, which is worth $50 million. Net exports are therefore equal to $40 million$50 million=$10 million. GDP is therefore equal to $160 million+($10 million)=$150 million.(iii)Income approach: The coal producer pays $50 million in wages and the steel producerpays $40 million in wages, so total wages in the economy equal $90 million. The coalproducer receives $75 million in revenue for selling 15 million tons at $15/ton. The coalproducer pays $50 million in wages, so the coal producer’s profits are $25 million. Thesteel producer receives $200 million in revenue for selling 10 million tons of steel at$20/ton. The steel producer pays $40 million in wages and pays $125 million for the 25million tons ofcoal that it needs to produce steel. The steel producer’s profits aretherefore equal to$200 million$40 million$125 million=$35 million. Total profitincome in the economy is therefore $25 million+$35 million=$60 million. GDPtherefore is equal to wage income ($90 million) plus profit income ($60 million). GDP istherefore $150 million.(b)There are no net factor payments from abroad in this example. Therefore, the currentaccount surplus is equal to net exports, which is equal to ($10 million).(c)As originally formulated, GNP is equal to GDP, which is equal to $150 million.Alternatively, if foreigners receive $25 million in coal industry profits as income, then netfactor payments from abroad are ($25 million), so GNP is equal to $125 million.3.Wheat and Bread(a)Product approach: Firm A produces 50,000 bushels of wheat, with no intermediate goodsinputs.At $3/bu., the value of Firm A’s production is equal to $150,000. Firm B produces50,000 loaves of bread at $2/loaf, which is valued at $100,000. Firm B pays $60,000 to

Page 11

Macroeconomics , 5th Edition Solution Manual - Page 11 preview image

Loading page image...

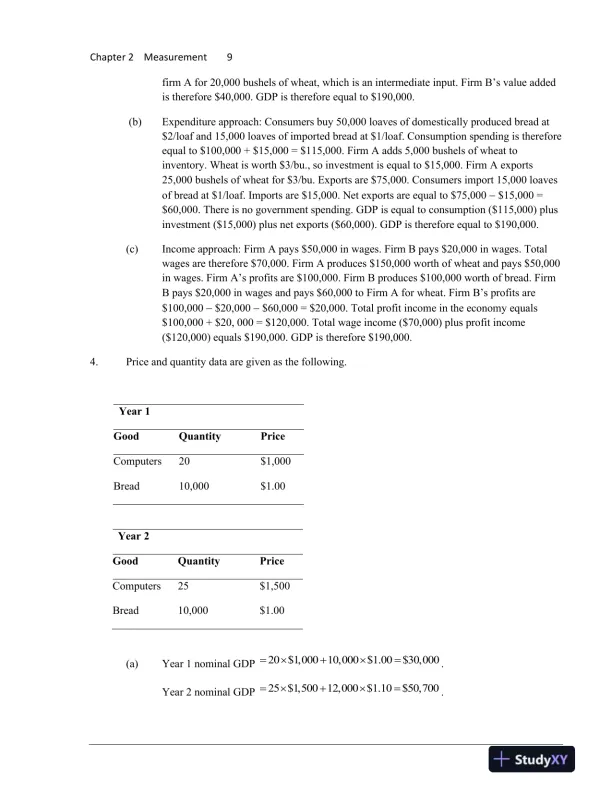
Chapter 2Measurement9firm A for 20,000 bushels of wheat, which is an intermediate input. Firm B’s value addedis therefore $40,000. GDP is therefore equal to $190,000.(b)Expenditure approach: Consumers buy 50,000 loaves of domestically produced bread at$2/loaf and 15,000 loaves of imported bread at $1/loaf. Consumption spending is thereforeequal to $100,000+$15,000=$115,000. Firm A adds 5,000 bushels of wheat toinventory. Wheat is worth $3/bu., so investment is equal to $15,000. Firm A exports25,000 bushels of wheat for $3/bu. Exports are $75,000. Consumers import 15,000 loavesof bread at $1/loaf. Imports are $15,000. Net exports are equal to $75,000$15,000=$60,000. There is no government spending. GDP is equal to consumption ($115,000) plusinvestment ($15,000) plus net exports ($60,000). GDP is therefore equal to $190,000.(c)Income approach: Firm A pays $50,000 in wages. Firm B pays $20,000 in wages. Totalwages are therefore $70,000. Firm A produces $150,000 worth of wheat and pays $50,000in wages. Firm A’s profits are $100,000. Firm B produces $100,000 worth of bread. FirmB pays $20,000 in wages and pays $60,000 to Firm A for wheat. Firm B’s profits are$100,000$20,000$60,000=$20,000. Total profit income in the economy equals$100,000+$20, 000=$120,000. Total wage income ($70,000) plus profit income($120,000) equals $190,000. GDP is therefore $190,000.4.Price and quantity data are given asthe following.Year 1GoodQuantityPriceComputers20$1,000Bread10,000$1.00Year 2GoodQuantityPriceComputers25$1,500Bread10,000$1.00(a)Year 1 nominal GDP20$1,00010,000$1.00$30,000=+=.Year 2 nominal GDP25$1,50012,000$1.10$50,700=+=.

Page 12

Macroeconomics , 5th Edition Solution Manual - Page 12 preview image

Loading page image...

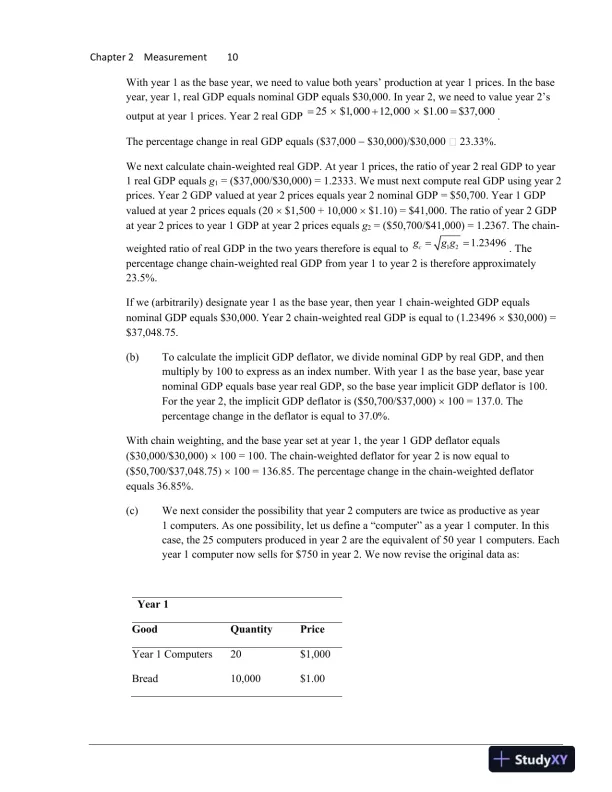
Chapter 2Measurement10With year 1 as the base year, we need to value both years’ production at year 1 prices. In the baseyear, year 1, real GDP equals nominal GDP equals $30,000. In year 2, we need to value year 2’soutput at year 1 prices. Year 2 real GDP25$1,00012,000$1.00$37,000=+=.The percentage change in real GDP equals ($37,000$30,000)/$30,00023.33%.We next calculate chain-weighted real GDP. At year 1 prices, the ratio of year 2 real GDP to year1 real GDP equalsg1=($37,000/$30,000)=1.2333. We must next compute real GDP using year 2prices. Year 2 GDP valued at year 2 prices equals year 2 nominal GDP=$50,700. Year 1 GDPvalued at year 2 prices equals (20$1,500+10,000$1.10)=$41,000. The ratio of year 2 GDPat year 2 prices to year 1 GDP at year 2 prices equalsg2=($50,700/$41,000)=1.2367. The chain-weighted ratio of real GDP in the two years therefore is equal to121.23496cgg g==. Thepercentage change chain-weighted real GDP from year 1 to year 2 is therefore approximately23.5%.If we (arbitrarily) designate year 1 as the base year, then year 1 chain-weighted GDP equalsnominal GDP equals $30,000. Year 2 chain-weighted real GDP is equal to (1.23496$30,000)=$37,048.75.(b)To calculate the implicit GDP deflator, we divide nominal GDP by real GDP, and thenmultiply by 100 to express as an index number. With year 1 as the base year, base yearnominal GDP equals base year real GDP, so the base year implicit GDP deflator is 100.For the year 2, the implicit GDP deflator is ($50,700/$37,000)100=137.0. Thepercentage change in the deflator is equal to 37.0%.With chain weighting, and the base year set at year 1, the year 1 GDP deflator equals($30,000/$30,000)100=100. The chain-weighted deflator for year 2 is now equal to($50,700/$37,048.75)100=136.85. The percentage change in the chain-weighted deflatorequals 36.85%.(c)We next consider the possibility that year 2 computers are twice as productive as year1 computers. As one possibility, let us define a “computer” as a year 1 computer. In thiscase,the 25 computers produced in year 2 are the equivalent of 50 year 1 computers. Eachyear 1 computer now sells for $750 in year 2. We now revise the original data as:Year 1GoodQuantityPriceYear 1 Computers20$1,000Bread10,000$1.00

Page 13

Macroeconomics , 5th Edition Solution Manual - Page 13 preview image

Loading page image...

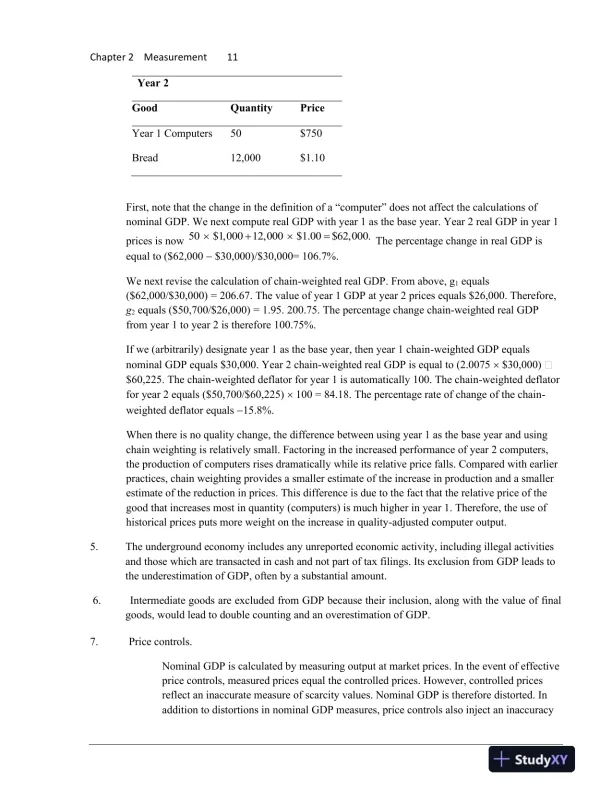
Chapter 2Measurement11Year 2GoodQuantityPriceYear 1 Computers50$750Bread12,000$1.10First, note that the change in the definition of a “computer” does not affect the calculations ofnominal GDP. We next compute real GDP with year 1 as the base year. Year 2 real GDP in year 1prices is now50$1,00012,000$1.00$62,000.+=The percentage change in real GDP isequal to ($62,000$30,000)/$30,000=106.7%.We next revise the calculation of chain-weighted real GDP. From above, g1equals($62,000/$30,000)=206.67. The value of year 1 GDP at year 2 prices equals $26,000. Therefore,g2equals ($50,700/$26,000)=1.95. 200.75. The percentage change chain-weighted real GDPfrom year 1 to year 2 is therefore 100.75%.If we (arbitrarily) designate year 1 as the base year, then year 1 chain-weighted GDP equalsnominal GDP equals $30,000. Year 2 chain-weighted real GDP is equal to (2.0075$30,000)$60,225. The chain-weighted deflator for year 1 is automatically 100. The chain-weighted deflatorfor year 2 equals ($50,700/$60,225)100=84.18. The percentage rate of change of the chain-weighted deflator equals15.8%.When there is no quality change, the difference between using year 1 as the base year and usingchain weighting is relatively small. Factoring in the increased performance of year 2 computers,the production of computers rises dramatically while its relative price falls. Compared with earlierpractices, chain weighting provides a smaller estimate of the increase in production and a smallerestimate of the reduction in prices. This difference is due to the fact that the relative price of thegood that increases most in quantity (computers) is much higher in year 1. Therefore, the use ofhistorical prices puts more weight on the increase in quality-adjusted computer output.5.The underground economy includesany unreported economic activity, including illegal activitiesandthose which are transacted in cash and not part of tax filings. Its exclusion fromGDP leads tothe underestimation of GDP, often by a substantial amount.6.Intermediate goods are excluded from GDP because their inclusion, along with the value of finalgoods, would lead to double counting and an overestimation of GDP.7.Price controls.Nominal GDP is calculated by measuring output at market prices. In the event of effectiveprice controls, measured prices equal the controlled prices. However, controlled pricesreflect an inaccurate measure of scarcity values. Nominal GDP is therefore distorted. Inaddition to distortions in nominal GDP measures, price controls also inject an inaccuracy

Page 14

Macroeconomics , 5th Edition Solution Manual - Page 14 preview image

Loading page image...

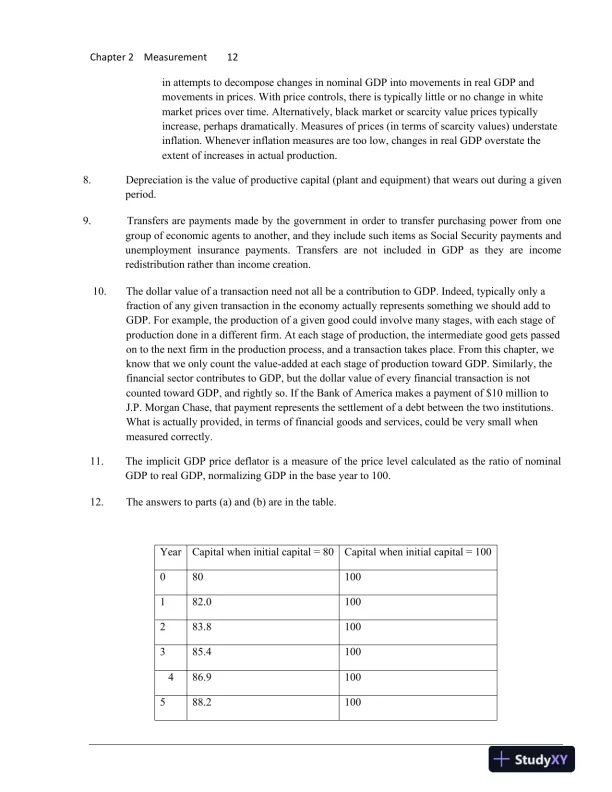
Chapter 2Measurement12in attempts to decompose changes in nominal GDP into movements in real GDP andmovements in prices. With price controls, there is typically little or no change in whitemarket prices over time. Alternatively, black market or scarcity value prices typicallyincrease, perhaps dramatically. Measures of prices (in terms of scarcity values) understateinflation. Whenever inflation measures are too low, changes in real GDP overstate theextent of increases in actual production.8.Depreciation is the value of productive capital (plant and equipment) that wears out during a givenperiod.9.Transfers are payments made by the government in order to transfer purchasing power from onegroup of economic agents to another, and they include such items as Social Security payments andunemployment insurance payments. Transfers are not included in GDP as they are incomeredistribution rather than income creation.10.The dollar value of a transaction need not all be a contribution to GDP. Indeed, typically only afraction of any given transaction in the economy actually represents something we should add toGDP. For example, the production of a given good could involve many stages, with each stage ofproduction done in a different firm. At each stage of production, the intermediate good gets passedon to the next firm in the production process, and a transaction takes place. From this chapter, weknow that we only count the value-added at each stage of production toward GDP. Similarly, thefinancial sector contributes to GDP, but the dollar value of every financial transaction is notcounted toward GDP, and rightly so. If the Bank of America makes a payment of $10 million toJ.P. Morgan Chase, that payment represents the settlement of a debt between the two institutions.What is actually provided, in terms of financial goods and services, could be very small whenmeasured correctly.11.The implicit GDP price deflator is a measure of the price level calculated as the ratio of nominalGDP to real GDP, normalizing GDP in the base year to 100.12.The answers to parts (a) and (b) are in the table.YearCapital wheninitial capital = 80Capital when initial capital = 100080100182.0100283.8100385.4100486.9100588.2100

Page 15

Macroeconomics , 5th Edition Solution Manual - Page 15 preview image

Loading page image...

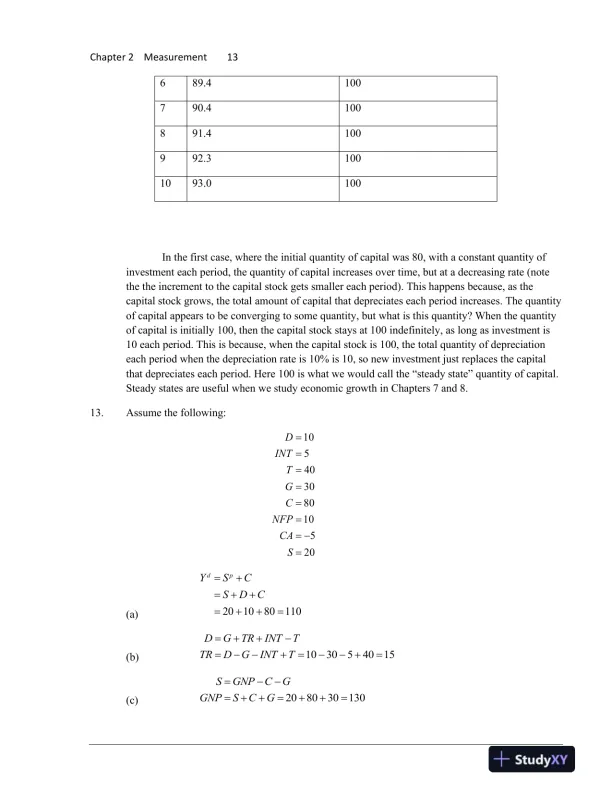
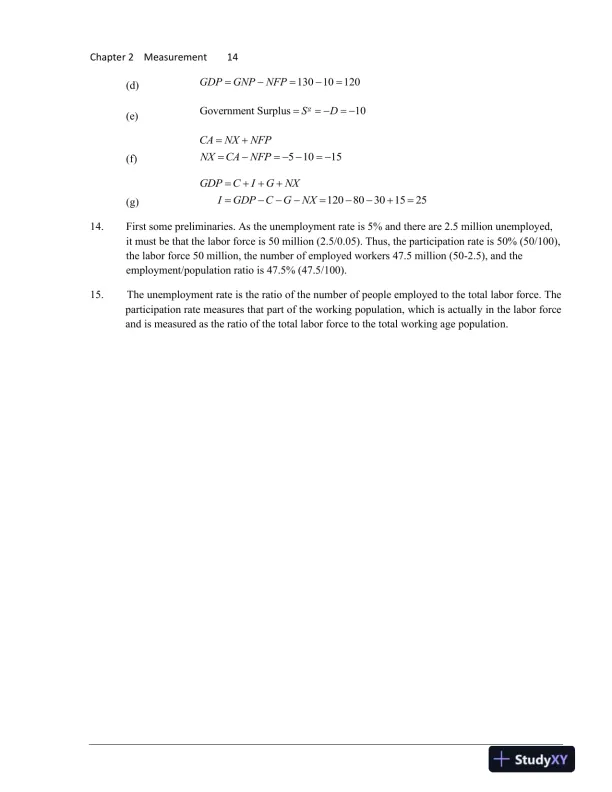
Chapter 2Measurement13689.4100790.4100891.4100992.31001093.0100In the first case, where the initial quantity ofcapital was 80, with a constant quantity ofinvestment each period, the quantity of capital increases over time, but at a decreasing rate (notethe the increment to the capital stock gets smaller each period). This happens because, as thecapital stock grows, the total amount of capital that depreciates each period increases. The quantityof capital appears to be converging to some quantity, but what is this quantity? When the quantityof capital is initially 100, then the capital stock stays at 100 indefinitely, as long as investment is10 each period. This is because, when the capital stock is 100, the total quantity of depreciationeach period when the depreciation rate is 10% is 10, so new investment just replaces the capitalthat depreciates each period. Here 100 is what we would call the “steady state” quantity of capital.Steady states are useful when we study economic growth in Chapters 7 and 8.13.Assume the following:10540308010520DINTTGCNFPCAS======= −=(a)201080110dpYSCSDC=+=++=++=(b)103054015DGTRINTTTRDGINTT=++=+=+=(c)208030130SGNPCGGNPSCG==++=++=

Page 16

Macroeconomics , 5th Edition Solution Manual - Page 16 preview image

Loading page image...

Chapter 2Measurement14(d)13010120GDPGNPNFP===(e)Government Surplus10gSD== −= −(f)51015CANXNFPNXCANFP=+== −= −(g)12080301525GDPCIGNXIGDPCGNX=+++==+=14.First some preliminaries. As the unemployment rate is 5% and there are 2.5 million unemployed,it must be that the labor force is 50 million (2.5/0.05). Thus, the participation rate is 50% (50/100),the labor force 50 million, the number of employed workers 47.5 million (50-2.5), and theemployment/population ratio is 47.5% (47.5/100).15.The unemployment rate is the ratio of the number of people employed to the total labor force. Theparticipation rate measures that part of the working population, which is actually in the labor forceand ismeasured as the ratio of the total labor force to the total working age population.
Preview Mode

This document has 128 pages. Sign in to access the full document!

Study Now!

XY-Copilot AI
Unlimited Access
Secure Payment
Instant Access
24/7 Support
Document Chat

Document Details

Subject
Economics

Related Documents

View all