Macroeconomics, Third Edition Solution Manual

Need textbook help? Macroeconomics, Third Edition Solution Manual provides the answers you need to solve every problem in your book.

Lucy Gray
Contributor
4.7
31
5 months ago
Preview (16 of 154 Pages)
100%
Purchase to unlock

Page 1

Macroeconomics, Third Edition Solution Manual - Page 1 preview image

Loading page image...

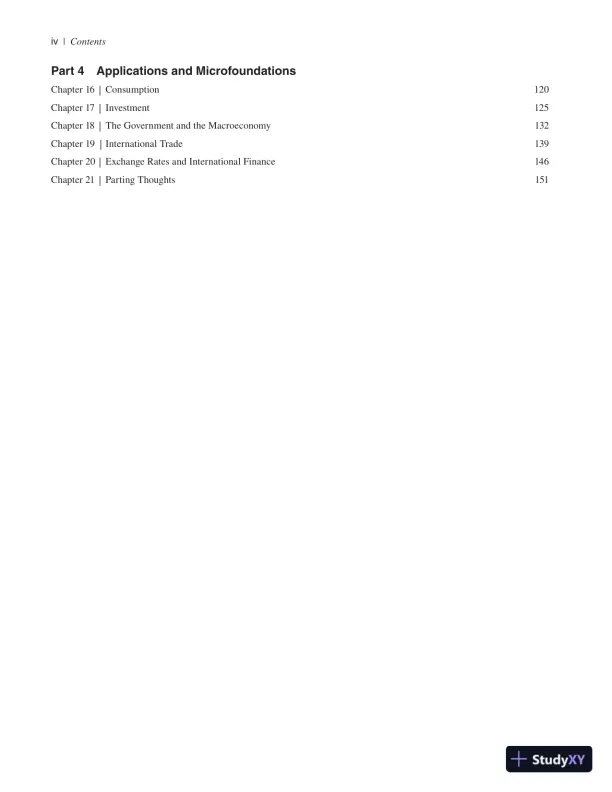
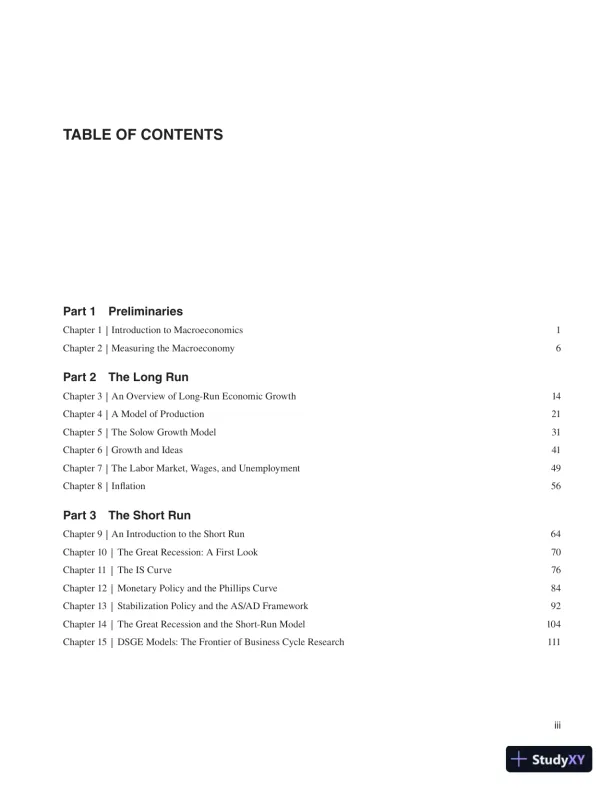
iiiPart 1PreliminariesChapter 1|Introduction to Macroeconomics1Chapter 2|Measuring the Macroeconomy6Part 2The Long RunChapter 3|An Overview of Long-Run Economic Growth14Chapter 4|A Model of Production21Chapter 5|The Solow Growth Model31Chapter 6|Growth and Ideas41Chapter 7|The Labor Market, Wages, and Unemployment49Chapter 8|Inflation56Part 3The Short RunChapter 9|An Introduction to the Short Run64Chapter 10|The Great Recession: A First Look70Chapter 11|The IS Curve76Chapter 12|Monetary Policy and the Phillips Curve84Chapter 13|Stabilization Policy and the AS/AD Framework92Chapter 14|The Great Recession and the Short-Run Model104Chapter 15|DSGE Models: The Frontier of Business Cycle Research111TABLE OF CONTENTS

Page 2

Macroeconomics, Third Edition Solution Manual - Page 2 preview image

Loading page image...

Page 3

Macroeconomics, Third Edition Solution Manual - Page 3 preview image

Loading page image...

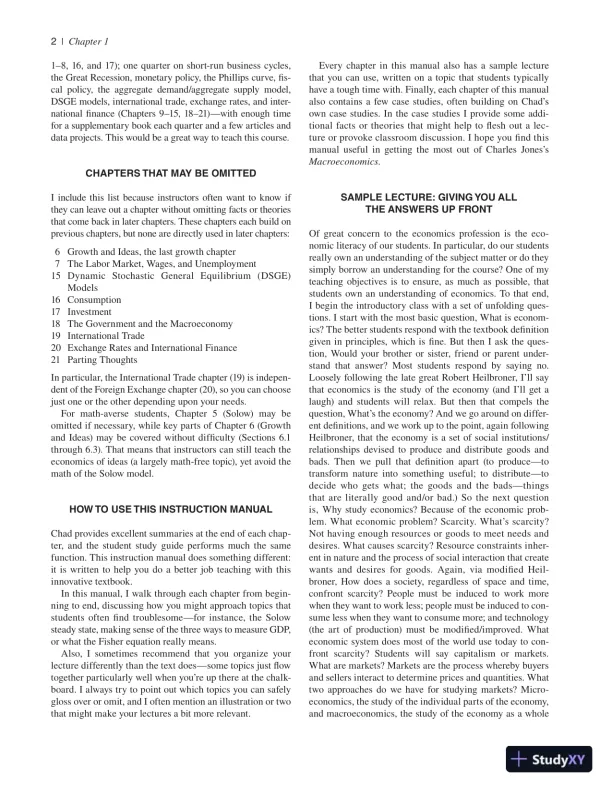
iv|ContentsPart 4Applications and MicrofoundationsChapter 16|Consumption120Chapter 17|Investment125Chapter 18|The Government and the Macroeconomy132Chapter 19|International Trade139Chapter 20|Exchange Rates and International Finance146Chapter 21|Parting Thoughts151

Page 4

Macroeconomics, Third Edition Solution Manual - Page 4 preview image

Loading page image...

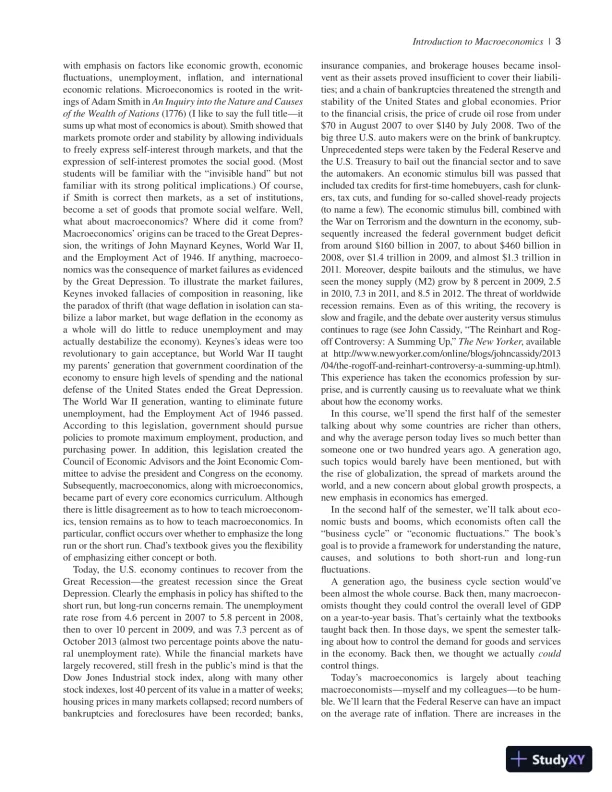
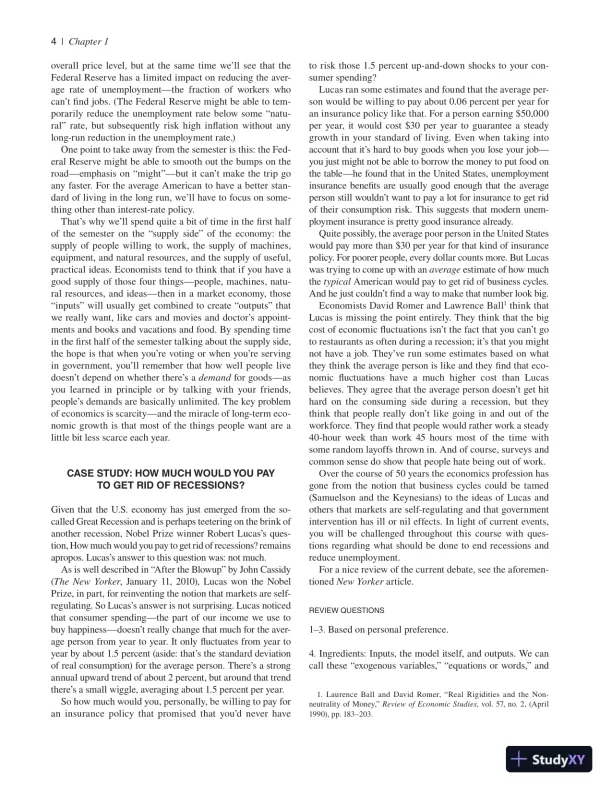
1our students learn, and how they learn. Most students whohave recently had a principles course and who are comfort-able with a little algebra should be able to handle Chapters 1through 14 in a semester. How much time you spend on thesechapters, whether or not you omit coverage of any of thesechapters, and the nature and skill level of your students willinfluence your coverage of the later chapters.Moreover, if you want to leave room for a few supplemen-tary articles, a nontechnical book, or a major empirical proj-ect or two, then you might have to tread lightly over some ofthe math in the growth- and labor-market models, which areself-contained and don’t directly come up again later in thesemester. Advice on how to do this is given in later chaptersof this manual.This third edition of the book provides an innovativechapter on dynamic stochastic general equilibrium (DSGE)models. This chapter provides a bridge between long-runeconomic growth and short-run economic fluctuations, andfits in nicely at the end of Part 3 of the textbook to remind usof the links between the long run and the short run. I’d rec-ommend that you make time in the semester to includeChapter 15 as a capstone to a semester course.ONE- QUARTER COURSE OR ONE- SEMESTER COURSE WITHMANY OUTSIDE READINGS AND PROJECTSChapters 1–4 (Introduction through the basics of growthand productivity), 8–11, and 15 (inflation, business cycles,and DGSE models), and two of the following: Chapters 5,6.1–6.3, and 7, or 12–14, and 18–20.TWO- QUARTER COURSE OR TWO- SEMESTER COURSEThe entire book—one quarter on long-run growth, labormarkets, inflation, consumption, and investment (ChaptersCHAPTER OVERVIEWThis is a conventional first textbook chapter: it defines mac-roeconomics, it mentions a few interesting topics, it sayswhat a model is, and it lays out the book’s separation intoLong Run, Short Run, and Applications and Microfounda-tions. It is quite a short chapter with few surprises, so ratherthan summarizing it, I will instead talk a little about whatmakes this book different, and lay out a few different waysyou can use it in your course.WHAT MAKES THIS BOOK DIFFERENTIt offers solid long-run growth coverage—including endog-enous growth—while simplifying the New Keynesian busi-ness cycle dramatically, and it does all this without anycalculus. Chad shows how long-run macroeconomic growthmodels have evolved and how tweaking the assumptions ofthe model can lead to new and interesting insights and pol-icy conclusions. Moreover, Chad is able to easily deduce ashort-run model from the long-run model, and therefore linkshort-run and long-run economic analyses. By streamliningthe coverage while teaching surprisingly solid microfounda-tions, Chad’s text gives you a solid chance to spend moretime on intelligent, model-driven policy discussions aboutgrowth and business cycles.HOW TO USE THIS TEXTBOOKCONVENTIONAL ONE- SEMESTER CLASSIn this day and age of assessment, we are ever conscious ofwhat we teach, how we teach it, who our students are, whatCHAPTER 1Introduction to Macroeconomics

Page 5

Macroeconomics, Third Edition Solution Manual - Page 5 preview image

Loading page image...

2|Chapter 1Every chapter in this manual also has a sample lecturethat you can use, written on a topic that students typicallyhave a tough time with. Finally, each chapter of this manualalso contains a few case studies, often building on Chad’sown case studies. In the case studies I provide some addi-tional facts or theories that might help to flesh out a lec-ture or provoke classroom discussion. I hope you find thismanual useful in getting the most out of Charles Jones’sMacroeconomics.SAMPLE LECTURE: GIVING YOU ALLTHE ANSWERS UP FRONTOf great concern to the economics profession is the eco-nomic literacy of our students. In particular, do our studentsreally own an understanding of the subject matter or do theysimply borrow an understanding for the course? One of myteaching objectives is to ensure, as much as possible, thatstudents own an understanding of economics. To that end,I begin the introductory class with a set of unfolding ques-tions. I start with the most basic question, What is econom-ics? The better students respond with the textbook definitiongiven in principles, which is fine. But then I ask the ques-tion, Would your brother or sister, friend or parent under-stand that answer? Most students respond by saying no.Loosely following the late great Robert Heilbroner, I’ll saythat economics is the study of the economy (and I’ll get alaugh) and students will relax. But then that compels thequestion, What’s the economy? And we go around on differ-ent definitions, and we work up to the point, again followingHeilbroner, that the economy is a set of social institutions/relationships devised to produce and distribute goods andbads. Then we pull that definition apart (to produce—totransform nature into something useful; to distribute—todecide who gets what; the goods and the bads—thingsthat are literally good and/or bad.) So the next questionis, Why study economics? Because of the economic prob-lem. What economic problem? Scarcity. What’s scarcity?Not having enough resources or goods to meet needs anddesires. What causes scarcity? Resource constraints inher-ent in nature and the process of social interaction that createwants and desires for goods. Again, via modified Heil-broner, How does a society, regardless of space and time,confront scarcity? People must be induced to work morewhen they want to work less; people must be induced to con-sume less when they want to consume more; and technology(the art of production) must be modified/improved. Whateconomic system does most of the world use today to con-front scarcity? Students will say capitalism or markets.What are markets? Markets are the process whereby buyersand sellers interact to determine prices and quantities. Whattwo approaches do we have for studying markets? Micro-economics, the study of the individual parts of the economy,and macroeconomics, the study of the economy as a whole1–8, 16, and 17); one quarter on short-run business cycles,the Great Recession, monetary policy, the Phillips curve, fis-cal policy, the aggregate demand/aggregate supply model,DSGE models, international trade, exchange rates, and inter-national finance (Chapters 9–15, 18–21)—with enough timefor a supplementary book each quarter and a few articles anddata projects. This would be a great way to teach this course.CHAPTERS THAT MAY BE OMITTEDI include this list because instructors often want to know ifthey can leave out a chapter without omitting facts or theoriesthat come back in later chapters. These chapters each build onprevious chapters, but none are directly used in later chapters:6Growth and Ideas, the last growth chapter7The Labor Market, Wages, and Unemployment15DynamicStochasticGeneralEquilibrium(DSGE)Models16Consumption17Investment18The Government and the Macroeconomy19International Trade20Exchange Rates and International Finance21Parting ThoughtsIn particular, the International Trade chapter (19) is indepen-dent of the Foreign Exchange chapter (20), so you can choosejust one or the other depending upon your needs.For math-averse students, Chapter 5 (Solow) may beomitted if necessary, while key parts of Chapter 6 (Growthand Ideas) may be covered without difficulty (Sections 6.1through 6.3). That means that instructors can still teach theeconomics of ideas (a largely math-free topic), yet avoid themath of the Solow model.HOW TO USE THIS INSTRUCTION MANUALChad provides excellent summaries at the end of each chap-ter, and the student study guide performs much the samefunction. This instruction manual does something different:it is written to help you do a better job teaching with thisinnovative textbook.In this manual, I walk through each chapter from begin-ning to end, discussing how you might approach topics thatstudents often find troublesome—for instance, the Solowsteady state, making sense of the three ways to measure GDP,or what the Fisher equation really means.Also, I sometimes recommend that you organize yourlecture differently than the text does—some topics just flowtogether particularly well when you’re up there at the chalk-board. I always try to point out which topics you can safelygloss over or omit, and I often mention an illustration or twothat might make your lectures a bit more relevant.

Page 6

Macroeconomics, Third Edition Solution Manual - Page 6 preview image

Loading page image...

Introduction to Macroeconomics|3insurance companies, and brokerage houses became insol-vent as their assets proved insufficient to cover their liabili-ties; and a chain of bankruptcies threatened the strength andstability of the United States and global economies. Priorto the financial crisis, the price of crude oil rose from under$70 in August 2007 to over $140 by July 2008. Two of thebig three U.S. auto makers were on the brink of bankruptcy.Unprecedented steps were taken by the Federal Reserve andthe U.S. Treasury to bail out the financial sector and to savethe automakers. An economic stimulus bill was passed thatincluded tax credits for first-time homebuyers, cash for clunk-ers, tax cuts, and funding for so-called shovel-ready projects(to name a few). The economic stimulus bill, combined withthe War on Terrorism and the downturn in the economy, sub-sequently increased the federal government budget deficitfrom around $160 billion in 2007, to about $460 billion in2008, over $1.4 trillion in 2009, and almost $1.3 trillion in2011. Moreover, despite bailouts and the stimulus, we haveseen the money supply (M2) grow by 8 percent in 2009, 2.5in 2010, 7.3 in 2011, and 8.5 in 2012. The threat of worldwiderecession remains. Even as of this writing, the recovery isslow and fragile, and the debate over austerity versus stimuluscontinues to rage (see John Cassidy, “The Reinhart and Rog-off Controversy: A Summing Up,”The New Yorker, availableat http://www.newyorker.com/online/blogs/johncassidy/2013/04/the-rogoff-and-reinhart-controversy-a-summing-up.html).This experience has taken the economics profession by sur-prise, and is currently causing us to reevaluate what we thinkabout how the economy works.In this course, we’ll spend the first half of the semestertalking about why some countries are richer than others,and why the average person today lives so much better thansomeone one or two hundred years ago. A generation ago,such topics would barely have been mentioned, but withthe rise of globalization, the spread of markets around theworld, and a new concern about global growth prospects, anew emphasis in economics has emerged.In the second half of the semester, we’ll talk about eco-nomic busts and booms, which economists often call the“business cycle” or “economic fluctuations.” The book’sgoal is to provide a framework for understanding the nature,causes,andsolutionstobothshort-runandlong-runfluctuations.A generation ago, the business cycle section would’vebeen almost the whole course. Back then, many macroecon-omists thought they could control the overall level of GDPon a year-to-year basis. That’s certainly what the textbookstaught back then. In those days, we spent the semester talk-ing about how to control the demand for goods and servicesin the economy. Back then, we thought we actuallycouldcontrol things.Today’smacroeconomicsislargelyaboutteachingmacroeconomists—myself and my colleagues—to be hum-ble. We’ll learn that the Federal Reserve can have an impacton the average rate of inflation. There are increases in thewith emphasis on factors like economic growth, economicfluctuations,unemployment,inflation,andinternationaleconomic relations. Microeconomics is rooted in the writ-ings of Adam Smith inAn Inquiry into the Nature and Causesof the Wealth of Nations(1776) (I like to say the full title—itsums up what most of economics is about). Smith showed thatmarkets promote order and stability by allowing individualsto freely express self-interest through markets, and that theexpression of self-interest promotes the social good. (Moststudents will be familiar with the “invisible hand” but notfamiliar with its strong political implications.) Of course,if Smith is correct then markets, as a set of institutions,become a set of goods that promote social welfare. Well,what about macroeconomics? Where did it come from?Macroeconomics’ origins can be traced to the Great Depres-sion, the writings of John Maynard Keynes, World War II,and the Employment Act of 1946. If anything, macroeco-nomics was the consequence of market failures as evidencedby the Great Depression. To illustrate the market failures,Keynes invoked fallacies of composition in reasoning, likethe paradox of thrift (that wage deflation in isolation can sta-bilize a labor market, but wage deflation in the economy asa whole will do little to reduce unemployment and mayactually destabilize the economy). Keynes’s ideas were toorevolutionary to gain acceptance, but World War II taughtmy parents’ generation that government coordination of theeconomy to ensure high levels of spending and the nationaldefense of the United States ended the Great Depression.The World War II generation, wanting to eliminate futureunemployment, had the Employment Act of 1946 passed.According to this legislation, government should pursuepolicies to promote maximum employment, production, andpurchasing power. In addition, this legislation created theCouncil of Economic Advisors and the Joint Economic Com-mittee to advise the president and Congress on the economy.Subsequently, macroeconomics, along with microeconomics,became part of every core economics curriculum. Althoughthere is little disagreement as to how to teach microeconom-ics, tension remains as to how to teach macroeconomics. Inparticular, conflict occurs over whether to emphasize the longrun or the short run. Chad’s textbook gives you the flexibilityof emphasizing either concept or both.Today, the U.S. economy continues to recover from theGreat Recession—the greatest recession since the GreatDepression. Clearly the emphasis in policy has shifted to theshort run, but long-run concerns remain. The unemploymentrate rose from 4.6 percent in 2007 to 5.8 percent in 2008,then to over 10 percent in 2009, and was 7.3 percent as ofOctober 2013 (almost two percentage points above the natu-ral unemployment rate). While the financial markets havelargely recovered, still fresh in the public’s mind is that theDow Jones Industrial stock index, along with many otherstock indexes, lost 40 percent of its value in a matter of weeks;housing prices in many markets collapsed; record numbers ofbankruptcies and foreclosures have been recorded; banks,

Page 7

Macroeconomics, Third Edition Solution Manual - Page 7 preview image

Loading page image...

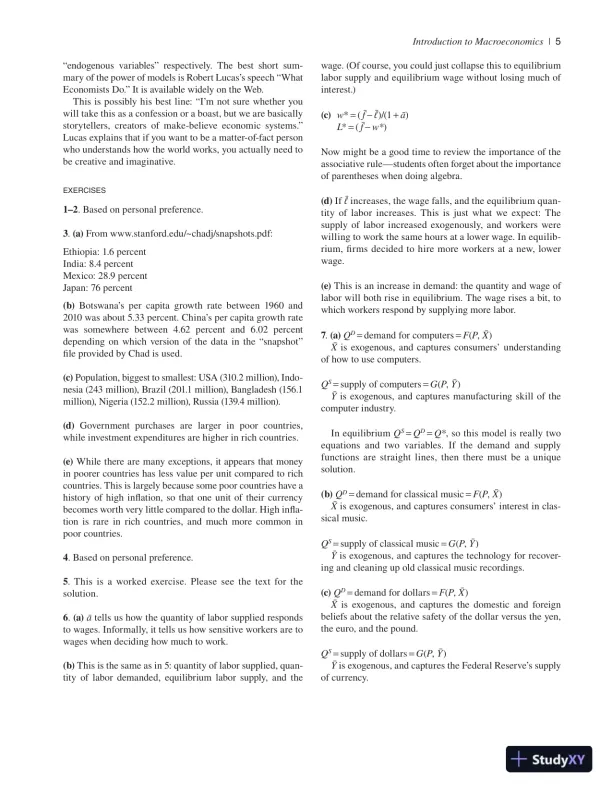
4|Chapter 1to risk those 1.5 percent up-and-down shocks to your con-sumer spending?Lucas ran some estimates and found that the average per-son would be willing to pay about 0.06 percent per year foran insurance policy like that. For a person earning $50,000per year, it would cost $30 per year to guarantee a steadygrowth in your standard of living. Even when taking intoaccount that it’s hard to buy goods when you lose your job—you just might not be able to borrow the money to put food onthe table—he found that in the United States, unemploymentinsurance benefits are usually good enough that the averageperson still wouldn’t want to pay a lot for insurance to get ridof their consumption risk. This suggests that modern unem-ployment insurance is pretty good insurance already.Quite possibly, the average poor person in the United Stateswould pay more than $30 per year for that kind of insurancepolicy. For poorer people, every dollar counts more. But Lucaswas trying to come up with anaverageestimate of how muchthetypicalAmerican would pay to get rid of business cycles.And he just couldn’t find a way to make that number look big.Economists David Romer and Lawrence Ball1think thatLucas is missing the point entirely. They think that the bigcost of economic fluctuations isn’t the fact that you can’t goto restaurants as often during a recession; it’s that you mightnot have a job. They’ve run some estimates based on whatthey think the average person is like and they find that eco-nomic fluctuations have a much higher cost than Lucasbelieves. They agree that the average person doesn’t get hithard on the consuming side during a recession, but theythink that people really don’t like going in and out of theworkforce. They find that people would rather work a steady40-hour week than work 45 hours most of the time withsome random layoffs thrown in. And of course, surveys andcommon sense do show that people hate being out of work.Over the course of 50 years the economics profession hasgone from the notion that business cycles could be tamed(Samuelson and the Keynesians) to the ideas of Lucas andothers that markets are self-regulating and that governmentintervention has ill or nil effects. In light of current events,you will be challenged throughout this course with ques-tions regarding what should be done to end recessions andreduce unemployment.For a nice review of the current debate, see the aforemen-tionedNew Yorkerarticle.REVIEW QUESTIONS1–3. Based on personal preference.4. Ingredients: Inputs, the model itself, and outputs. We cancall these “exogenous variables,” “equations or words,” and1. Laurence Ball and David Romer, “Real Rigidities and the Non-neutrality of Money,”Review of Economic Studies, vol. 57, no. 2, (April1990), pp. 183–203.overall price level, but at the same time we’ll see that theFederal Reserve has a limited impact on reducing the aver-age rate of unemployment—the fraction of workers whocan’t find jobs. (The Federal Reserve might be able to tem-porarily reduce the unemployment rate below some “natu-ral” rate, but subsequently risk high inflation without anylong-run reduction in the unemployment rate.)One point to take away from the semester is this: the Fed-eral Reserve might be able to smooth out the bumps on theroad—emphasis on “might”—but it can’t make the trip goany faster. For the average American to have a better stan-dard of living in the long run, we’ll have to focus on some-thing other than interest-rate policy.That’s why we’ll spend quite a bit of time in the first halfof the semester on the “supply side” of the economy: thesupply of people willing to work, the supply of machines,equipment, and natural resources, and the supply of useful,practical ideas. Economists tend to think that if you have agood supply of those four things—people, machines, natu-ral resources, and ideas—then in a market economy, those“inputs” will usually get combined to create “outputs” thatwe really want, like cars and movies and doctor’s appoint-ments and books and vacations and food. By spending timein the first half of the semester talking about the supply side,the hope is that when you’re voting or when you’re servingin government, you’ll remember that how well people livedoesn’t depend on whether there’s ademandfor goods—asyou learned in principle or by talking with your friends,people’s demands are basically unlimited. The key problemof economics is scarcity—and the miracle of long-term eco-nomic growth is that most of the things people want are alittle bit less scarce each year.CASE STUDY: HOW MUCH WOULD YOU PAYTO GET RID OF RECESSIONS?Given that the U.S. economy has just emerged from the so-called Great Recession and is perhaps teetering on the brink ofanother recession, Nobel Prize winner Robert Lucas’s ques-tion, How much would you pay to get rid of recessions?remainsapropos. Lucas’s answer to this question was: not much.As is well described in “After the Blowup” by John Cassidy(The New Yorker, January 11, 2010), Lucas won the NobelPrize, in part, for reinventing the notion that markets are self-regulating. So Lucas’s answer is not surprising. Lucas noticedthat consumer spending—the part of our income we use tobuy happiness—doesn’t really change that much for the aver-age person from year to year. It only fluctuates from year toyear by about 1.5 percent (aside: that’s the standard deviationof real consumption) for the average person. There’s a strongannual upward trend of about 2 percent, but around that trendthere’s a small wiggle, averaging about 1.5 percent per year.So how much would you, personally, be willing to pay foran insurance policy that promised that you’d never have

Page 8

Macroeconomics, Third Edition Solution Manual - Page 8 preview image

Loading page image...

Introduction to Macroeconomics|5wage. (Of course, you could just collapse this to equilibriumlabor supply and equilibrium wage without losing much ofinterest.)(c)w*=(Gê)/(1+ā)L*=(Gw*)Now might be a good time to review the importance of theassociative rule—students often forget about the importanceof parentheses when doing algebra.(d)Ifêincreases, the wage falls, and the equilibrium quan-tity of labor increases. This is just what we expect: Thesupply of labor increased exogenously, and workers werewilling to work the same hours at a lower wage. In equilib-rium, firms decided to hire more workers at a new, lowerwage.(e)This is an increase in demand: the quantity and wage oflabor will both rise in equilibrium. The wage rises a bit, towhich workers respond by supplying more labor.7.(a)QD=demand for computers=F(P,9)9is exogenous, and captures consumers’ understandingof how to use computers.QS=supply of computers=G(P,ĵ)ĵis exogenous, and captures manufacturing skill of thecomputer industry.In equilibriumQS=QD=Q*, so this model is really twoequations and two variables. If the demand and supplyfunctions are straight lines, then there must be a uniquesolution.(b)QD=demand for classical music=F(P,9)9is exogenous, and captures consumers’ interest in clas-sical music.QS=supply of classical music=G(P,ĵ)ĵis exogenous, and captures the technology for recover-ing and cleaning up old classical music recordings.(c)QD=demand for dollars=F(P,9)9is exogenous, and captures the domestic and foreignbeliefs about the relative safety of the dollar versus the yen,the euro, and the pound.QS=supply of dollars=G(P,ĵ)ĵis exogenous, and captures the Federal Reserve’s supplyof currency.“endogenous variables” respectively. The best short sum-mary of the power of models is Robert Lucas’s speech “WhatEconomists Do.” It is available widely on the Web.This is possibly his best line: “I’m not sure whether youwill take this as a confession or a boast, but we are basicallystorytellers, creators of make-believe economic systems.”Lucas explains that if you want to be a matter-of-fact personwho understands how the world works, you actually need tobe creative and imaginative.EXERCISES1–2. Based on personal preference.3.(a)From www.stanford.edu/~chadj/snapshots.pdf:Ethiopia: 1.6 percentIndia: 8.4 percentMexico: 28.9 percentJapan: 76 percent(b)Botswana’s per capita growth rate between 1960 and2010 was about 5.33 percent. China’s per capita growth ratewas somewhere between 4.62 percent and 6.02 percentdepending on which version of the data in the “snapshot”file provided by Chad is used.(c)Population, biggest to smallest: USA (310.2 million), Indo-nesia (243 million), Brazil (201.1 million), Bangladesh (156.1million), Nigeria (152.2 million), Russia (139.4 million).(d)Government purchases are larger in poor countries,while investment expenditures are higher in rich countries.(e)While there are many exceptions, it appears that moneyin poorer countries has less value per unit compared to richcountries. This is largely because some poor countries have ahistory of high inflation, so that one unit of their currencybecomes worth very little compared to the dollar. High infla-tion is rare in rich countries, and much more common inpoor countries.4. Based on personal preference.5. This is a worked exercise. Please see the text for thesolution.6.(a)ātells us how the quantity of labor supplied respondsto wages. Informally, it tells us how sensitive workers are towages when deciding how much to work.(b)This is the same as in 5: quantity of labor supplied, quan-tity of labor demanded, equilibrium labor supply, and the

Page 9

Macroeconomics, Third Edition Solution Manual - Page 9 preview image

Loading page image...

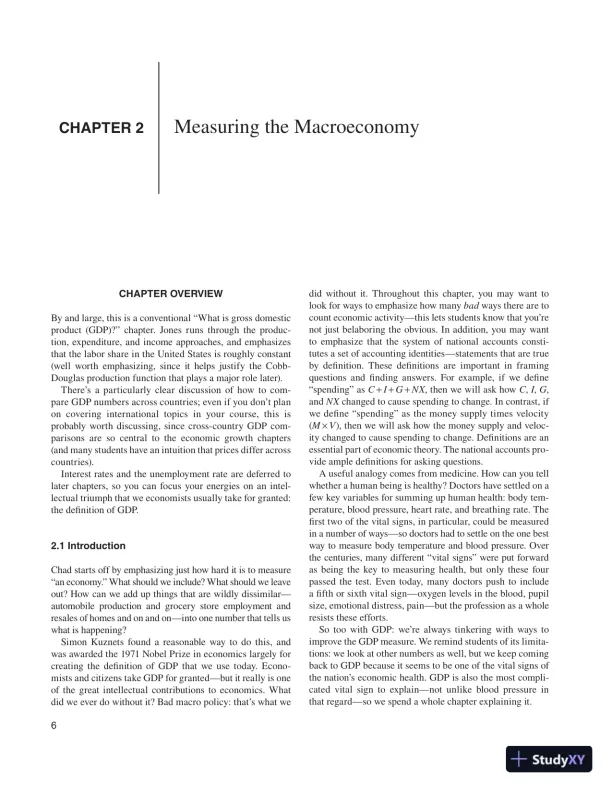
6did without it. Throughout this chapter, you may want tolook for ways to emphasize how manybadways there are tocount economic activity—this lets students know that you’renot just belaboring the obvious. In addition, you may wantto emphasize that the system of national accounts consti-tutes a set of accounting identities—statements that are trueby definition. These definitions are important in framingquestions and finding answers. For example, if we define“spending” asC+I+G+NX, then we will ask howC,I,G,andNXchanged to cause spending to change. In contrast, ifwe define “spending” as the money supply times velocity(M×V), then we will ask how the money supply and veloc-ity changed to cause spending to change. Definitions are anessential part of economic theory. The national accounts pro-vide ample definitions for asking questions.A useful analogy comes from medicine. How can you tellwhether a human being is healthy? Doctors have settled on afew key variables for summing up human health: body tem-perature, blood pressure, heart rate, and breathing rate. Thefirst two of the vital signs, in particular, could be measuredin a number of ways—so doctors had to settle on the one bestway to measure body temperature and blood pressure. Overthe centuries, many different “vital signs” were put forwardas being the key to measuring health, but only these fourpassed the test. Even today, many doctors push to includea fifth or sixth vital sign—oxygen levels in the blood, pupilsize, emotional distress, pain—but the profession as a wholeresists these efforts.So too with GDP: we’re always tinkering with ways toimprove the GDP measure. We remind students of its limita-tions: we look at other numbers as well, but we keep comingback to GDP because it seems to be one of the vital signs ofthe nation’s economic health. GDP is also the most compli-cated vital sign to explain—not unlike blood pressure inthat regard—so we spend a whole chapter explaining it.CHAPTER OVERVIEWBy and large, this is a conventional “What is gross domesticproduct (GDP)?” chapter. Jones runs through the produc-tion, expenditure, and income approaches, and emphasizesthat the labor share in the United States is roughly constant(well worth emphasizing, since it helps justify the Cobb-Douglas production function that plays a major role later).There’s a particularly clear discussion of how to com-pare GDP numbers across countries; even if you don’t planon covering international topics in your course, this isprobably worth discussing, since cross-country GDP com-parisons are so central to the economic growth chapters(and many students have an intuition that prices differ acrosscountries).Interest rates and the unemployment rate are deferred tolater chapters, so you can focus your energies on an intel-lectual triumph that we economists usually take for granted:the definition of GDP.2.1 IntroductionChad starts off by emphasizing just how hard it is to measure“an economy.” What should we include? What should we leaveout? How can we add up things that are wildly dissimilar—automobile production and grocery store employment andresales of homes and on and on—into one number that tells uswhat is happening?Simon Kuznets found a reasonable way to do this, andwas awarded the 1971 Nobel Prize in economics largely forcreating the definition of GDP that we use today. Econo-mists and citizens take GDP for granted—but it really is oneof the great intellectual contributions to economics. Whatdid we ever do without it? Bad macro policy: that’s what weCHAPTER 2Mea sur ing the Macroeconomy

Page 10

Macroeconomics, Third Edition Solution Manual - Page 10 preview image

Loading page image...

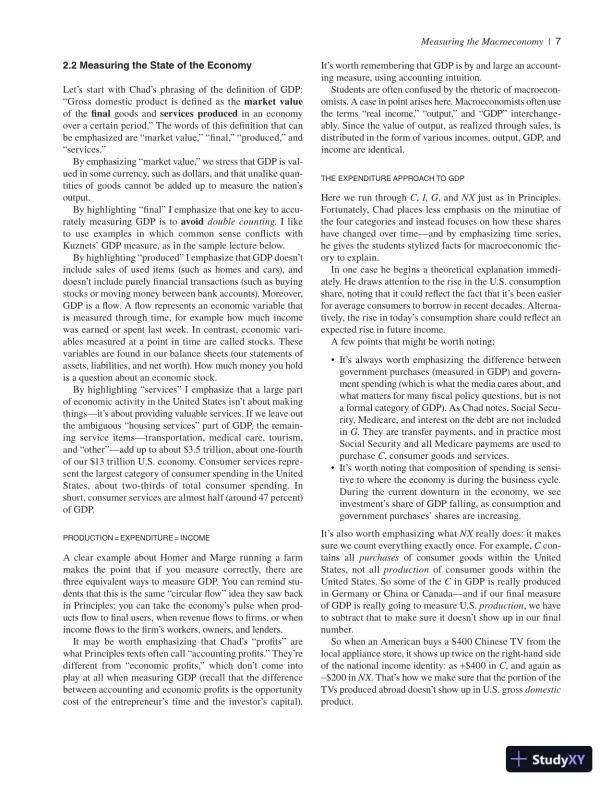
Mea sur ing the Macroeconomy|7It’s worth remembering that GDP is by and large an account-ing measure, using accounting intuition.Students are often confused by the rhetoric of macroecon-omists. A case in point arises here. Macroeconomists often usethe terms “real income,” “output,” and “GDP” interchange-ably. Since the value of output, as realized through sales, isdistributed in the form of various incomes, output, GDP, andincome are identical.THE EXPENDITURE APPROACH TO GDPHere we run throughC,I,G, andNXjust as in Principles.Fortunately, Chad places less emphasis on the minutiae ofthe four categories and instead focuses on how these shareshave changed over time—and by emphasizing time series,he gives the students stylized facts for macroeconomic the-ory to explain.In one case he begins a theoretical explanation immedi-ately. He draws attention to the rise in the U.S. consumptionshare, noting that it could reflect the fact that it’s been easierfor average consumers to borrow in recent decades. Alterna-tively, the rise in today’s consumption share could reflect anexpected rise in future income.A few points that might be worth noting:• It’s always worth emphasizing the difference betweengovernment purchases (measured in GDP) and govern-ment spending (which is what the media cares about, andwhat matters for many fiscal policy questions, but is nota formal category of GDP). As Chad notes, Social Secu-rity, Medicare, and interest on the debt are not includedinG. They are transfer payments, and in practice mostSocial Security and all Medicare payments are used topurchaseC, consumer goods and services.• It’s worth noting that composition of spending is sensi-tive to where the economy is during the business cycle.During the current downturn in the economy, we seeinvestment’s share of GDP falling, as consumption andgovernment purchases’ shares are increasing.It’s also worth emphasizing whatNXreally does: it makessure we count everything exactly once. For example,Ccon-tains allpurchasesof consumer goods within the UnitedStates, not allproductionof consumer goods within theUnited States. So some of theCin GDP is really producedin Germany or China or Canada—and if our final measureof GDP is really going to measure U.S.production, we haveto subtract that to make sure it doesn’t show up in our finalnumber.So when an American buys a $400 Chinese TV from thelocal appliance store, it shows up twice on the right-hand sideof the national income identity: as+$400 inC, and again as$200 inNX. That’s how we make sure that the portion of theTVs produced abroad doesn’t show up in U.S. grossdomesticproduct.2.2 Mea suring the State of the EconomyLet’s start with Chad’s phrasing of the definition of GDP:“Gross domestic product is defined as themarket valueof thefinalgoods andservices producedin an economyover a certain period.” The words of this definition that canbe emphasized are “market value,” “final,” “produced,” and“services.”By emphasizing “market value,” we stress that GDP is val-ued in some currency, such as dollars, and that unalike quan-tities of goods cannot be added up to measure the nation’soutput.By highlighting “final” I emphasize that one key to accu-rately measuring GDP is toavoiddouble counting. I liketo use examples in which common sense conflicts withKuznets’ GDP measure, as in the sample lecture below.By highlighting “produced” I emphasize that GDP doesn’tinclude sales of used items (such as homes and cars), anddoesn’t include purely financial transactions (such as buyingstocks or moving money between bank accounts). Moreover,GDP is a flow. A flow represents an economic variable thatis measured through time, for example how much incomewas earned or spent last week. In contrast, economic vari-ables measured at a point in time are called stocks. Thesevariables are found in our balance sheets (our statements ofassets, liabilities, and net worth). How much money you holdis a question about an economic stock.By highlighting “services” I emphasize that a large partof economic activity in the United States isn’t about makingthings—it’s about providing valuable services. If we leave outthe ambiguous “housing services” part of GDP, the remain-ing service items—transportation, medical care, tourism,and “other”—add up to about $3.5 trillion, about one-fourthof our $13 trillion U.S. economy. Consumer services repre-sent the largest category of consumer spending in the UnitedStates, about two-thirds of total consumer spending. Inshort, consumer services are almost half (around 47 percent)of GDP.PRODUCTION = EXPENDITURE = INCOMEA clear example about Homer and Marge running a farmmakes the point that if you measure correctly, there arethree equivalent ways to measure GDP. You can remind stu-dents that this is the same “circular flow” idea they saw backin Principles: you can take the economy’s pulse when prod-ucts flow to final users, when revenue flows to firms, or whenincome flows to the firm’s workers, owners, and lenders.It may be worth emphasizing that Chad’s “profits” arewhat Principles texts often call “accounting profits.” They’redifferent from “economic profits,” which don’t come intoplay at all when measuring GDP (recall that the differencebetween accounting and economic profits is the opportunitycost of the entrepreneur’s time and the investor’s capital).

Page 11

Macroeconomics, Third Edition Solution Manual - Page 11 preview image

Loading page image...

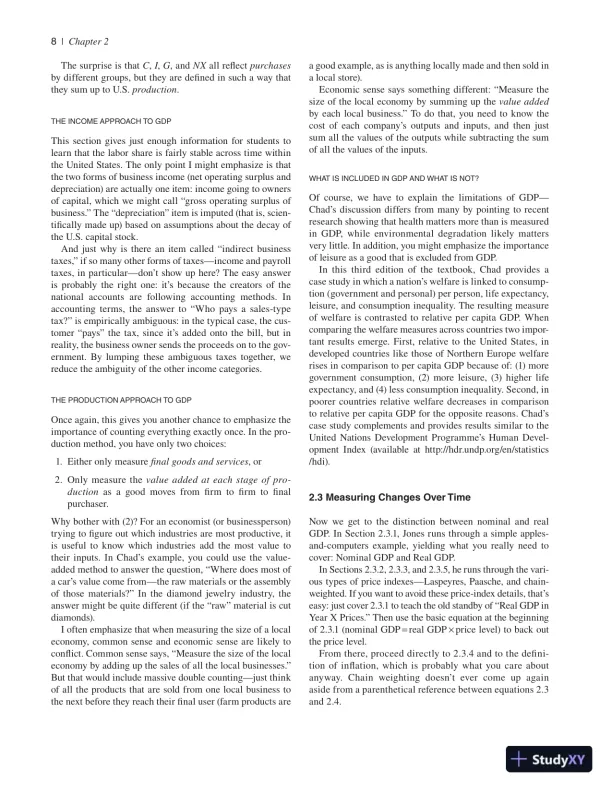
8|Chapter 2a good example, as is anything locally made and then sold ina local store).Economic sense says something different: “Measure thesize of the local economy by summing up thevalue addedby each local business.” To do that, you need to know thecost of each company’s outputs and inputs, and then justsum all the values of the outputs while subtracting the sumof all the values of the inputs.WHAT IS INCLUDED IN GDP AND WHAT IS NOT?Of course, we have to explain the limitations of GDP—Chad’s discussion differs from many by pointing to recentresearch showing that health matters more than is measuredin GDP, while environmental degradation likely mattersvery little. In addition, you might emphasize the importanceof leisure as a good that is excluded from GDP.In this third edition of the textbook, Chad provides acase study in which a nation’s welfare is linked to consump-tion (government and personal) per person, life expectancy,leisure, and consumption inequality. The resulting measureof welfare is contrasted to relative per capita GDP. Whencomparing the welfare measures across countries two impor-tant results emerge. First, relative to the United States, indeveloped countries like those of Northern Europe welfarerises in comparison to per capita GDP because of: (1) moregovernment consumption, (2) more leisure, (3) higher lifeexpectancy, and (4) less consumption inequality. Second, inpoorer countries relative welfare decreases in comparisonto relative per capita GDP for the opposite reasons. Chad’scase study complements and provides results similar to theUnited Nations Development Programme’s Human Devel-opment Index (available at http://hdr.undp.org/en/statistics/hdi).2.3 Mea suring Changes Over TimeNow we get to the distinction between nominal and realGDP. In Section 2.3.1, Jones runs through a simple apples-and-computers example, yielding what you really need tocover: Nominal GDP and Real GDP.In Sections 2.3.2, 2.3.3, and 2.3.5, he runs through the vari-ous types of price indexes—Laspeyres, Paasche, and chain-weighted. If you want to avoid these price-index details, that’seasy: just cover 2.3.1 to teach the old standby of “Real GDP inYear X Prices.” Then use the basic equation at the beginningof 2.3.1 (nominal GDP=real GDP×price level) to back outthe price level.From there, proceed directly to 2.3.4 and to the defini-tion of inflation, which is probably what you care aboutanyway. Chain weighting doesn’t ever come up againaside from a parenthetical reference between equations 2.3and 2.4.The surprise is thatC,I,G, andNXall reflectpurchasesby different groups, but they are defined in such a way thatthey sum up to U.S.production.THE INCOME APPROACH TO GDPThis section gives just enough information for students tolearn that the labor share is fairly stable across time withinthe United States. The only point I might emphasize is thatthe two forms of business income (net operating surplus anddepreciation) are actually one item: income going to ownersof capital, which we might call “gross operating surplus ofbusiness.” The “depreciation” item is imputed (that is, scien-tifically made up) based on assumptions about the decay ofthe U.S. capital stock.And just why is there an item called “indirect businesstaxes,” if so many other forms of taxes—income and payrolltaxes, in particular—don’t show up here? The easy answeris probably the right one: it’s because the creators of thenational accounts are following accounting methods. Inaccounting terms, the answer to “Who pays a sales-typetax?” is empirically ambiguous: in the typical case, the cus-tomer “pays” the tax, since it’s added onto the bill, but inreality, the business owner sends the proceeds on to the gov-ernment. By lumping these ambiguous taxes together, wereduce the ambiguity of the other income categories.THE PRODUCTION APPROACH TO GDPOnce again, this gives you another chance to emphasize theimportance of counting everything exactly once. In the pro-duction method, you have only two choices:1. Either only measurefinal goods and services, or2. Only measure thevalue added at each stage of pro-ductionas a good moves from firm to firm to finalpurchaser.Why bother with (2)? For an economist (or businessperson)trying to figure out which industries are most productive, itis useful to know which industries add the most value totheir inputs. In Chad’s example, you could use the value-added method to answer the question, “Where does most ofa car’s value come from—the raw materials or the assemblyof those materials?” In the diamond jewelry industry, theanswer might be quite different (if the “raw” material is cutdiamonds).I often emphasize that when measuring the size of a localeconomy, common sense and economic sense are likely toconflict. Common sense says, “Measure the size of the localeconomy by adding up the sales of all the local businesses.”But that would include massive double counting—just thinkof all the products that are sold from one local business tothe next before they reach their final user (farm products are

Page 12

Macroeconomics, Third Edition Solution Manual - Page 12 preview image

Loading page image...

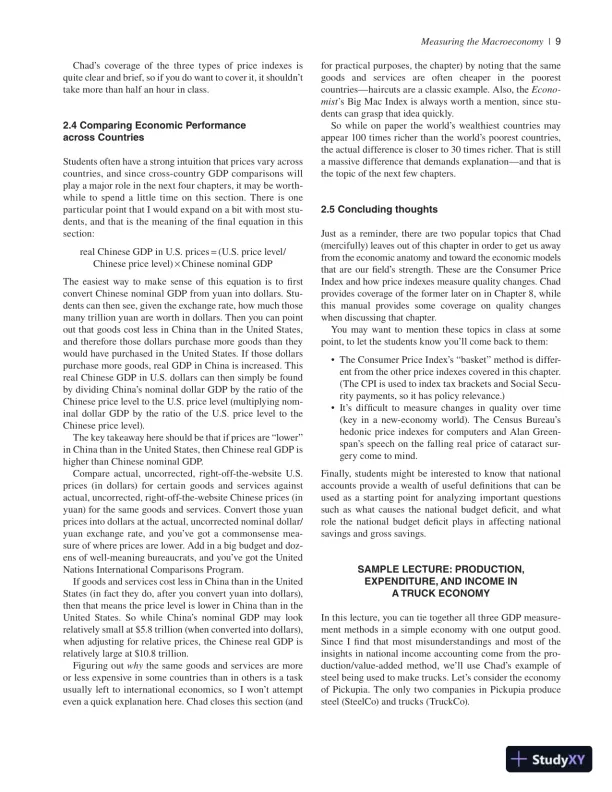
Mea sur ing the Macroeconomy|9for practical purposes, the chapter) by noting that the samegoodsandservicesareoftencheaperinthepoorestcountries—haircuts are a classic example. Also, theEcono-mist’s Big Mac Index is always worth a mention, since stu-dents can grasp that idea quickly.So while on paper the world’s wealthiest countries mayappear 100 times richer than the world’s poorest countries,the actual difference is closer to 30 times richer. That is stilla massive difference that demands explanation—and that isthe topic of the next few chapters.2.5 Concluding thoughtsJust as a reminder, there are two popular topics that Chad(mercifully) leaves out of this chapter in order to get us awayfrom the economic anatomy and toward the economic modelsthat are our field’s strength. These are the Consumer PriceIndex and how price indexes measure quality changes. Chadprovides coverage of the former later on in Chapter 8, whilethis manual provides some coverage on quality changeswhen discussing that chapter.You may want to mention these topics in class at somepoint, to let the students know you’ll come back to them:• The Consumer Price Index’s “basket” method is differ-ent from the other price indexes covered in this chapter.(The CPI is used to index tax brackets and Social Secu-rity payments, so it has policy relevance.)• It’s difficult to measure changes in quality over time(key in a new-economy world). The Census Bureau’shedonic price indexes for computers and Alan Green-span’s speech on the falling real price of cataract sur-gery come to mind.Finally, students might be interested to know that nationalaccounts provide a wealth of useful definitions that can beused as a starting point for analyzing important questionssuch as what causes the national budget deficit, and whatrole the national budget deficit plays in affecting nationalsavings and gross savings.SAMPLE LECTURE: PRODUCTION,EXPENDITURE, AND INCOME INA TRUCK ECONOMYIn this lecture, you can tie together all three GDP measure-ment methods in a simple economy with one output good.Since I find that most misunderstandings and most of theinsights in national income accounting come from the pro-duction/value-added method, we’ll use Chad’s example ofsteel being used to make trucks. Let’s consider the economyof Pickupia. The only two companies in Pickupia producesteel (SteelCo) and trucks (TruckCo).Chad’s coverage of the three types of price indexes isquite clear and brief, so if you do want to cover it, it shouldn’ttake more than half an hour in class.2.4 Comparing Economic Performanceacross CountriesStudents often have a strong intuition that prices vary acrosscountries, and since cross-country GDP comparisons willplay a major role in the next four chapters, it may be worth-while to spend a little time on this section. There is oneparticular point that I would expand on a bit with most stu-dents, and that is the meaning of the final equation in thissection:real Chinese GDP in U.S. prices=(U.S. price level/Chinese price level)×Chinese nominal GDPThe easiest way to make sense of this equation is to firstconvert Chinese nominal GDP from yuan into dollars. Stu-dents can then see, given the exchange rate, how much thosemany trillion yuan are worth in dollars. Then you can pointout that goods cost less in China than in the United States,and therefore those dollars purchase more goods than theywould have purchased in the United States. If those dollarspurchase more goods, real GDP in China is increased. Thisreal Chinese GDP in U.S. dollars can then simply be foundby dividing China’s nominal dollar GDP by the ratio of theChinese price level to the U.S. price level (multiplying nom-inal dollar GDP by the ratio of the U.S. price level to theChinese price level).The key takeaway here should be that if prices are “lower”in China than in the United States, then Chinese real GDP ishigher than Chinese nominal GDP.Compare actual, uncorrected, right-off-the-website U.S.prices (in dollars) for certain goods and services againstactual, uncorrected, right-off-the-website Chinese prices (inyuan) for the same goods and services. Convert those yuanprices into dollars at the actual, uncorrected nominal dollar/yuan exchange rate, and you’ve got a commonsense mea-sure of where prices are lower. Add in a big bud get and doz-ens of well-meaning bureaucrats, and you’ve got the UnitedNations International Comparisons Program.If goods and services cost less in China than in the UnitedStates (in fact they do, after you convert yuan into dollars),then that means the price level is lower in China than in theUnited States. So while China’s nominal GDP may lookrelatively small at $5.8 trillion (when converted into dollars),when adjusting for relative prices, the Chinese real GDP isrelatively large at $10.8 trillion.Figuring outwhythe same goods and services are moreor less expensive in some countries than in others is a taskusually left to international economics, so I won’t attempteven a quick explanation here. Chad closes this section (and

Page 13

Macroeconomics, Third Edition Solution Manual - Page 13 preview image

Loading page image...

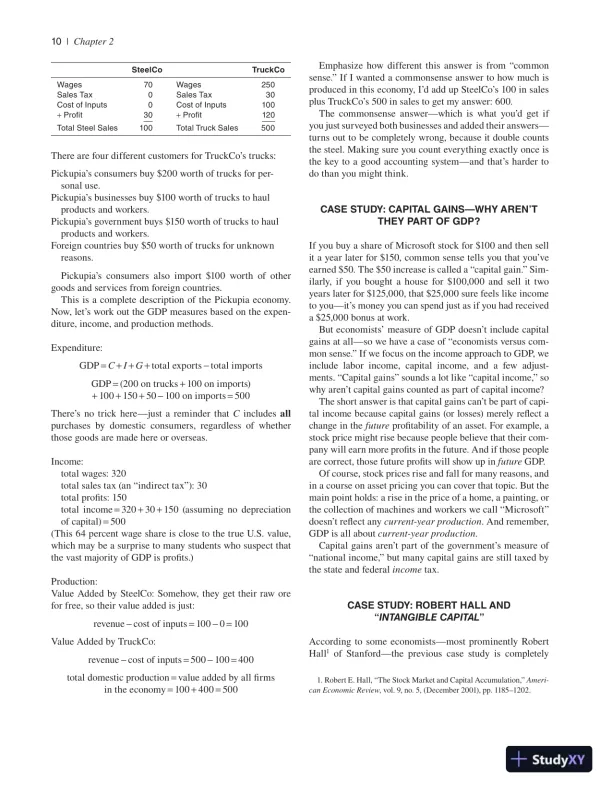
10|Chapter 2Emphasize how different this answer is from “commonsense.” If I wanted a commonsense answer to how much isproduced in this economy, I’d add up SteelCo’s 100 in salesplus TruckCo’s 500 in sales to get my answer: 600.The commonsense answer—which is what you’d get ifyou just surveyed both businesses and added their answers—turns out to be completely wrong, because it double countsthe steel. Making sure you count everything exactly once isthe key to a good accounting system—and that’s harder todo than you might think.CASE STUDY: CAPITAL GAINS—WHY AREN’TTHEY PART OF GDP?If you buy a share of Microsoft stock for $100 and then sellit a year later for $150, common sense tells you that you’veearned $50. The $50 increase is called a “capital gain.” Sim-ilarly, if you bought a house for $100,000 and sell it twoyears later for $125,000, that $25,000 sure feels like incometo you—it’s money you can spend just as if you had receiveda $25,000 bonus at work.But economists’ measure of GDP doesn’t include capitalgains at all—so we have a case of “economists versus com-mon sense.” If we focus on the income approach to GDP, weinclude labor income, capital income, and a few adjust-ments. “Capital gains” sounds a lot like “capital income,” sowhy aren’t capital gains counted as part of capital income?The short answer is that capital gains can’t be part of capi-tal income because capital gains (or losses) merely reflect achange in thefutureprofitability of an asset. For example, astock price might rise because people believe that their com-pany will earn more profits in the future. And if those peopleare correct, those future profits will show up infutureGDP.Of course, stock prices rise and fall for many reasons, andin a course on asset pricing you can cover that topic. But themain point holds: a rise in the price of a home, a painting, orthe collection of machines and workers we call “Microsoft”doesn’t reflect anycurrent-year production. And remember,GDP is all aboutcurrent-year production.Capital gains aren’t part of the government’s measure of“national income,” but many capital gains are still taxed bythe state and federalincometax.CASE STUDY: ROBERT HALL ANDINTANGIBLE CAPITALAccording to some economists—most prominently RobertHall1of Stanford—the previous case study is completely1. Robert E. Hall, “The Stock Market and Capital Accumulation,”Ameri-can Economic Review, vol. 9, no. 5, (December 2001), pp. 1185–1202.SteelCoTruckCoWages70Wages250Sales Tax0Sales Tax30Cost of Inputs0Cost of Inputs100+Profit30+Profit120Total Steel Sales100Total Truck Sales500There are four different customers for TruckCo’s trucks:Pickupia’s consumers buy $200 worth of trucks for per-sonal use.Pickupia’s businesses buy $100 worth of trucks to haulproducts and workers.Pickupia’s government buys $150 worth of trucks to haulproducts and workers.Foreign countries buy $50 worth of trucks for unknownreasons.Pickupia’s consumers also import $100 worth of othergoods and services from foreign countries.This is a complete description of the Pickupia economy.Now, let’s work out the GDP measures based on the expen-diture, income, and production methods.Expenditure:GDP=C+I+G+total exportstotal importsGDP=(200 on trucks+100 on imports)+100+150+50100 on imports=500There’s no trick here—just a reminder thatCincludesallpurchases by domestic consumers, regardless of whetherthose goods are made here or overseas.Income:total wages: 320total sales tax (an “indirect tax”): 30total profits: 150total income=320+30+150 (assuming no depreciationof capital)=500(This 64 percent wage share is close to the true U.S. value,which may be a surprise to many students who suspect thatthe vast majority of GDP is profits.)Production:Value Added by SteelCo: Somehow, they get their raw orefor free, so their value added is just:revenuecost of inputs=1000=100Value Added by TruckCo:revenuecost of inputs=500100=400total domestic production=value added by all firmsin the economy=100+400=500

Page 14

Macroeconomics, Third Edition Solution Manual - Page 14 preview image

Loading page image...

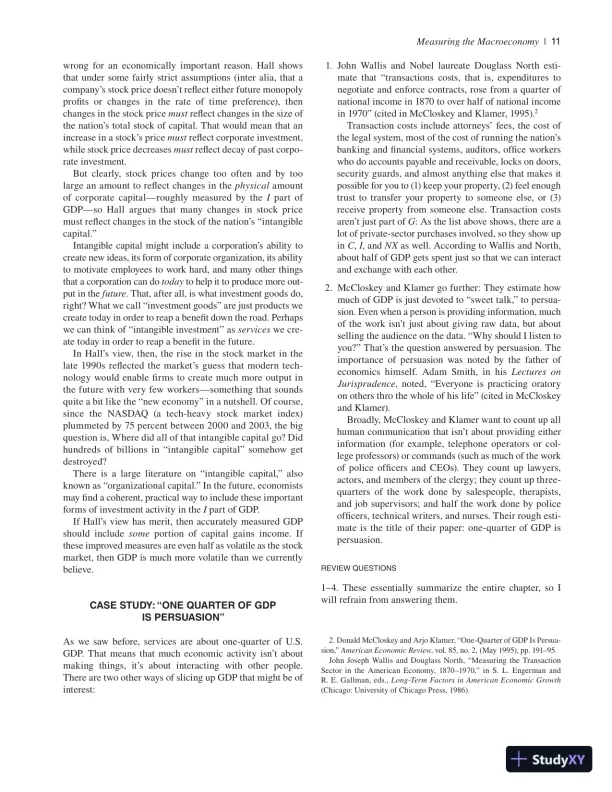
Mea sur ing the Macroeconomy|111. John Wallis and Nobel laureate Douglass North esti-mate that “transactions costs, that is, expenditures tonegotiate and enforce contracts, rose from a quarter ofnational income in 1870 to over half of national incomein 1970” (cited in McCloskey and Klamer, 1995).2Transaction costs include attorneys’ fees, the cost ofthe legal system, most of the cost of running the nation’sbanking and financial systems, auditors, office workerswho do accounts payable and receivable, locks on doors,security guards, and almost anything else that makes itpossible for you to (1) keep your property, (2) feel enoughtrust to transfer your property to someone else, or (3)receive property from someone else. Transaction costsaren’t just part ofG: As the list above shows, there are alot of private-sector purchases involved, so they show upinC,I, andNXas well. According to Wallis and North,about half of GDP gets spent just so that we can interactand exchange with each other.2. McCloskey and Klamer go further: They estimate howmuch of GDP is just devoted to “sweet talk,” to persua-sion. Even when a person is providing information, muchof the work isn’t just about giving raw data, but aboutselling the audience on the data. “Why should I listen toyou?” That’s the question answered by persuasion. Theimportance of persuasion was noted by the father ofeconomics himself. Adam Smith, in hisLectures onJurisprudence, noted, “Everyone is practicing oratoryon others thro the whole of his life” (cited in McCloskeyand Klamer).Broadly, McCloskey and Klamer want to count up allhuman communication that isn’t about providing eitherinformation (for example, telephone operators or col-lege professors) or commands (such as much of the workof police officers and CEOs). They count up lawyers,actors, and members of the clergy; they count up three-quarters of the work done by salespeople, therapists,and job supervisors; and half the work done by policeofficers, technical writers, and nurses. Their rough esti-mate is the title of their paper: one-quarter of GDP ispersuasion.REVIEW QUESTIONS1–4. These essentially summarize the entire chapter, so Iwill refrain from answering them.2. Donald McCloskey and Arjo Klamer, “One-Quarter of GDP Is Persua-sion,”American Economic Review, vol. 85, no. 2, (May 1995), pp. 191–95.John Joseph Wallis and Douglass North, “Measuring the TransactionSector in the American Economy, 1870–1970,” in S. L. Engerman andR. E. Gallman, eds.,Long-Term Factors in American Economic Growth(Chicago: University of Chicago Press, 1986).wrong for an economically important reason. Hall showsthat under some fairly strict assumptions (inter alia, that acompany’s stock price doesn’t reflect either future monopolyprofits or changes in the rate of time preference), thenchanges in the stock pricemustreflect changes in the size ofthe nation’s total stock of capital. That would mean that anincrease in a stock’s pricemustreflect corporate investment,while stock price decreasesmustreflect decay of past corpo-rate investment.But clearly, stock prices change too often and by toolarge an amount to reflect changes in thephysicalamountof corporate capital—roughly measured by theIpart ofGDP—so Hall argues that many changes in stock pricemust reflect changes in the stock of the nation’s “intangiblecapital.”Intangible capital might include a corporation’s ability tocreate new ideas, its form of corporate organization, its abilityto motivate employees to work hard, and many other thingsthat a corporation can dotodayto help it to produce more out-put in thefuture. That, after all, is what investment goods do,right? What we call “investment goods” are just products wecreate today in order to reap a benefit down the road. Perhapswe can think of “intangible investment” asserviceswe cre-ate today in order to reap a benefit in the future.In Hall’s view, then, the rise in the stock market in thelate 1990s reflected the market’s guess that modern tech-nology would enable firms to create much more output inthe future with very few workers—something that soundsquite a bit like the “new economy” in a nutshell. Of course,since the NASDAQ (a tech-heavy stock market index)plummeted by 75 percent between 2000 and 2003, the bigquestion is, Where did all of that intangible capital go? Didhundreds of billions in “intangible capital” somehow getdestroyed?There is a large literature on “intangible capital,” alsoknown as “organizational capital.” In the future, economistsmay find a coherent, practical way to include these importantforms of investment activity in theIpart of GDP.If Hall’s view has merit, then accurately measured GDPshould includesomeportion of capital gains income. Ifthese improved measures are even half as volatile as the stockmarket, then GDP is much more volatile than we currentlybelieve.CASE STUDY: “ONE QUARTER OF GDPIS PERSUASION”As we saw before, services are about one-quarter of U.S.GDP. That means that much economic activity isn’t aboutmaking things, it’s about interacting with other people.There are two other ways of slicing up GDP that might be ofinterest:

Page 15

Macroeconomics, Third Edition Solution Manual - Page 15 preview image

Loading page image...

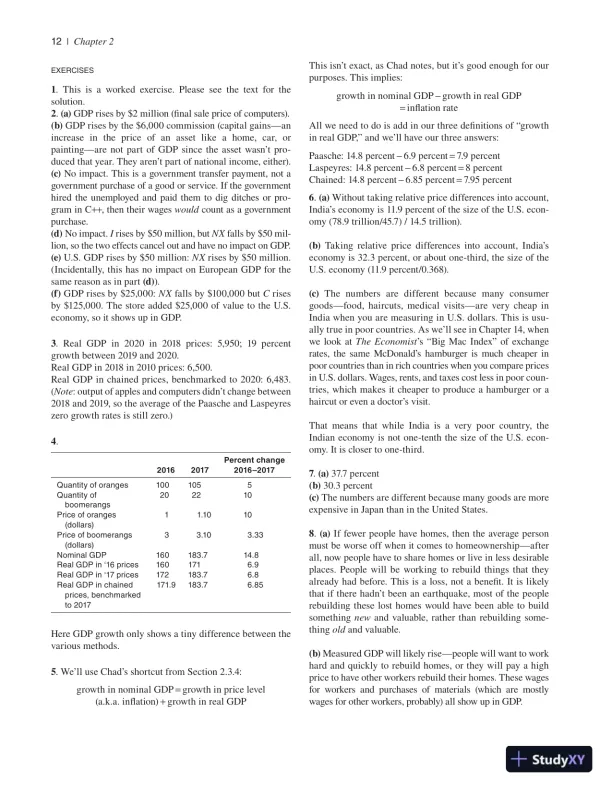
12|Chapter 2This isn’t exact, as Chad notes, but it’s good enough for ourpurposes. This implies:growth in nominal GDPgrowth in real GDP=inflation rateAll we need to do is add in our three definitions of “growthin real GDP,” and we’ll have our three answers:Paasche: 14.8 percent6.9 percent=7.9 percentLaspeyres: 14.8 percent6.8 percent=8 percentChained: 14.8 percent6.85 percent=7.95 percent6.(a)Without taking relative price differences into account,India’s economy is 11.9 percent of the size of the U.S. econ-omy (78.9 trillion/45.7) / 14.5 trillion).(b)Taking relative price differences into account, India’seconomy is 32.3 percent, or about one-third, the size of theU.S. economy (11.9 percent/0.368).(c)The numbers are different because many consumergoods—food, haircuts, medical visits—are very cheap inIndia when you are measuring in U.S. dollars. This is usu-ally true in poor countries. As we’ll see in Chapter 14, whenwe look atThe Economist’s “Big Mac Index” of exchangerates, the same McDonald’s hamburger is much cheaper inpoor countries than in rich countries when you compare pricesin U.S. dollars. Wages, rents, and taxes cost less in poor coun-tries, which makes it cheaper to produce a hamburger or ahaircut or even a doctor’s visit.That means that while India is a very poor country, theIndian economy is not one-tenth the size of the U.S. econ-omy. It is closer to one-third.7.(a)37.7 percent(b)30.3 percent(c)The numbers are different because many goods are moreexpensive in Japan than in the United States.8.(a)If fewer people have homes, then the average personmust be worse off when it comes to homeownership—afterall, now people have to share homes or live in less desirableplaces. People will be working to rebuild things that theyalready had before. This is a loss, not a benefit. It is likelythat if there hadn’t been an earthquake, most of the peoplerebuilding these lost homes would have been able to buildsomethingnewand valuable, rather than rebuilding some-thingoldand valuable.(b)Measured GDP will likely rise—people will want to workhard and quickly to rebuild homes, or they will pay a highprice to have other workers rebuild their homes. These wagesfor workers and purchases of materials (which are mostlywages for other workers, probably) all show up in GDP.EXERCISES1. This is a worked exercise. Please see the text for thesolution.2.(a)GDP rises by $2 million (final sale price of computers).(b)GDP rises by the $6,000 commission (capital gains—anincrease in the price of an asset like a home, car, orpainting—are not part of GDP since the asset wasn’t pro-duced that year. They aren’t part of national income, either).(c)No impact. This is a government transfer payment, not agovernment purchase of a good or service. If the governmenthired the unemployed and paid them to dig ditches or pro-gram in C++, then their wageswouldcount as a governmentpurchase.(d)No impact.Irises by $50 million, butNXfalls by $50 mil-lion, so the two effects cancel out and have no impact on GDP.(e)U.S. GDP rises by $50 million:NXrises by $50 million.(Incidentally, this has no impact on European GDP for thesame reason as in part(d)).(f)GDP rises by $25,000:NXfalls by $100,000 butCrisesby $125,000. The store added $25,000 of value to the U.S.economy, so it shows up in GDP.3. Real GDP in 2020 in 2018 prices: 5,950; 19 percentgrowth between 2019 and 2020.Real GDP in 2018 in 2010 prices: 6,500.Real GDP in chained prices, benchmarked to 2020: 6,483.(Note: output of apples and computers didn’t change between2018 and 2019, so the average of the Paasche and Laspeyreszero growth rates is still zero.)4.20162017Percent change2016–2017Quantity of oranges1001055Quantity ofboomerangs202210Price of oranges(dollars)11.1010Price of boomerangs(dollars)33.103.33Nominal GDP160183.714.8Real GDP in ‘16 prices1601716.9Real GDP in ‘17 prices172183.76.8Real GDP in chainedprices, benchmarkedto 2017171.9183.76.85Here GDP growth only shows a tiny difference between thevarious methods.5. We’ll use Chad’s shortcut from Section 2.3.4:growth in nominal GDP=growth in price level(a.k.a. inflation)+growth in real GDP

Page 16

Macroeconomics, Third Edition Solution Manual - Page 16 preview image

Loading page image...

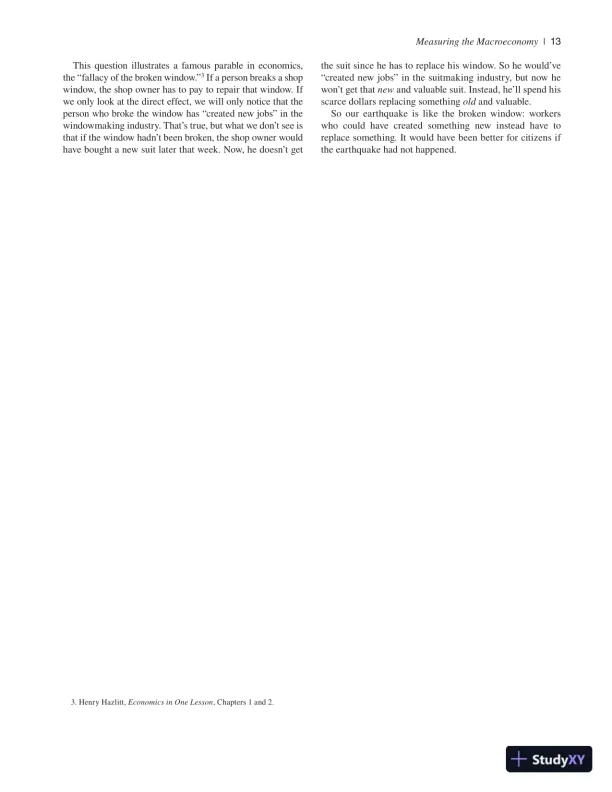
Mea sur ing the Macroeconomy|13the suit since he has to replace his window. So he would’ve“created new jobs” in the suitmaking industry, but now hewon’t get thatnewand valuable suit. Instead, he’ll spend hisscarce dollars replacing somethingoldand valuable.So our earthquake is like the broken window: workerswho could have created something new instead have toreplace something. It would have been better for citizens ifthe earthquake had not happened.This question illustrates a famous parable in economics,the “fallacy of the broken window.”3If a person breaks a shopwindow, the shop owner has to pay to repair that window. Ifwe only look at the direct effect, we will only notice that theperson who broke the window has “created new jobs” in thewindowmaking industry. That’s true, but what we don’t see isthat if the window hadn’t been broken, the shop owner wouldhave bought a new suit later that week. Now, he doesn’t get3. Henry Hazlitt,Economics in One Lesson, Chapters 1 and 2.
Preview Mode

This document has 154 pages. Sign in to access the full document!

Study Now!

XY-Copilot AI
Unlimited Access
Secure Payment
Instant Access
24/7 Support
Document Chat

Document Details

Subject
Economics

Related Documents

View all