Microeconomics: Theory with Applications 8th Edition Solution Manual

Microeconomics: Theory with Applications 8th Edition Solution Manual makes textbook problem-solving easy with a comprehensive guide that explains every step.

Joseph Wilson
Contributor
5.0
49
5 months ago
Preview (16 of 200 Pages)
100%
Purchase to unlock

Page 1

Microeconomics: Theory with Applications 8th Edition Solution Manual - Page 1 preview image

Loading page image...

SOLUTIONSMANUALDouglas W. AllenSimon Fraser UniversityMicroeconomicsTheory with ApplicationsEighthEditionB. Curtis EatonUniversity ofCalgaryDiane F. EatonDouglas W. AllenSimon Fraser University

Page 2

Microeconomics: Theory with Applications 8th Edition Solution Manual - Page 2 preview image

Loading page image...

Page 3

Microeconomics: Theory with Applications 8th Edition Solution Manual - Page 3 preview image

Loading page image...

Microeconomics: Theory with ApplicationsiiContentsPrefaceiiiLecture Suggestions1Classroom Experiments26Solutions68

Page 4

Microeconomics: Theory with Applications 8th Edition Solution Manual - Page 4 preview image

Loading page image...

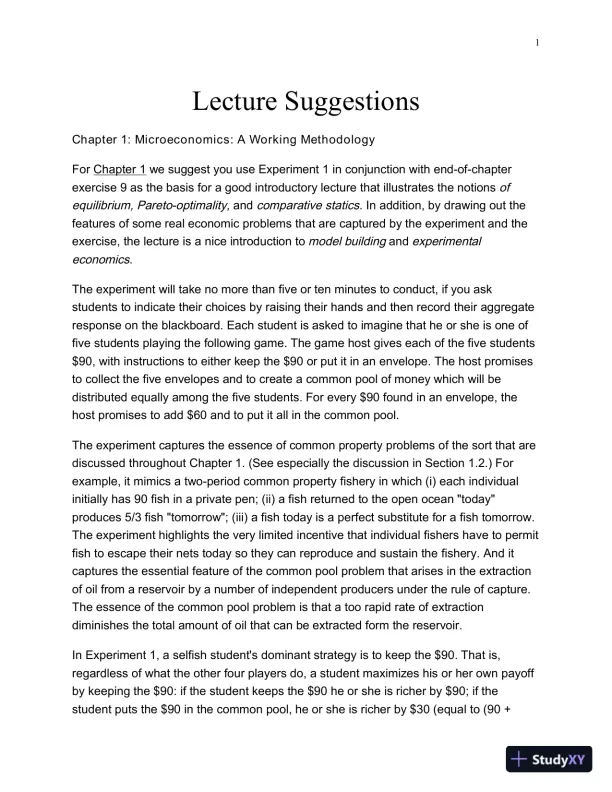
1Lecture SuggestionsChapter1: Microeconomics: A Working MethodologyForChapter 1we suggestyouuseExperiment 1in conjunction with end-of-chapterexercise 9 as the basis for a good introductory lecture that illustrates the notionsofequilibrium, Pareto-optimality,andcomparative statics.In addition, by drawing out thefeatures of some real economic problems that are captured by the experiment and theexercise, the lecture is a nice introduction tomodel buildingandexperimentaleconomics.The experiment will take no more than five or ten minutes to conduct, if you askstudents to indicate their choices by raising their hands and then record their aggregateresponse on the blackboard. Each student is asked to imagine that he or she is one offive students playing the following game. The game host gives each of the five students$90, with instructions to either keep the $90 or put it in an envelope. The host promisesto collect the five envelopes and to create a common pool of money which will bedistributed equally among the five students. For every $90 found in an envelope, thehost promises to add $60 and to put it all in the common pool.The experiment captures the essence of common property problems of the sort that arediscussed throughout Chapter1. (See especially the discussion in Section 1.2.) Forexample, it mimics a two-period common property fishery in which (i) each individualinitially has 90 fish in a private pen; (ii) a fish returned to the open ocean "today"produces 5/3 fish "tomorrow";(iii) a fish today is a perfect substitute for a fish tomorrow.The experiment highlights the very limited incentive that individual fishers have to permitfish to escape their nets today so they can reproduce and sustain the fishery. And itcaptures theessential feature of the common pool problem that arises in the extractionof oil from a reservoir by a number of independent producers under the rule of capture.The essence of the common pool problem is that a too rapid rate of extractiondiminishes thetotal amount of oil that can be extracted form the reservoir.In Experiment 1, a selfish student's dominant strategy is to keep the $90. That is,regardless of what the other four players do, a student maximizes his or her own payoffby keeping the $90: ifthe student keeps the $90 he or she is richer by $90; if thestudent puts the $90 in the common pool, he or she is richer by $30 (equal to (90 +

Page 5

Microeconomics: Theory with Applications 8th Edition Solution Manual - Page 5 preview image

Loading page image...

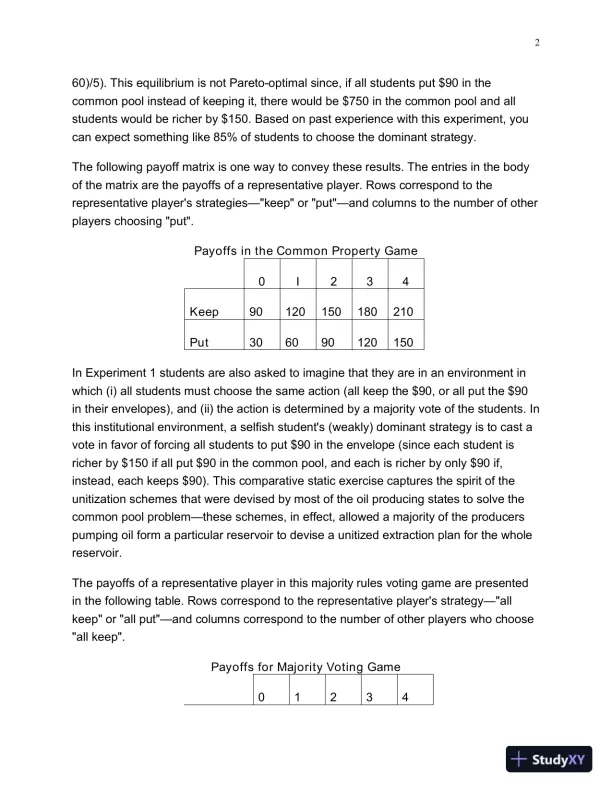
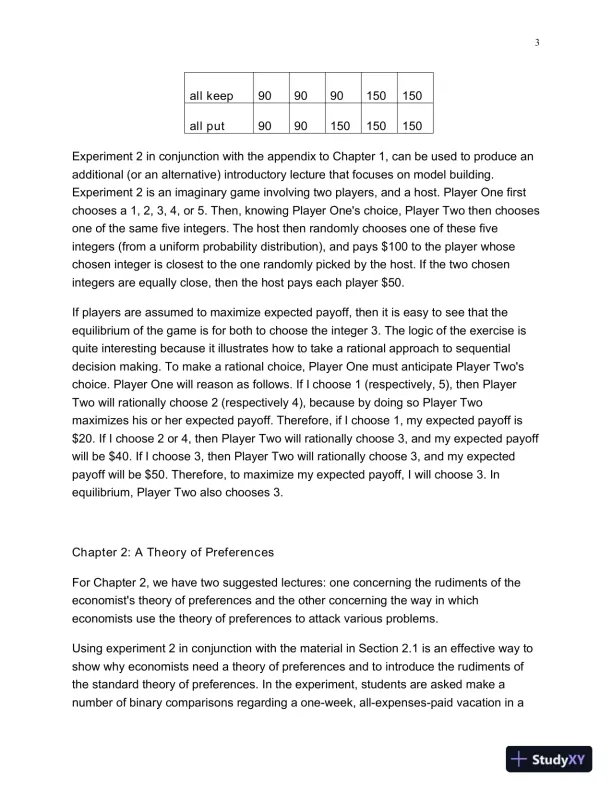
260)/5). This equilibrium is not Pareto-optimal since, if all students put $90 in thecommon pool instead of keeping it, there would be $750 in the common pool and allstudents would be richer by $150. Based on past experience with this experiment, youcan expect something like 85% of students to choose the dominant strategy.The following payoff matrix is one wayto convey these results. The entries in the bodyof the matrix are the payoffs of a representative player. Rows correspond to therepresentative player's strategies"keep" or "put"and columns to the number of otherplayers choosing "put".Payoffs in the Common Property Game0I234Keep90120150180210Put306090120150In Experiment 1 students are also asked to imagine that they are in an environment inwhich (i) all students must choose the same action (all keep the $90, or all put the $90intheir envelopes), and (ii) the action is determined by a majority vote of the students. Inthis institutional environment, a selfish student's (weakly) dominant strategy is to cast avote in favor of forcing all students to put $90 in the envelope (sinceeach student isricher by $150 if all put $90 in the common pool, and each is richer by only $90 if,instead, each keeps $90). This comparative static exercise captures the spirit of theunitization schemes that were devised by most of the oil producing states to solve thecommon pool problemthese schemes, in effect, allowed a majority of the producerspumping oil form a particular reservoir to devise a unitized extraction plan for the wholereservoir.The payoffs of a representative player in this majority rules voting game are presentedin the following table. Rows correspond to the representative player's strategy"allkeep" or "all put"and columns correspond to the number of other players who choose"all keep".Payoffs for Majority Voting Game01234

Page 6

Microeconomics: Theory with Applications 8th Edition Solution Manual - Page 6 preview image

Loading page image...

3all keep909090150150all put9090150150150Experiment 2 in conjunction with the appendix to Chapter 1, can be used to produce anadditional (or an alternative) introductory lecture that focuses on model building.Experiment 2 is an imaginarygame involving two players, and a host. Player One firstchooses a 1, 2, 3, 4, or 5. Then, knowing Player One's choice, Player Two then choosesone of the same five integers. The host then randomly chooses one of these fiveintegers (from a uniform probability distribution), and pays $100 to the player whosechosen integer is closest to the one randomly picked by the host. If the two chosenintegers are equally close, then the host pays each player $50.If players are assumed to maximize expected payoff, then it is easy to see that theequilibrium of the game is for both to choose the integer 3. The logic of the exercise isquite interesting because it illustrates how to take a rational approach to sequentialdecision making. To make a rational choice, Player One must anticipate Player Two'schoice. Player One will reason as follows. If I choose 1 (respectively, 5), then PlayerTwo will rationally choose 2 (respectively 4), because by doing so Player Twomaximizes his or her expected payoff. Therefore, if Ichoose 1, my expected payoff is$20. If I choose 2 or 4, then Player Two will rationally choose 3, and my expected payoffwill be $40. If I choose 3, then Player Two will rationally choose 3, and my expectedpayoff will be $50. Therefore, to maximize my expected payoff, I will choose 3. Inequilibrium, Player Two also chooses 3.Chapter 2: A Theory of PreferencesFor Chapter 2, we have two suggested lectures: one concerning the rudiments of theeconomist's theory of preferences and the other concerning theway in whicheconomists use the theory of preferences to attack various problems.Using experiment2in conjunction with the material in Section 2.1 is an effective way toshow why economists need a theory of preferences and to introduce the rudiments ofthe standard theory of preferences. In the experiment, students are asked make anumber of binary comparisons regarding a one-week, all-expenses-paid vacation in a

Page 7

Microeconomics: Theory with Applications 8th Edition Solution Manual - Page 7 preview image

Loading page image...

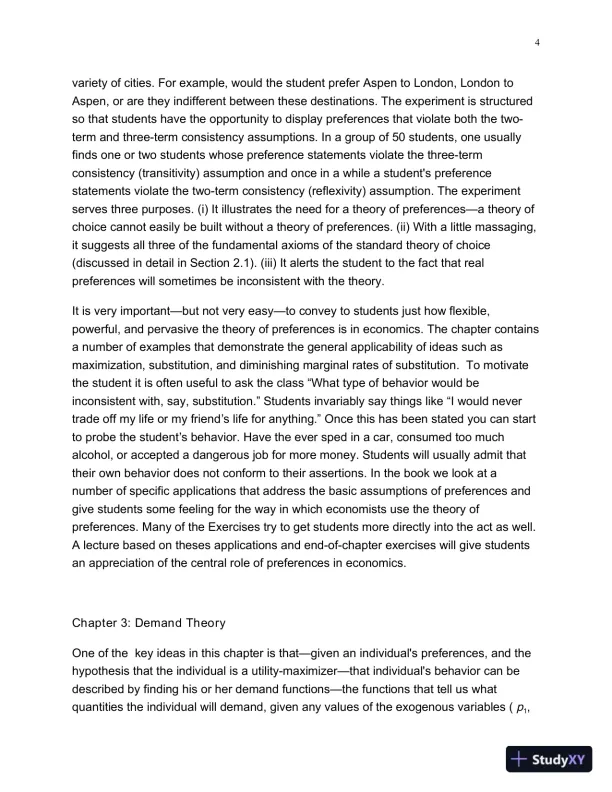
4variety of cities. For example, would the student prefer Aspen to London, London toAspen, or are they indifferent between these destinations. The experiment is structuredso that students have the opportunity to display preferences that violate both the two-term and three-term consistency assumptions. In a group of 50 students, one usuallyfindsone or two students whose preference statements violate the three-termconsistency (transitivity) assumption and once in a while a student's preferencestatements violate the two-term consistency (reflexivity) assumption. The experimentserves three purposes. (i) It illustrates the need for a theory of preferencesa theory ofchoice cannot easily be built without a theory of preferences. (ii) With a little massaging,it suggests all three of the fundamental axioms of the standard theory of choice(discussed in detail in Section 2.1). (iii) It alerts the student to the fact that realpreferences will sometimes be inconsistent with the theory.It is very importantbut not very easyto convey to students just how flexible,powerful, and pervasive the theory ofpreferences is in economics. The chapter containsa number of examples that demonstrate the general applicability of ideas such asmaximization, substitution, and diminishing marginal rates of substitution. To motivatethe student it is often useful to ask the class “What type of behavior would beinconsistent with, say, substitution.” Students invariably say things like “I would nevertrade off my life or my friends life for anything.” Once this has been stated you can startto probe the students behavior. Have the ever sped in a car, consumed too muchalcohol, or accepted a dangerous job for more money. Students will usually admit thattheir own behavior does not conformtotheir assertions.In the book we look at anumber of specificapplications thataddress thebasicassumptions of preferences andgive students some feeling for the way in which economists use the theory ofpreferences. Many of the Exercises try to get students more directly into the act as well.A lecture based on theses applicationsand end-of-chapter exercises will give studentsan appreciation of the central role of preferences in economics.Chapter 3: Demand TheoryOne of the key ideas in this chapter is thatgiven an individual's preferences, and thehypothesis that the individual is a utility-maximizerthat individual's behavior can bedescribed by finding his or her demand functionsthe functions that tell us whatquantities the individual will demand, given any values of the exogenous variables (p1,

Page 8

Microeconomics: Theory with Applications 8th Edition Solution Manual - Page 8 preview image

Loading page image...

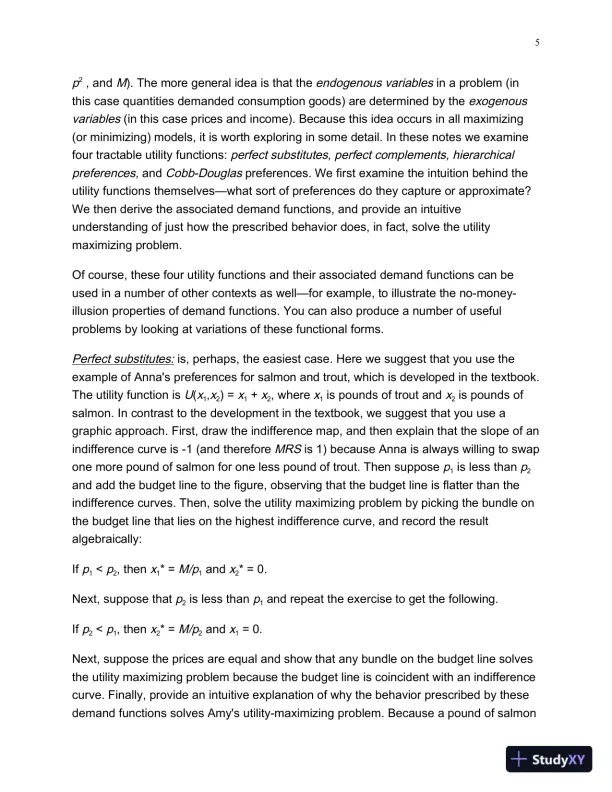
5p2,andM). The more general idea is that theendogenous variablesin a problem (inthis case quantities demanded consumption goods) are determined by theexogenousvariables(in this case prices and income). Because this idea occurs in all maximizing(or minimizing) models, it is worth exploring in some detail. In these notes we examinefour tractable utility functions:perfect substitutes, perfect complements, hierarchicalpreferences,andCobb-Douglaspreferences. We first examine the intuition behind theutility functions themselveswhat sort of preferences do they capture or approximate?We then derive the associated demand functions, and provide an intuitiveunderstanding of just how the prescribed behavior does, in fact, solve the utilitymaximizing problem.Of course, thesefour utility functions and their associated demand functions can beused in a number of other contexts as wellfor example, to illustrate the no-money-illusion properties of demand functions. You can also produce a number of usefulproblems by looking atvariations of these functional forms.Perfect substitutes:is, perhaps, the easiest case. Here we suggest that you use theexample of Anna's preferences for salmon and trout, which is developed in the textbook.The utility function isU(x1,x2) =x1+x2, wherex1is pounds of trout andx2is pounds ofsalmon. In contrast to the development in the textbook, we suggest that you use agraphic approach. First, draw the indifference map, and then explain that the slope of anindifference curve is-1 (and thereforeMRSis 1) because Anna is always willing to swapone more pound of salmon for one less pound of trout. Then supposep1is less thanp2and add the budget line to the figure, observing that the budget line is flatter than theindifference curves. Then, solve the utility maximizing problem by picking the bundle onthe budget line that lies on the highest indifference curve, and record the resultalgebraically:Ifp1<p2, thenx1* =M/p1andx2* = 0.Next, suppose thatp2is less thanp1and repeat the exercise to get the following.Ifp2<p1, thenx2* =M/p2andx1= 0.Next, suppose the prices are equal and show that any bundle on the budget line solvesthe utility maximizing problem because the budget line is coincident with an indifferencecurve. Finally, provide an intuitive explanation of why the behavior prescribed by thesedemand functions solves Amy's utility-maximizing problem. Because a pound of salmon

Page 9

Microeconomics: Theory with Applications 8th Edition Solution Manual - Page 9 preview image

Loading page image...

6is a perfect substitute for a pound of trout, Amy spends all of her budget for fish on (1)trout, if trout is cheaper than salmon, and (2) salmon, if salmon is cheaper than trout.You may want to provide more examples of cases in which this formulation ofpreferences is appropriate. For example, the fact that some undergraduates always buythe cheapest available brand of beer is consistent with this case of perfect substitutes.Perfect complements:is perhaps the next-easiest case. In-chapter Problem 3.4examines this case. We suggest that you interpretx1andx2as the number of right andleft shoes, and explain why this mathematical formulation is a sensible description ofpreferences for right and left shoes. Again we suggest that you solve the problemgraphically by first drawing a number of indifference curves and then drawing the budgetline. Then write out the algebraic description of the solution, and give an intuitiveexplanation of why the prescribed behavior solves the utility maximizing problem.Finally, you might want to observe that this simple theory answers the question: Whyare shoes sold in pairs? Alternatively, why are the two resins used to make epoxy gluepackaged together and sold as one unit?Hierarchical preferences:provide the third, but more difficult case:U(F,T) isFifF100and isTifF> 100, whereFis pounds of food andTis yards of textiles. It is first usefulto give an intuitive explanation of these preferences in terms of a hierarchy of needs.Here, too, we suggest that you develop a graphic solution. First, draw the indifferencemap. Then assume that 100pF>M(the person does not have enough money to buy100 pounds of food), draw the budget line, and solve the utility-maximizing problemgraphically. It is worthwhile to observe what happens to the solution aspTchanges(nothing), asMdecreases orpFincreases (the person continues to spend all his or herincome if food.. Next, record the result algebraically:If 100pF>M, thenF* =M/pFandT* = O.Next, assume that 100pFM, and construct the appropriate graphic solution. LetpForpTdecrease, orMincrease and observe that consumption of food does not change,while consumption of textiles increases. Record results algebraically:If 100pFM, thenF* = 100 andT* = (M-lOOpF)/pF.Finally, provide an intuitive explanation of why this behavior solves the utility maximizingproblem.

Page 10

Microeconomics: Theory with Applications 8th Edition Solution Manual - Page 10 preview image

Loading page image...

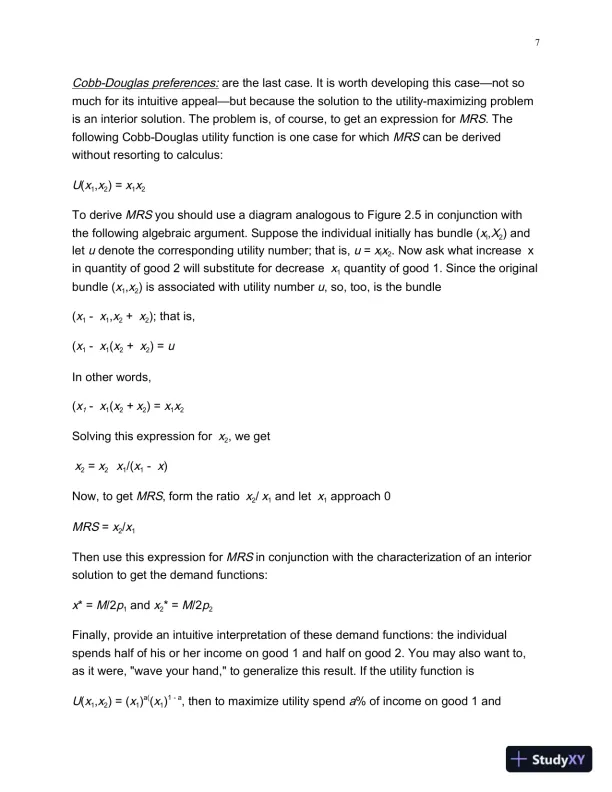
7Cobb-Douglas preferences:are the last case. It is worth developing this casenot somuch for its intuitive appealbut because the solution to the utility-maximizing problemis an interior solution. The problem is, of course, to getan expression forMRS. Thefollowing Cobb-Douglas utility function is one case for whichMRScan be derivedwithout resorting to calculus:U(x1,x2) =x1x2To deriveMRSyou should use a diagram analogous to Figure 2.5 in conjunction withthe following algebraic argument. Suppose the individual initially has bundle (xl,X2) andletudenote the corresponding utility number; that is,u=xlx2. Now ask what increasexin quantity of good 2 will substitute for decreasex1quantity of good 1. Since the originalbundle (x1,x2) is associated with utility numberu, so, too, is the bundle(x1-x1,x2+x2); that is,(x1-x1(x2+x2) =uIn other words,(x1-x1(x2+x2) =x1x2Solving this expression forx2, we getx2=x2x1/(x1-x)Now, to getMRS, form the ratiox2/x1and letx1approach 0MRS=x2/x1Then use this expression forMRSin conjunction with the characterization of an interiorsolution to get the demand functions:x* =M/2p1andx2* =M/2p2Finally, provide an intuitive interpretation ofthese demand functions: the individualspends half of his or her income on good 1 and half on good 2. You may also want to,as it were, "wave your hand," to generalize this result. If the utility function isU(x1,x2) = (x1)a((x1)1-a, then to maximize utility spenda% of income on good 1 and

Page 11

Microeconomics: Theory with Applications 8th Edition Solution Manual - Page 11 preview image

Loading page image...

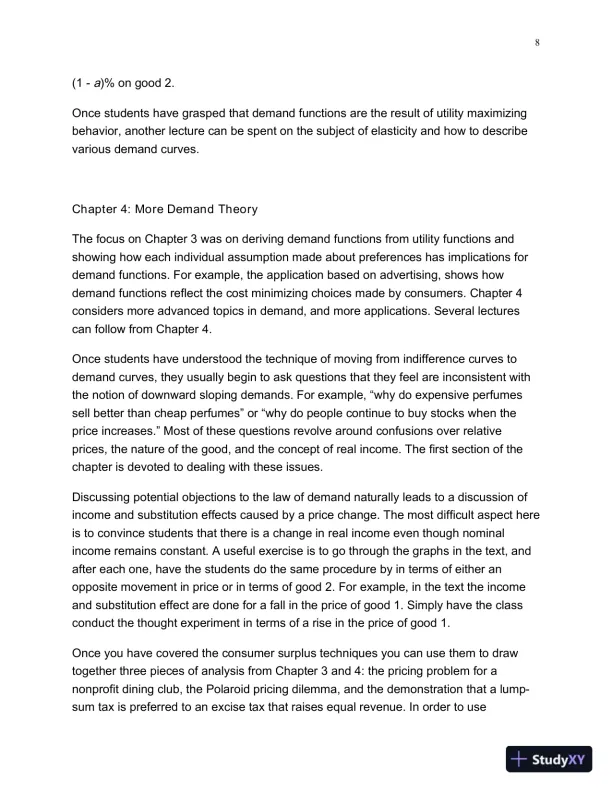
8(1-a)% on good 2.Once students have grasped that demand functions are the result of utility maximizingbehavior, another lecture can be spent on the subject of elasticity and how to describevarious demand curves.Chapter 4: More Demand TheoryThe focus on Chapter 3 was on deriving demand functions from utility functions andshowing how each individual assumption made about preferences has implications fordemand functions. For example, the application based on advertising, shows howdemand functions reflect the cost minimizing choices made by consumers. Chapter 4considers more advanced topics in demand, and more applications. Several lecturescan follow from Chapter 4.Once students have understood the techniqueof moving from indifference curves todemand curves, they usually begin to ask questions that they feel are inconsistent withthe notion of downward sloping demands. For example, “why do expensive perfumessell better than cheap perfumes” or “why do people continue to buy stocks when theprice increases.” Most of these questionsrevolve around confusions over relativeprices, the nature of the good, and the concept of real income. The first section of thechapter is devoted to dealing with these issues.Discussing potential objections to the law of demand naturally leads to a discussion ofincome and substitution effects caused by a price change. The most difficult aspect hereis to convince students that there is a change in real income even though nominalincome remains constant. A useful exercise is to go through the graphs in the text, andafter each one, have the students do the same procedure by in terms of either anopposite movement in price or in terms of good 2. For example, in the text the incomeand substitution effect are done for a fall in the price of good 1. Simply have the classconduct the thought experiment in terms of a rise in the price of good 1.Once you have covered the consumer surplus techniques you can use them to drawtogether three pieces of analysis from Chapter 3 and 4: the pricing problem for anonprofit dining club, the Polaroid pricing dilemma, and the demonstration that a lump-sum tax is preferred to an excise tax that raises equal revenue. In order to use

Page 12

Microeconomics: Theory with Applications 8th Edition Solution Manual - Page 12 preview image

Loading page image...

9consumer surplus techniques, we suppose there are no income effects on the demandfor the good in question (meals in the club, the number of Polaroid snapshots, the goodon which an excise tax is imposed).Consider Exercise 20 from Chapter 3 where a private, nonprofit dining club (in which allmembers have the same preferences) that produces meals at a constant marginal costof $50 per meal, has a fixed overhead cost equal to $1,000 per member per year. Wewant to show the student that in order to maximize welfare of the representative clubmember, the club will choose what we can call amembership fee scheme(charge itsmembers an annual membership fee of $1,000 and sell meals at their $50 marginalcost) in preference to what we can call amark-up scheme(charge a price greater than$50 such that profit per member is $1,000 per year). The representative member'sdemand curve is the curve CDF in Figure L1. Distance 0A is equal to the $50 marginalcost. By construction, the shaded area is equal to $1,000. Hence, under the mark-upscheme, the club would sell meals at a price equal to distance OB, and each memberwould buy x' meals. Notice that the annual value of club membership under the mark-upscheme is the area of triangle BCD. In contrast, the value to the club member of theright to buy meals at the $50 marginal cost is the area of triangle ACF. Once the $1,000annual membership fee is subtracted from this area, we see that the annual value ofclub membership under the membership fee scheme is the sum of areas BCD and DEF.In other words, relative to the mark-up scheme, the benefit to the club member of themembership fee schemeis the area of triangle DEF.More generally, the membership fee scheme is the optimal scheme, given that the clubmust cover its costs. One way to see this result is to think of the member as an owner-manager of an enterprise in which he or she can produce meals at a cost of $50 permeal for his or her private use. Given the opportunity to produce meals at $50, themember will produce and eatx* meals.Of course, the value of the privilege to producemeals for private use at a cost of $50 per meal is triangular area ACF. Since ACFexceeds $1,000, the prospective club member will be more than willing to pay the$1,000 membership fee. (We have not illustrated one interesting wrinklethe case inwhich it is impossible to recover the overhead cost under the mark-up scheme, and yet,under the optimal scheme, the prospective member is willing to pay the $1,000membership fee.)The analysis of the club problemin the previous paragraph reveals a deep similaritybetween that problem and the Polaroid pricing dilemma. If we interpret Figure LI as a

Page 13

Microeconomics: Theory with Applications 8th Edition Solution Manual - Page 13 preview image

Loading page image...

10Polaroid pricing dilemma, then distance 0A is the marginal cost of film, and the price atwhich Polaroid will sell itsfilm. It will sell its camera at a price equal to the triangulararea ACF. In both problems there is a constant marginal cost and, in the solution to bothproblems, the optimal price per unit is set equal to the constant marginal cost. In effect,this price maximizes the benefit to the consumer of the ability to produce the good inquestion at the constant marginal cost. The major difference between the two problemsconcerns the distribution of the maximized benefit. In the not-for-profit dining club, theclub member gets the benefit as consumer's surplus, while in the Polaroid pricingdilemma the monopolist gets the benefit as profit.To tackle the comparison of an excise tax with a lump sum tax which raises equalrevenue, interpret distance 0A in Figure L1 as the price of the good in question, distanceAB as the magnitude of the excise tax, and the shaded area as the amount of excise taxpaid. Then triangular area DEF can be interpreted as a measure of the benefit to theconsumer of switching from the excise tax to a $1,000 lump-sum tax.One final lecture that follows from chapter 4 is the difference between total value andmarginal value. Going over these notions provides a chance to review concepts likemarginal rates of substitution, optimization, and consumers surplus. More importantly,though, the ideas of TV and MV are very intuitive for students and they easily findexamples of their inverse relationship in their own life.Chapter 5: Intertemporal Decision Making and Capital ValuesExercise 2 at the end of Chapter 5,in conjunction with the material in Section 5.1, canbe used to produce a very good lecture on theseparation theorem. In exercise 2, Sarahhas been given a choice between two inheritance packagesPackage B is front-loaded, and PackageA is back-loaded. Begin with part c of the exercise where thedeposit rate of interest is 0% and the borrowing rate is 100%. First, construct the budgetlines associated with these two packages. Then use the diagram to observe that thefuture value of Package A exceeds the future value of Package B, while the presentvalue of Package B exceeds the present value of Package A. Now introducepreferences in which Sarah has a constantMRSof future consumption for presentconsumption, and show that if Sarah'sMRSis "large," she will choose Package A, whileif herMRSis "small," she will choose Package B. In short, her choice of an inheritance

Page 14

Microeconomics: Theory with Applications 8th Edition Solution Manual - Page 14 preview image

Loading page image...

11package cannot be separated from her preferences. Now turn to part a, where thedeposit and borrowing rates of interestare identical, and show that her choice of aninheritance bundle can be separated from her preferences. This leads naturally to astatement of the separation theorem.This way of approaching the separation theorem shows clearly the tremendoussimplification that arises when the borrowing and deposit rates are identical. Of course,students will recognize that, as a matter of fact, the borrowing rate exceeds the lendingrate. So this lecture provides a good opportunity to discuss the role of simplifyingassumptions in economic theory.Chapter 6: Production and Cost: One Variable InputIn Section 6.1, we derive a Cobb-Douglas production function that is used throughoutChapters 6 and 7 to illustrate almost all of the concepts that arise in the two chapters.We look at a production function for a courier firm that owns one truck. The variableinputs are gas and a driver's time, and output is measured in kilometers. We supposethat kilometers per litre is inversely proportional to the speed at which the truck isdriven.As we show in Section 6.1, this assumption gives rise to a constant-returns-to-scaleCobb-Douglas production function. It is worthwhile to look through the chapters to seehow this production function can be used to illustrate key concepts that arise in the twochapters. Further, this production function illustrates a trade-off that is universal intransportation economics, the trade-off between labor and energy. In effect, more speedallows one to substitute energy for labor (and tosome extent for capital as well).If you enjoy talking about rent dissipation in common property situations, you candiscuss the following problem and then relate it to the complementary model of trafficcongestion discussed in the chapter. In the exercise, there are two fisheriesan oceanfishery in which there is a constant catch per unit of effort (equal to 100 fish perfisherman per day) and a lake fishery in which there is a diminishing marginal catch.The total catch function for the lake fishery isy= lO00zl/2wherezis number of fisherman and y is total number offish caught. Unfortunately, thereis no simple non-calculus argument that we have found to derive the marginal catch

Page 15

Microeconomics: Theory with Applications 8th Edition Solution Manual - Page 15 preview image

Loading page image...

12function, so you will have to simply write it down (or differentiate) the total catchfunction.At the end of the day, each fisher on the lake has caught the average product of fish,and the harvest of fish from the lake is therefore equitably distributed among the fishers.Suppose there are 150 fishers on the island. From here you can discuss how calculatethe marginal and average products; what happens if everyone fishes in the ocean, ifeveryone fishes in the lake; what level of fishing maximizes the total take; what theoutcome is if no one owns the lake, if it is owned collectively, or privately. Etc.Thisexercise is designed to illustrate (i) the total dissipation of the potential value of thelake when fishermen have common access to the two fisheries, (ii) the optimalallocation of fishers to the two fisheries, and (iii) how the optimal allocation can beachieved under alternative institutional arrangements, including private property and atax on fish caught. The point of doing something like this is to show the student thatthere is some potential value in deriving marginal products beyond simply finding costcurves.Chapter 7: Production and Cost: Many Variable InputsProblem 7.4can used as the basis for a good lecture on the physical basis and costimplications of increasing returns. In these problems, fenced pasture land, measured insquare feet, is the output being produced. For simplicity, all fenced pastures aresquares. The inputs are land, also measured in square feet, and barbed wire, measuredin linear feet. Givenz1square feet of land, one can produce a fenced pasture no largerthanz1square feet. And givenz2linear feet of barbed wire, one can fence a pasture nolarger than (z2/4)2square feet. (Here we are assuming that a foot of barbed wire willproduce a foot of fence.) Hence, the production function isy= min[z1, (z2/4)2)Problem 7.4 examines returns to scale for this production function. There are, of course,constant returns to scale when there is excess barbed wire and increasing returns toscale when there is excess land.

Page 16

Microeconomics: Theory with Applications 8th Edition Solution Manual - Page 16 preview image

Loading page image...

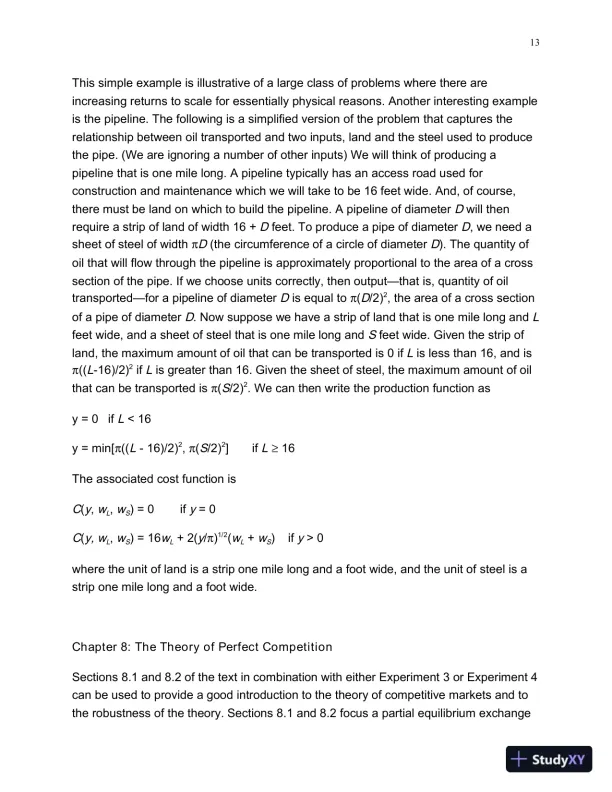
13This simple example is illustrative of a large class of problems where there areincreasing returns to scale for essentially physical reasons. Another interesting exampleis the pipeline. The following is a simplified version of the problem that captures therelationship between oil transported and two inputs, land and the steel used to producethe pipe. (We are ignoring a number of other inputs) We will think of producing apipeline that is one mile long. A pipeline typically has an access road used forconstruction and maintenance whichwe will take to be 16 feet wide. And, of course,there must be land on which to build the pipeline. A pipeline of diameterDwill thenrequire a strip of land of width 16 +Dfeet. To produce a pipe of diameterD, we need asheet of steel of widthπD(thecircumference of a circle of diameterD). The quantity ofoil that will flow through the pipeline is approximately proportional to the area of a crosssection of the pipe. If we choose units correctly, then outputthatis, quantity of oiltransportedfor apipeline of diameterDis equal toπ(D/2)2, the area of a cross sectionof a pipe of diameterD. Now suppose we have a strip of land that is one mile long andLfeet wide, and a sheet of steel that is one mile long andSfeet wide. Given the strip ofland, the maximum amount of oil that can be transported is 0 ifLis less than 16, and isπ((L-16)/2)2ifLis greater than 16. Given the sheet of steel, the maximum amount of oilthat can be transported isπ(S/2)2. We can then write the production function asy = 0ifL< 16y = min[π((L-16)/2)2,π(S/2)2]ifL16The associated cost function isC(y,wL,wS) = 0ify= 0C(y, wL,wS) = 16wL+ 2(y/π)1/2(wL+wS)ify> 0where the unit of land is a strip one mile long and a foot wide, and the unit of steel is astrip one mile long and a foot wide.Chapter 8: The Theory of Perfect CompetitionSections 8.1 and 8.2 of the text in combination with either Experiment3or Experiment4can be used to provide a good introduction to the theory of competitive marketsand tothe robustness of the theory. Sections 8.1 and 8.2 focus a partial equilibrium exchange
Preview Mode

This document has 200 pages. Sign in to access the full document!

Study Now!

XY-Copilot AI
Unlimited Access
Secure Payment
Instant Access
24/7 Support
Document Chat

Document Details

Subject
Economics

Related Documents

View all