QNT 351 BIMS Research Study

This assignment presents a statistical evaluation of the BIMS research study, focusing on data-driven decision-making.

William Chen
Contributor
4.4
60
5 months ago
Preview (4 of 13 Pages)
100%
Purchase to unlock

Page 1

QNT 351 BIMS Research Study - Page 1 preview image

Loading page image...

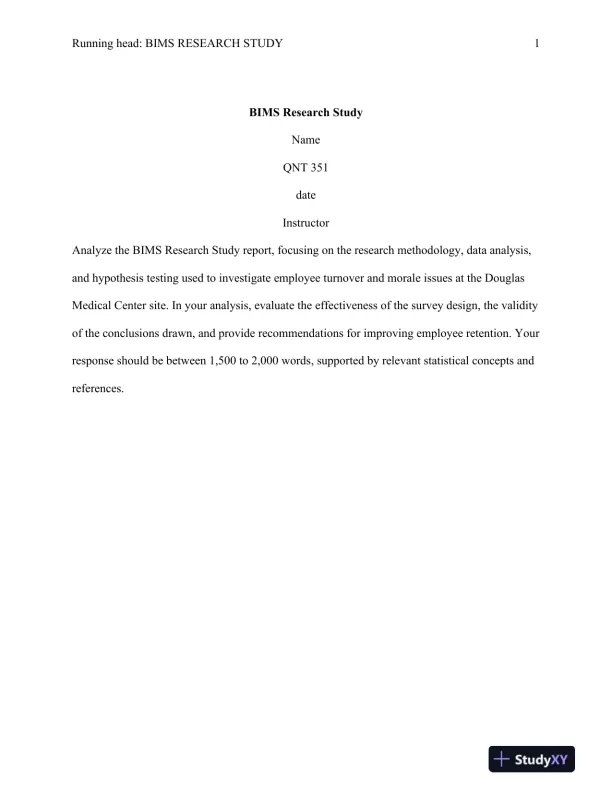
Running head: BIMS RESEARCH STUDY1BIMS Research StudyNameQNT 351dateInstructorAnalyze the BIMS Research Study report, focusing on the research methodology, data analysis,and hypothesis testing used to investigate employee turnover and morale issues at the DouglasMedical Center site. In your analysis, evaluate the effectiveness of the survey design, the validityof the conclusions drawn, and provide recommendations for improving employee retention. Yourresponse should be between 1,500 to 2,000 words, supported by relevant statistical concepts andreferences.

Page 2

QNT 351 BIMS Research Study - Page 2 preview image

Loading page image...

Page 3

QNT 351 BIMS Research Study - Page 3 preview image

Loading page image...

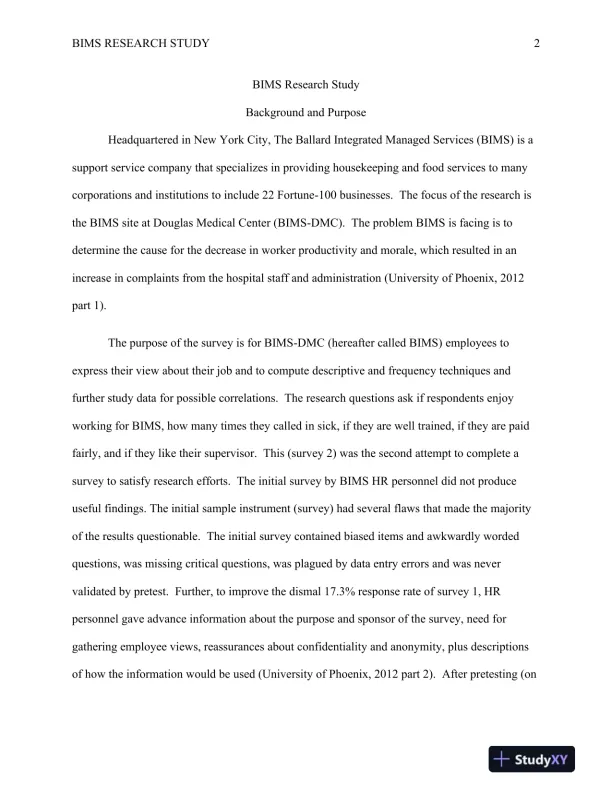
BIMS RESEARCH STUDY2BIMS Research StudyBackground and PurposeHeadquartered in New York City, The Ballard Integrated Managed Services (BIMS) is asupport service company that specializes in providing housekeeping and food services to manycorporations and institutions to include 22 Fortune-100 businesses. The focus of the research isthe BIMS site at Douglas Medical Center (BIMS-DMC). The problem BIMS is facing is todetermine the cause for the decrease in worker productivity and morale, which resulted in anincrease in complaints from the hospital staff and administration(University of Phoenix, 2012part 1).The purpose of the survey is for BIMS-DMC(hereafter called BIMS)employees toexpress their view about their job and to compute descriptive and frequency techniques andfurther study data for possible correlations. The research questions ask if respondents enjoyworking for BIMS, how many times theycalled in sick, if they are well trained, if they are paidfairly, and if they like their supervisor.This(survey 2)was the second attempt to complete asurvey to satisfy research efforts. The initial survey by BIMS HRpersonneldid not produceuseful findings. Theinitial sample instrument (survey)had several flaws that made the majorityof the results questionable. The initial survey contained biased items andawkwardly wordedquestions,was missingcritical questions, was plagued by data entry errorsand was nevervalidated by pretest.Further, to improve the dismal 17.3% response rate of survey 1, HRpersonnel gave advance information about the purpose and sponsor of the survey, need forgathering employee views, reassurances about confidentiality and anonymity, plus descriptionsof how the information would be used(University of Phoenix, 2012 part 2).After pretesting (on

Page 4

QNT 351 BIMS Research Study - Page 4 preview image

Loading page image...

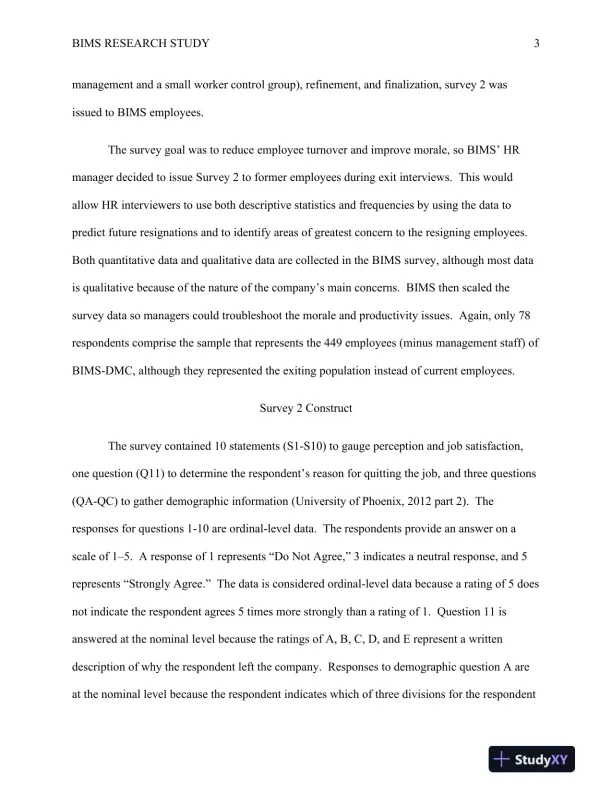
BIMS RESEARCH STUDY3management and a small worker control group), refinement, and finalization, survey 2 wasissued to BIMS employees.Thesurveygoal was to reduce employee turnover and improve morale,soBIMS’ HRmanager decided to issue Survey 2 to former employees during exit interviews. This wouldallow HR interviewers touseboth descriptive statistics and frequencies by using the data topredict future resignations and to identify areas of greatest concern to the resigning employees.Both quantitative dataandqualitative data are collected in the BIMS survey, although most datais qualitativebecause of thenature of the company’s main concerns.BIMSthen scaled thesurvey data somanagers could troubleshoot the morale and productivity issues.Again, only78respondents comprise the samplethatrepresents the449employees(minus management staff)ofBIMS-DMC, although they represented the exiting population instead of current employees.Survey2ConstructThe surveycontained10statements(S1-S10)to gauge perception and job satisfaction,one question(Q11)to determine the respondent’s reason for quitting the job,andthreequestions(QA-QC)togather demographic information(University of Phoenix, 2012part 2).Theresponses for questions 1-10are ordinal-level data. The respondents provide an answer on ascale of 15. A response of 1 represents “Do Not Agree,”3 indicates a neutral response, and 5represents “Strongly Agree.The data is considered ordinal-level data because a rating of 5 doesnot indicate the respondent agrees 5 times more strongly than a rating of 1. Question 11 isanswered at the nominal level because the ratings of A, B, C, D, and E represent a writtendescription of why the respondent left the company. Responses to demographic question A areat the nominal level because the respondent indicates which of three divisions for the respondent
Preview Mode

This document has 13 pages. Sign in to access the full document!

Study Now!

XY-Copilot AI
Unlimited Access
Secure Payment
Instant Access
24/7 Support
Document Chat

Document Details

Related Documents

View all