QNT/351 Week 3 � Summarizing and Presenting Data

This assignment covers methods for summarizing and presenting statistical data in business and research settings.

William Chen
Contributor
4.5
50
5 months ago
Preview (5 of 15 Pages)
100%
Purchase to unlock

Page 1

QNT/351 Week 3 � Summarizing and Presenting Data - Page 1 preview image

Loading page image...

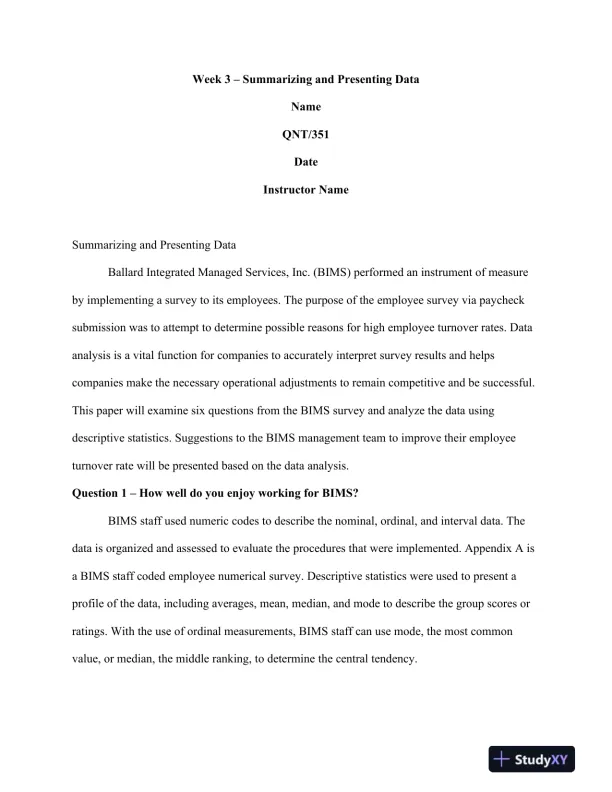
Week 3Summarizing and Presenting DataNameQNT/351DateInstructor NameSummarizing and Presenting DataBallard Integrated Managed Services, Inc. (BIMS) performed an instrument of measureby implementing a survey to its employees. The purpose of the employee survey via paychecksubmission was to attempt to determine possible reasons for high employee turnover rates. Dataanalysis is a vital function for companies to accurately interpret survey results and helpscompanies make the necessary operational adjustments to remain competitive and be successful.This paper will examine six questions from the BIMS survey and analyze the data usingdescriptive statistics. Suggestions to the BIMS management team to improve their employeeturnover rate will be presented based on the data analysis.Question 1How well do you enjoy working for BIMS?BIMS staff used numeric codes to describe the nominal, ordinal, and interval data. Thedata is organized and assessed to evaluate the procedures that were implemented. Appendix A isa BIMS staff coded employee numerical survey. Descriptive statistics were usedto present aprofile of the data, including averages, mean, median, and mode to describe the group scores orratings. With the use of ordinal measurements, BIMS staff can use mode, the most commonvalue, or median, the middle ranking, to determine the central tendency.

Page 2

QNT/351 Week 3 � Summarizing and Presenting Data - Page 2 preview image

Loading page image...

Page 3

QNT/351 Week 3 � Summarizing and Presenting Data - Page 3 preview image

Loading page image...

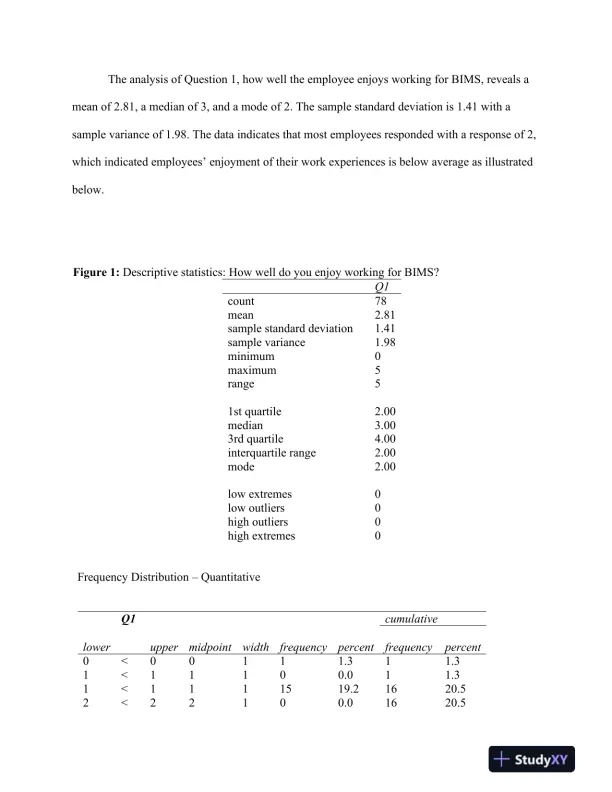
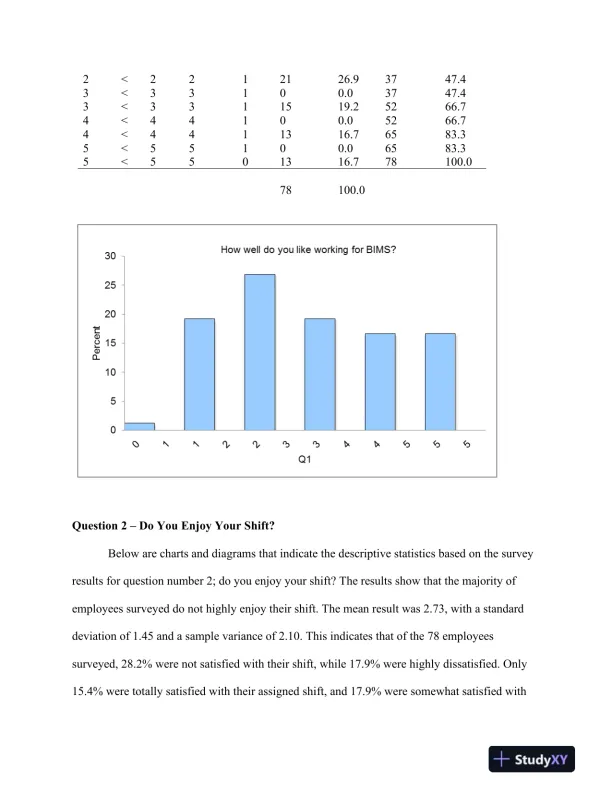
The analysis of Question 1, how well the employee enjoys working for BIMS, reveals amean of 2.81, a median of 3, and a mode of 2. The sample standard deviation is 1.41 with asample variance of 1.98. The data indicates that most employees responded with a response of 2,which indicated employees’ enjoyment of their work experiences is below average as illustratedbelow.Figure 1:Descriptive statistics: How well do you enjoy working for BIMS?Q1count78mean2.81sample standard deviation1.41sample variance1.98minimum0maximum5range51st quartile2.00median3.003rd quartile4.00interquartile range2.00mode2.00low extremes0low outliers0high outliers0high extremes0Frequency DistributionQuantitativeQ1cumulativeloweruppermidpointwidthfrequencypercentfrequencypercent0<00111.311.31<11100.011.31<1111519.21620.52<22100.01620.5

Page 4

QNT/351 Week 3 � Summarizing and Presenting Data - Page 4 preview image

Loading page image...

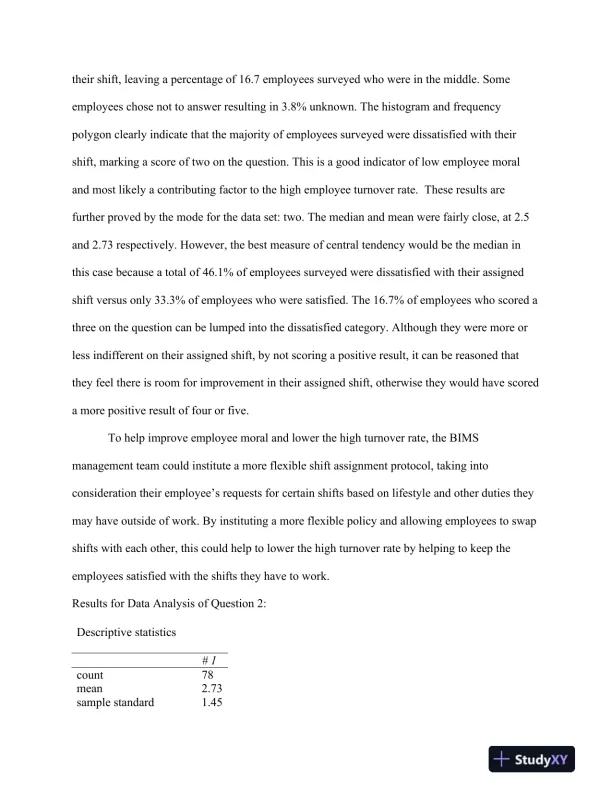
2<2212126.93747.43<33100.03747.43<3311519.25266.74<44100.05266.74<4411316.76583.35<55100.06583.35<5501316.778100.078100.0Question 2Do You Enjoy Your Shift?Below are charts and diagrams that indicate the descriptive statistics based on the surveyresults for question number 2; do you enjoy your shift? The results show that the majority ofemployees surveyed do not highly enjoy their shift. The mean result was 2.73, with a standarddeviation of 1.45 and a sample variance of 2.10. This indicates that of the 78 employeessurveyed, 28.2% were not satisfied with their shift, while 17.9% were highly dissatisfied. Only15.4% were totally satisfied with their assignedshift, and 17.9% were somewhat satisfied with

Page 5

QNT/351 Week 3 � Summarizing and Presenting Data - Page 5 preview image

Loading page image...

their shift, leaving a percentage of 16.7 employees surveyed who were in the middle. Someemployees chose not to answer resulting in 3.8% unknown. The histogram and frequencypolygon clearly indicate that the majority of employees surveyed were dissatisfied with theirshift, marking a score of two on the question. This is a good indicator of low employee moraland most likely a contributing factor to the high employee turnover rate. These results arefurther proved by the mode for the data set: two. The median and mean were fairly close, at 2.5and 2.73 respectively. However, the best measure of central tendency would be the median inthis case because a total of 46.1% of employees surveyed were dissatisfied with their assignedshift versus only 33.3% of employees who were satisfied. The 16.7% of employees who scored athree on the question can be lumped into the dissatisfied category. Although they were more orless indifferent on their assigned shift, by not scoring a positive result, it can be reasoned thatthey feel there is room for improvement in their assigned shift, otherwise they would have scoreda more positive result of four or five.To help improve employee moral and lower the high turnover rate, the BIMSmanagement team could institute a more flexible shift assignment protocol, taking intoconsideration their employee’s requests for certain shifts based on lifestyle and other duties theymay have outside of work. By instituting a more flexible policy and allowing employees to swapshifts with each other, this could help to lower the high turnover rate by helping to keep theemployees satisfied with the shifts they have to work.Results for Data Analysis of Question 2:Descriptive statistics# 1count78mean2.73sample standard1.45
Preview Mode

This document has 15 pages. Sign in to access the full document!

Study Now!

XY-Copilot AI
Unlimited Access
Secure Payment
Instant Access
24/7 Support
Document Chat

Document Details

Related Documents

View all