Solution Manual for Economics, 13th Edition
Solution Manual for Economics, 13th Edition helps you tackle difficult exercises with expert guidance.
John Wilson
Contributor
4.3
84
about 2 months ago
Preview (31 of 311)
Sign in to access the full document!
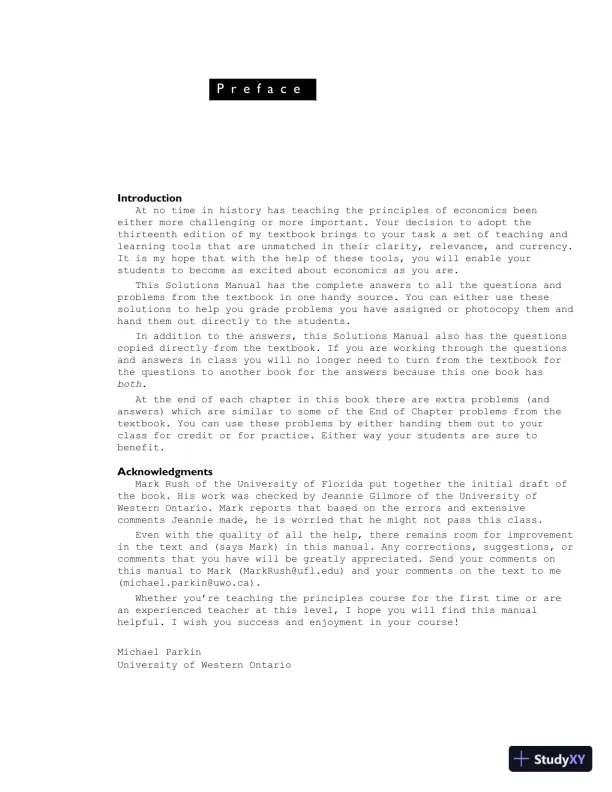
Preface iii
Part 1 Introduction
Chapter 1 What is Economics? 1
Appendix Graphs in Economics 9
Chapter 2 The Economic Problem 21
Part 2 How Markets Work
Chapter 3 Demand and Supply 39
Chapter 4 Elasticity 53
Chapter 5 Efficiency and Equity 65
Chapter 6 Government Actions in Markets 79
Chapter 7 Global Markets in Action 93
Part 3 Households’ Choices
Chapter 8 Utility and Demand 107
Chapter 9 Possibilities, Preferences, and Choices 121
Part 4 Firms and Markets
Chapter 10 Organizing Production 137
Chapter 11 Output and Costs 151
Chapter 12 Perfect Competition 165
Chapter 13 Monopoly 179
Chapter 14 Monopolistic Competition 197
Chapter 15 Oligopoly 209
Part 5 Market Failure and Government
Chapter 16 Public Choices, Public Goods, and Healthcare 223
Chapter 17 Externalities 237
Part 6 Factor Markets, Inequality, and Uncertainty
Chapter 18 Markets for Factors of Production 249
Chapter 19 Economic Inequality 261
Chapter 20 Uncertainty and Information 275
T a b l e o f C o n t e n t s
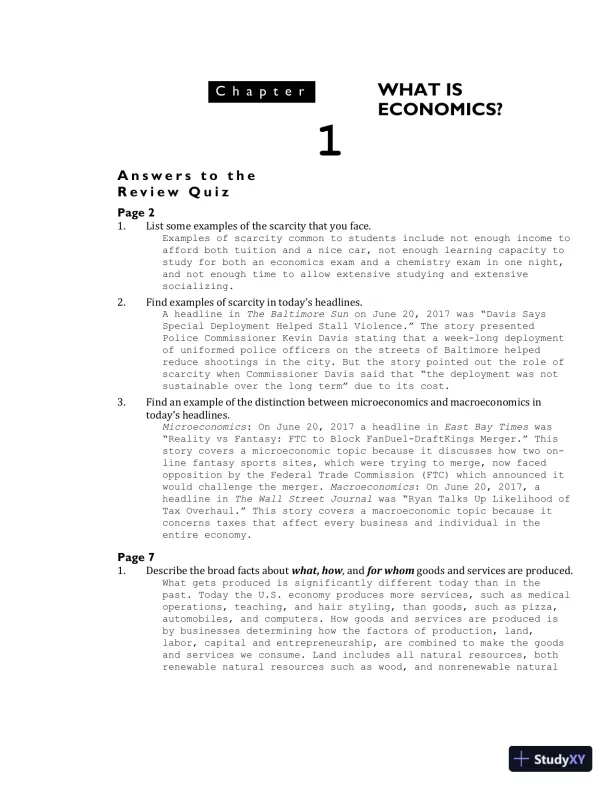
Introduction
At no time in history has teaching the principles of economics been
either more challenging or more important. Your decision to adopt the
thirteenth edition of my textbook brings to your task a set of teaching and
learning tools that are unmatched in their clarity, relevance, and currency.
It is my hope that with the help of these tools, you will enable your
students to become as excited about economics as you are.
This Solutions Manual has the complete answers to all the questions and
problems from the textbook in one handy source. You can either use these
solutions to help you grade problems you have assigned or photocopy them and
hand them out directly to the students.
In addition to the answers, this Solutions Manual also has the questions
copied directly from the textbook. If you are working through the questions
and answers in class you will no longer need to turn from the textbook for
the questions to another book for the answers because this one book has
both.
At the end of each chapter in this book there are extra problems (and
answers) which are similar to some of the End of Chapter problems from the
textbook. You can use these problems by either handing them out to your
class for credit or for practice. Either way your students are sure to
benefit.
Acknowledgments
Mark Rush of the University of Florida put together the initial draft of
the book. His work was checked by Jeannie Gilmore of the University of
Western Ontario. Mark reports that based on the errors and extensive
comments Jeannie made, he is worried that he might not pass this class.
Even with the quality of all the help, there remains room for improvement
in the text and (says Mark) in this manual. Any corrections, suggestions, or
comments that you have will be greatly appreciated. Send your comments on
this manual to Mark (MarkRush@ufl.edu) and your comments on the text to me
(michael.parkin@uwo.ca).
Whether you’re teaching the principles course for the first time or are
an experienced teacher at this level, I hope you will find this manual
helpful. I wish you success and enjoyment in your course!
Michael Parkin
University of Western Ontario
P r e f a c e
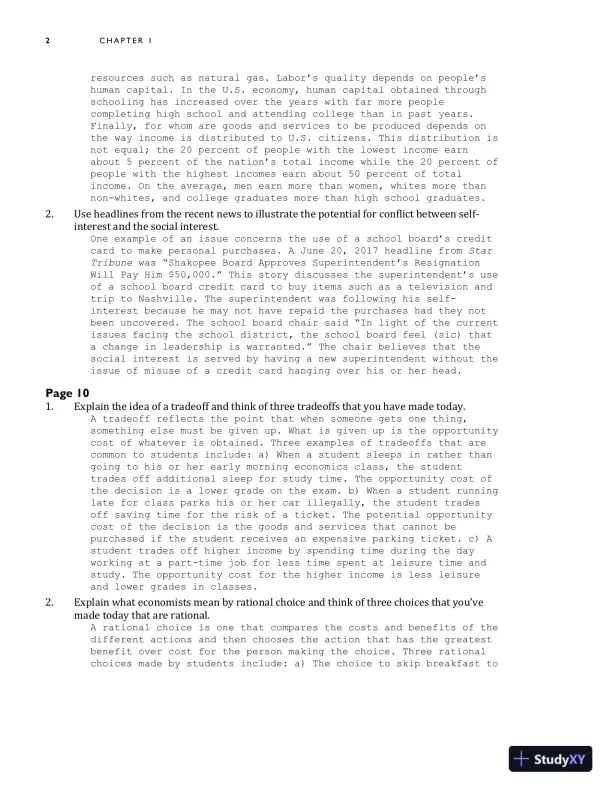
A n s w e r s t o t h e
R e v i e w Q u i z
Page 2
1. List some examples of the scarcity that you face.
Examples of scarcity common to students include not enough income to
afford both tuition and a nice car, not enough learning capacity to
study for both an economics exam and a chemistry exam in one night,
and not enough time to allow extensive studying and extensive
socializing.
2. Find examples of scarcity in today’s headlines.
A headline in The Baltimore Sun on June 20, 2017 was “Davis Says
Special Deployment Helped Stall Violence.” The story presented
Police Commissioner Kevin Davis stating that a week-long deployment
of uniformed police officers on the streets of Baltimore helped
reduce shootings in the city. But the story pointed out the role of
scarcity when Commissioner Davis said that “the deployment was not
sustainable over the long term” due to its cost.
3. Find an example of the distinction between microeconomics and macroeconomics in
today’s headlines.
Microeconomics: On June 20, 2017 a headline in East Bay Times was
“Reality vs Fantasy: FTC to Block FanDuel-DraftKings Merger.” This
story covers a microeconomic topic because it discusses how two on-
line fantasy sports sites, which were trying to merge, now faced
opposition by the Federal Trade Commission (FTC) which announced it
would challenge the merger. Macroeconomics: On June 20, 2017, a
headline in The Wall Street Journal was “Ryan Talks Up Likelihood of
Tax Overhaul.” This story covers a macroeconomic topic because it
concerns taxes that affect every business and individual in the
entire economy.
Page 7
1. Describe the broad facts about what, how, and for whom goods and services are produced.
What gets produced is significantly different today than in the
past. Today the U.S. economy produces more services, such as medical
operations, teaching, and hair styling, than goods, such as pizza,
automobiles, and computers. How goods and services are produced is
by businesses determining how the factors of production, land,
labor, capital and entrepreneurship, are combined to make the goods
and services we consume. Land includes all natural resources, both
renewable natural resources such as wood, and nonrenewable natural
1
WHAT IS
ECONOMICS?
C h a p t e r
Loading page 4...
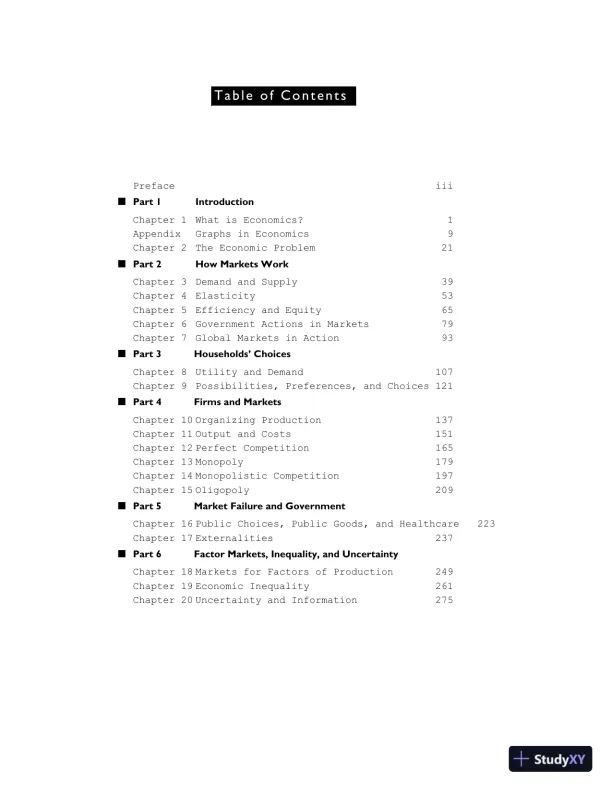
2 C H A P T E R 1
resources such as natural gas. Labor’s quality depends on people’s
human capital. In the U.S. economy, human capital obtained through
schooling has increased over the years with far more people
completing high school and attending college than in past years.
Finally, for whom are goods and services to be produced depends on
the way income is distributed to U.S. citizens. This distribution is
not equal; the 20 percent of people with the lowest income earn
about 5 percent of the nation’s total income while the 20 percent of
people with the highest incomes earn about 50 percent of total
income. On the average, men earn more than women, whites more than
non-whites, and college graduates more than high school graduates.
2. Use headlines from the recent news to illustrate the potential for conflict between self-
interest and the social interest.
One example of an issue concerns the use of a school board’s credit
card to make personal purchases. A June 20, 2017 headline from Star
Tribune was “Shakopee Board Approves Superintendent’s Resignation
Will Pay Him $50,000.” This story discusses the superintendent’s use
of a school board credit card to buy items such as a television and
trip to Nashville. The superintendent was following his self-
interest because he may not have repaid the purchases had they not
been uncovered. The school board chair said “In light of the current
issues facing the school district, the school board feel (sic) that
a change in leadership is warranted.” The chair believes that the
social interest is served by having a new superintendent without the
issue of misuse of a credit card hanging over his or her head.
Page 10
1. Explain the idea of a tradeoff and think of three tradeoffs that you have made today.
A tradeoff reflects the point that when someone gets one thing,
something else must be given up. What is given up is the opportunity
cost of whatever is obtained. Three examples of tradeoffs that are
common to students include: a) When a student sleeps in rather than
going to his or her early morning economics class, the student
trades off additional sleep for study time. The opportunity cost of
the decision is a lower grade on the exam. b) When a student running
late for class parks his or her car illegally, the student trades
off saving time for the risk of a ticket. The potential opportunity
cost of the decision is the goods and services that cannot be
purchased if the student receives an expensive parking ticket. c) A
student trades off higher income by spending time during the day
working at a part-time job for less time spent at leisure time and
study. The opportunity cost for the higher income is less leisure
and lower grades in classes.
2. Explain what economists mean by rational choice and think of three choices that you’ve
made today that are rational.
A rational choice is one that compares the costs and benefits of the
different actions and then chooses the action that has the greatest
benefit over cost for the person making the choice. Three rational
choices made by students include: a) The choice to skip breakfast to
Loading page 5...
W H A T I S E C O N O M I C S ? 3
go to class. In this case the benefit is the higher grade in the
class and the cost is the breakfast forgone. b) The choice to stop
talking with a friend on the phone and start studying for an
impending exam. In this case the benefit is the resulting higher
grade in the class and the cost is the conversation forgone. c) The
choice to do laundry today rather than watch television. In this
case the benefit is the fact the student will have clean clothes to
wear and the cost is the loss of the entertainment the television
show would have provided.
3. Explain why opportunity cost is the best forgone alternative and provide examples of some
opportunity costs that you have faced today.
When a decision to undertake one activity is made, often many
alternative activities are no longer possible. Often these
activities are mutually exclusive so only the highest valued
alternative is actually forgone. For instance, the decision to go to
a student’s 8:30 AM class eliminates the possibility of sleeping in
during the hour and of jogging during the hour. But in this case, it
is impossible to both sleep in and to jog during the hour, so the
opportunity cost cannot be both activities. What is lost is only the
activity that otherwise would have been chosen—either sleeping in or
jogging—which is whatever activity would have been chosen, that is,
the most highly valued of the forgone alternatives. For students,
attending class, doing homework, studying for a test are all
activities with opportunity costs.
4. Explain what it means to choose at the margin and illustrate with three choices at the
margin that you have made today.
Choosing at the margin means choosing to do a little more or a
little less of some activity. Three common examples students
encounter are: a) When a student faces a chemistry and an economics
final exam in one day, the student must determine whether spending
the last hour studying a little more chemistry or a little more
economics will yield a better contribution (marginal benefit) to his
or her overall GPA. b) A college student buying a computer must
decide whether the marginal benefit of adding 1 GB of additional
memory is worth the marginal cost of the additional memory. c) A
student football fan with a choice of a cheap seat in the student
bleachers located at the far end of the playing field or a more
expensive seat located on the 30 yard line must determine whether
the marginal benefit of watching the game from a better seat is
worth the marginal cost of the higher ticket price.
5. Explain why choices respond to incentives and think of three incentives to which you have
responded today.
People making rational decisions compare the marginal benefits of
different actions to their marginal costs. Therefore people’s
choices change when their incentives, that is the marginal benefit
and/or marginal cost, of the choice changes. Just as everyone else,
students respond to incentives; a) A student studies because of the
incentives offered by grades. b) A student is more likely to attend
a class if attendance is factored into the grade. c) A student might
Loading page 6...
4 C H A P T E R 1
attend a meeting of a club if the student’s significant other is
eager to attend the meeting.
Page 11
1. Distinguish between a positive statement and a normative statement and provide
examples.
A positive statement is a description of how the world is. It is
testable. A normative statement is a description of how the world
ought to be. It is, by its very nature, not testable because there
is no universally approved criterion by which the statement can be
judged. “I will receive an A for this course,” is a positive
statement made by an economics student—it might not be true, but it
is testable. “I will receive a good grade for this course,” is a
normative statement. Whether someone agrees with it depends on his
or her interpretation of what makes for a “good” grade.
2. What is a model? Can you think of a model that you might use in your everyday life?
A model is a description of some aspect of the economic world. It
includes only those features that are necessary to understand the
issue under study. An economic model is designed to reflect those
aspects of the world that are relevant to the user of the model and
ignore the aspects that are irrelevant. A typical model is a GPS
map. It reflects only those aspects of the real world that are
relevant in assisting the user in reaching his or her destination
and avoids using information irrelevant to travel.
3. How do economists try to disentangle cause and effect?
Economists use models to understand some aspect of the economic
world. Testing the predictions of models makes it necessary to
disentangle cause and effect. To overcome this problem, economists
have three methods of testing their models: Using a natural
experiment, using a statistical investigation, and using economic
experiments. A natural experiment is a situation that arises in the
ordinary course of life in which one factor being studied varies and
the other factors are the same. This method allows the economist to
focus on the effect from the factor that differs between the two
situations. A statistical investigation looks for correlations
between variables but then determining whether the correlation
actually reflects causation can be difficult. An economic experiment
puts people into decision making situations and then varies the
relevant factors one at a time to determine each factor’s effect.
4. How is economics used as a policy tool?
Individuals, businesses, and governments use economics as a policy
tool. Individuals use the economic ideas of marginal benefit and
marginal cost when making decisions for such topics as attending
college, paying cash or credit for a purchase, and working.
Businesses also use the concepts of marginal benefit and marginal
cost when making decisions about what to produce, how to produce,
and even how many hours to stay open. Finally governments also use
marginal benefit and marginal cost when deciding issues such as the
Loading page 7...
W H A T I S E C O N O M I C S ? 5
level of property taxes, the amount to fund higher education, or the
level of a tariff on Brazilian ethanol.
Page 13
1. What types of jobs do economists do?
Economists are found in a large variety of jobs. Many of these jobs
are analysts of various sorts. Some economists are market research
analysts—they work with data on sales and try to predict a product’s
success and the price that should be set for it. Other economists
are financial analysts—they work with data on interest rates, stock
and bond prices to try to forecast the cost of borrowing the returns
that can be expected on investments. Still other economists work as
budget analysts—they use data on an organization’s cash inflows (its
receipts) and its outflows (its payments) in order to prepare plans
forecasting future cash flows.
2. What is the range and median level of economists’ pay?
Economists’ pay ranges from $41,226 to $124,177 and has a median
salary of $72,279. Students who earn a PhD in economics typically
earn about $100,000 by mid-career. Economists who work as analysts
have incomes that range from an average of $62,000 for market
research analysts to $80,000 for financial analysts.
3. What are the skills needed for an economics job?
Economists need five important skills:
• Critical-thinking skills: Economists need the ability to use
logical thinking to clarify and then solve real-world
problems.
• Analytical skills: Economists must be able to use economic ideas
and tools to analyze data in order to determine important
patterns and reach logical conclusions.
• Math skills: Economists need to be able to use mathematical and
statistical tools to explore and analyze data in order to
reach valid conclusions.
• Writing skills: Economists must be able to clearly write reports
presenting ideas, conclusions from any analysis and reasons
why the conclusions are valid.
• Oral communication skills: Economists need the ability to orally
explain ideas, conclusions, and the reasons why the
conclusions are correct to a variety of people, including
those with little knowledge of economics.
Loading page 8...
6 C H A P T E R 1
A n s w e r s t o t h e S t u d y P l a n P r o b l e m s a n d A p p l i c a t i o n s
1. Apple Inc. decides to make iTunes freely available in unlimited quantities.
a. Does Apple’s decision change the incentives that people face?
Apple’s decision changes people’s incentives. For example, it
increases people’s incentives to buy an iPod to take advantage of
the newly “free” music available on iTunes.
b. Is Apple’s decision an example of a microeconomic or a macroeconomic issue?
Apple’s decision is a microeconomic decision because it affects a
single company and a single market.
2. Which of the following pairs does not match?
a. Labor and wages
Labor earns wages, so this pair matches.
b. Land and rent
Land earns rent, so this pair matches.
c. Entrepreneurship and profit
Entrepreneurship earns profit, so this pair matches.
d. Capital and profit
Capital earns interest, so this pair does not match.
3. Explain how the following news headlines concern self-interest and the social interest.
a. Starbucks Expands in China
Starbucks’ expansion is a decision made by Starbucks to further
Starbucks’ interest. Thus the decision is directly in Srarbucks’
self interest. The social interest is affected because Starbucks’
expansion will have an effect in China. For instance, more Chinese
citizens might drink coffee rather than tea and fewer coffee shops
run by Chinese firms might open.
b. McDonald’s Moves into Gourmet Coffee
McDonald’s decision to serve gourmet coffee is a decision made by
McDonald’s to further McDonald’s interest. Thus the decision is
directly in McDonald’s self interest. The social interest is
affected because more people will drink coffee rather than other
drinks such as sodas.
c. Food Must Be Labeled with Nutrition Data
The decision to require that food must be labeled with nutrition
information is made in the social interest. This decision is not
made by any one single firm and so does not (necessarily) reflect
anyone’s self interest.
4. The night before an economics test, you decide to go to the movies instead of staying home
and working your MyEconLab Study Plan. Your grade on the test was 50 percent, lower
than your usual 70 percent score.
a. Did you face a tradeoff?
Yes, you faced a tradeoff. The tradeoff was between a higher test
score and an evening with your friends at the movies.
Loading page 9...
W H A T I S E C O N O M I C S ? 7
b. What was the opportunity cost of your evening at the movies?
The opportunity cost of going to the movies is the fall in your
grade. That is the 20 points forgone from choosing to see the movie
rather than study.
b. What was the opportunity cost of your evening at the movies?
The opportunity cost of going to the movies is the fall in your
grade. That is the 20 points forgone from choosing to see the movie
rather than study.
Loading page 10...
8 C H A P T E R 1
5. Cost of Rio Olympics
Brazilian federal, state, and local governments spent R$2.8 billion and private sponsors
spent R$4.2 billion on 17 new Olympic facilities, 10 of which will be used for sporting
events after the Olympics.
Source: Financial Times, August 6, 2016
Was the opportunity cost of the Rio Olympics R$2.8 or R$7 billion? Explain your answer.
The R$7 billion spent on the 17 new Olympic facilities is an
opportunity cost of the Olympics if the funds would not have spent
otherwise. However, if there were already plans underway to build
the 10 facilities that will be used after the Olympics, then their
cost is not an opportunity cost of the Olympics because the cost
would have been paid even if Rio did not host the Olympics.. The
cost of the 7 facilities that will not be used afterwards, however,
is definitely an opportunity cost of the Rio Olympics.
6. Which of the following statements is positive, which is normative, and which can be tested?
a. The United States should cut its imports.
The statement is normative and cannot be tested.
b. China is the largest trading partner of the United States.
The statement is positive and can be tested.
c. If the price of gasoline rises, people will drive less and use less gasoline.
The statement is positive and can be tested.
Loading page 11...
W H A T I S E C O N O M I C S ? 9
Answers to Additional Problems and Applications
7. Kanye West Offers Free Concert Tickets
Kanye West has teamed with Los Angeles inner-city schools to offer free passes for students.
Source: consequenceofsound.net, November 27, 2016
When Kanye West gave away tickets, what was free and what was scarce? Explain your
answer.
The seats in the arenas are scarce—there are only a limited number.
The time of school adminstrators used to distribute the tickets is
also not free. In addition, if the students who are given the “free”
ticket attended the concert rather than sell their free tickets,
they incurred the opportunity cost of the foregone ticket price. So
the concert was far from “free” for the concert-goers. The publicity
that Kanye West receives is free to him but the publicity used
reporters’ scarce time to report on the tickets rather than
reporting on other news worthy events.
8. How does the creation of a successful movie influence what, how, and for whom goods and
services are produced?
The “what” question is affected in two ways. First, one good or
service that is produced is the successful movie. Second, spinoffs
(Iron Man II) and/or similar films likely will be created in the
future. The “how” question is affected to the extent that movies use
different production methods. Some movies, for instance, have a lot
of special effects while other movies have few or none. The “for
whom” question is influenced because those people who, as the result
of the blockbuster movie, have higher incomes so that more goods and
services are produced for them.
9. How does a successful movie illustrate self-interested choices that are also in the social
interest?
The a successful movie increases the income of the people involved
with the movie. Hence these people’s choices are driven largely by
self interest. However the creation of a successful movie also
increases the quantity of widely enjoyed entertainment. The amount
of entertainment available in the economy increases which benefits
society. So the choices the people made in their self interest also
reflected choices made in the social interest.
10. Before starring in Guardians of the Galaxy, Chris Pratt had appeared in 11 movies that
grossed an average of $7 million on the opening weekend. Guardians of the Galaxy grossed
$94 million.
a. How will the success of Guardians of the Galaxy influence the opportunity cost of hiring
Chris Pratt?
The salary that must be paid to Chris Pratt to appear in future
movies increased because some of the success of Guardians of the
Galaxy was attributed to Mr. Pratt. As a result the opportunity cost
to movie producers of hiring Mr. Pratt increased.
Loading page 12...
1 0 C H A P T E R 1
b. How have the incentives for a movie producer to hire Chris Pratt changed?
There are two effects on the incentives of producers to hire Mr.
Pratt. First, because the opportunity cost of hiring Mr. Pratt
increased, the incentive to hire him decreased. However because part
of the success of Guardians of the Galaxy was attributed to Mr.
Pratt acting in the leading role, producers expect that his acting
will lead to increased success for future movies. This belief
increases producers’ incentives to hire Mr. Pratt.
11. What might be an incentive for you to take a class in summer school? List some of the
benefits and costs involved in your decision. Would your choice be rational?
Early graduation, smaller class sizes, and/or retaining eligibility
for a scholarship are examples of incentives that encourage taking
summer classes. The benefits of taking summer classes might include
early graduation, more personal attention from the instructor,
retained eligibility for a scholarship, and increased knowledge
about some aspect of the world. Costs potentially include forgone
summer jobs or internships, less time to spend with friends, and
additional tuition and other class-related expenses if the class I
not one that would be taken otherwise. The choice is rational as
long as the student determines that taking summer classes offers the
highest benefit over cost for the use of his or time and efforts.
12. Look at today’s Wall Street Journal. What is the leading economic news story? With big
economic questions and tradeoffs does it discuss or imply?
On June 20, 2017, the top economic news story discussed the Senates
plan to vote on legislation repealing large parts of the Affordable
Care Act. One option under consideration would cap the amount the
federal government would pay toward the cost of Medicaid, the
program that pays for healthcare for poor and disabled people.
This story clearly discusses the “for whom” question: If Medicaid
spending is reduced, fewer poor and disabled people will receive
certain types of healthcare. It also discusses the “what” question:
If fewer Americans have health insurance, less goods and services
related to health care will be produced.
The story implicitly illustrates a tradeoff: If choices are taken to
limit the amount of healthcare poor and disabled people receive,
their health will generally be worse than otherwise.
13. Provide two microeconomic statements and two macroeconomic statements. Classify your
statements as positive or normative, and explain your classifications.
Microeconomic statements are: Fewer deep water oil wells should be
drilled in the Gulf of Mexico. If less oil is produced, the price of
oil will rise. The first statement is normative because it relies on
what the person thinks “should” be done. The second statement is
positive because it is possible to test the effect of less oil being
produced.
Macroeconomic statements are: The currently unemployment rate is too
high. The current unemployment rate is higher for blacks than for
whites. The first statement is normative because it depends on what
Loading page 13...
W H A T I S E C O N O M I C S ? 1 1
is deemed “too high.” The second statement is positive because it
can be checked to determine its validity.
is deemed “too high.” The second statement is positive because it
can be checked to determine its validity.
Loading page 14...
A n s w e r s t o t h e R e v i e w Q u i z
Page 30
1. Explain how we “read” the three graphs in Figs. A1.1 and A1.2.
The points in the graphs relate the quantity of the variable
measured on the one axis to the quantity of the variable measured on
the other axis. The quantity of the variable measured on the
horizontal axis (the x-axis) is measured by the horizontal distance
from the origin to the point. Similarly, the quantity of the
variable measured on the vertical axis (the y-axis) is measured by
the vertical distance from the origin to the point. The point
relates these two quantities. For instance, in Figure A1.2, point A
shows that at a price of $8.43 per ticket, 1.3 billion tickets are
sold.
2. Explain what scatter diagrams show and why we use them.
Scatter diagrams plot the value of one economic variable against the
value of another variable for a number of different values of each
variable. We use scatter diagrams because they quickly reveal if a
relationship exists between the two variables. Moreover, if a
relationship exists, scatter diagrams show whether increases in one
variable are associated with increases or decreases in the other
variable.
3. Explain how we “read” the three scatter diagrams in Figs. A1.3 and A1.4.
The scatter diagram in Figure A1.3 shows the relationship between a
film’s worldwide box office ticket sales and the film’s production
budget. The figure shows that higher box office sales are associated
with a higher production budget.
The scatter diagram in Figure A1.4a shows the relationship between
income, in thousands of dollars per year, and expenditure, also in
thousands of dollars per year, for the years 2001 to 2016. The
scatter diagram shows that higher income leads to higher
expenditure. The figure also shows that the relationship is
relatively strong.
The scatter diagram in Figure A1.4b shows the relationship between
the inflation rate and the unemployment rate for the years 2001 to
2016. The figure shows that for most of the years, there was a weak
relationship between these variables, with perhaps higher inflation
being associated with lower unemployment.
1 GRAPHS IN
ECONOMICS
A p p e n d i x
Loading page 15...
1 0 A P P E N D I X 1
4. Draw a graph to show the relationship between two variables that move in the same
direction.
A graph that shows the
relationship between two
variables that move in the same
direction is shown by a line that
slopes upward. Figure A1.1
illustrates such a relationship.
5. Draw a graph to show the relationship between two variables that move in opposite
directions.
A graph that shows the
relationship between two
variables that move in the
opposite directions is shown by a
line that slopes downward. Figure
A1.2 illustrates such a
relationship.
F I G U R E A l . 1
Review problem 4
2 _
1 _
_t----1----1----1----1----1----1----1----1----1----1---- x
2 3 4 5 6 7 8 9 10 1 1 1 2
F I G U R E A l . 2
Review problem 5
2 _
1 _
_t---- 1----1---- 1----1---- 1----1----1----1---- 1----1---- x
2 3 4 5 6 7 8 9 10 1 1 1 2
Loading page 16...
G R A P H S I N E C O N O M I C S 1 1
6. Draw a graph of two variables whose relationship shows (i) a maximum and (ii) a
minimum.
A graph that shows the
relationship between two
variables that have a maximum
is shown by a line that
starts out sloping upward,
reaches a maximum, and then
slopes downward. Figure A1.3
illustrates such a
relationship with curve B.
A graph that shows the
relationship between two
variables that have a minimum
is shown by a line that
starts out sloping downward,
reaches a minimum, and then
slopes upward. Figure A1.3
illustrates such a
relationship with curve A.
7. Which of the relationships in Questions 4 and 5 is a positive relationship and which is a
negative relationship?
The relationship in Question 4 between the two variables that move
in the same direction is a positive relationship. The relationship
in Question 5 between the two variables that move in the opposite
directions is a negative relationship.
8. What are the two ways of calculating the slope of a curved line?
To calculate the slope of a curved line we can calculate the slope at a point or across an
arc. The slope of a curved line at a point on the line is defined as
the slope of the straight line tangent to the curved line at that
point. The slope of a curved line across an arc—between two points
on the curved line—equals the slope of the straight line between the
two points.
9. How do we graph a relationship among more than two variables?
To graph a relationship among more than two variables, hold constant
the values of all the variables except two. Then plot the value of
one of the variables against the other variable.
10. Explain what change will bring a movement along a curve.
A movement along a curve occurs when the value of a variable on one
of the axes changes while all of the other relevant variables not
graphed on the axes do not change. The movement along the curve
shows the effect of the variable that changes, ceteris paribus
(holding all of the other non-graphed variables constant).
F I G U R E A l . 3
Review problem 6
5
4
3
2 _
B1 _
_t --------1---------1--------1---------1---------1---------1---------1---------1--------1---------1--------- x
2 3 4 5 6 7 8 9 10 1 1 1 2
Loading page 17...
1 2 A P P E N D I X 1
11. Explain what change will bring a shift of a curve.
A curve shifts when there is a change in the value of a relevant
variable that is not graphed on the axes. In this case the entire
curve shifts.
11. Explain what change will bring a shift of a curve.
A curve shifts when there is a change in the value of a relevant
variable that is not graphed on the axes. In this case the entire
curve shifts.
Loading page 18...
G R A P H S I N E C O N O M I C S 1 3
A n s w e r s t o t h e S t u d y P l a n P r o b l e m s a n d A p p l i c a t i o n s
Use the spreadsheet to work Problems 1
to 3. The spreadsheet provides data on
the U.S. economy: Column A is the year,
column B is the inflation rate, column C
is the interest rate, column D is the
growth rate, and column E is the
unemployment rate.
1. Draw a scatter diagram of the inflation rate and the interest rate. Describe the relationship.
To make a scatter diagram of the inflation rate and the interest
rate, plot the inflation rate on the x-axis and the interest rate on
the y-axis. The graph will be a set of dots and is shown in Figure
A1.4. The pattern made by the dots tells us that as the inflation
rate increases, the interest rate usually increases so there is a
(weak) positive relationship.
2. Draw a scatter diagram of the growth rate and the unemployment rate. Describe the
relationship.
To make a scatter diagram of the growth rate and the unemployment
rate, plot the growth rate on the x-axis and the unemployment rate
on the y-axis. The graph will be a set of dots and is shown in
Figure A1.5. The pattern made by the dots tells us that when the
A B C D E
1 2006 2.5 4.9 2.7 4.6
2 2007 4.1 4.5 1.8 4.6
3 2008 0.1 1.4 −0.3 5.8
4 2009 2.7 0.2 −2.8 9.3
5 2010 1.5 0.1 2.5 9.6
6 2011 3.0 0.1 1.6 8.9
7 2012 1.7 0.1 2.2 8.1
8 2013 1.5 0.1 1.7 7.4
9 2014 0.8 0.0 2.4 6.2
10 2015 0.7 0.1 2.6 5.3
11 2016 2.1 0.3 1.6 4.9
F I G U R E A l . 4
Problem 1
F I G U R E A l .5
Problem 2
Unemployment rate (percent)
O
o
o
2
3 4 5
Inflation rate (percent)
4 6
Growth rate (percent)
Loading page 19...
1 4 A P P E N D I X 1
growth rate increases, the unemployment rate usually decreases so
there is a negative relationship.
3. Draw a scatter diagram of the interet rate and the unemployment rate. Describe the
relationship.
To make a scatter diagram of the
interest rate and the
unemployment rate, plot the
interest rate on the x-axis and
the unemployment rate on the y-
axis. The graph will be a set of
dots and is shown in Figure
A1.6. The pattern made by the
dots tells us that when the
interest rate increases, the
unemployment rate usually
decreases so there is a negative
relationship.
Use the following news clip to work Problems 4 to 6.
Lego Shatters More Records:
Source: Boxofficemojo.com,
Data for weekend of March 10-12, 2017
4. Draw a graph of the relationship
between the revenue per theater
on the y-axis and the number of
theaters on the x-axis. Describe
the relationship.
Figure A1.7 shows the
relationship. As the
figure shows, there is a
positive relationship.
5. Calculate the slope of the relationship in
Problem 4 between 3,846 and 4,071
theaters.
The slope equals the change in
revenue per theater divided by
the change in the number of
theaters. The slope equals
($15,867 − $9,362)/(3,846 −
Movie
Theate
rs
(numbe
r)
Revenue
(dollars per
theater)
Kong: Skull
Island
3,846 $15,867
Logan 4,071 $9,362
Get Out ,143 $6,600
The Sha 2,888 $3,465
F I G U R E A l . 6
Problem 3
2
1 2 3 4 5 6
Interest rate (percent)
F I G U R E A 1 . 7
Problem 4
housands of dollars)
15
I 100>
5
©2018 Pearson Educat
o
o
)o
o
2,000 2,500 3,000 3,500 4,000
Theaters (number)
Loading page 20...
G R A P H S I N E C O N O M I C S 1 5
4,071) which equals −$28.91 per theater.
6. Calculate the slope of the relationship in Problem 4 between 4,071 and 3,143 theaters.
The slope equals the change in revenue per theater divided by the
change in the number of theaters. The slope equals ($9,362 −
$6,600)/(4,071 − 3,143 which equals $2.98 per theater.
Loading page 21...
1 6 A P P E N D I X 1
7. Calculate the slope of the relationship
shown in Figure A1.8.
The slope is −5/4. The curve is
a straight line, so its slope is
the same at all points on the
curve. Slope equals the change
in the variable on the y-axis
divided by the change in the
variable on the x-axis. To
calculate the slope, you must
select two points on the line.
One point is at 10 on the y-axis
and 0 on the x-axis, and another
is at 8 on the x-axis and 0 on
the y-axis. The change in y from
10 to 0 is associated with the
change in x from 0 to 8.
Therefore the slope of the curve
equals −10/8, which equals −5/4.
Use the relationship shown in Figure A1.9 to work Problems 8 and 9.
8. Calculate the slope of the relationship at
point A and at point B.
The slope at point A is −2, and
the slope at point B is −0.25.
To calculate the slope at a
point on a curved line, draw the
tangent to the curved line at
the point. Then find a second
point on the tangent and
calculate the slope of the
tangent.
The tangent at point A cuts the
y-axis at 10. The slope of the
tangent equals the change in y
divided by the change in x. The
change in y equals −4 (6 minus
10) and the change in x equals 2
(2 minus 0). The slope at point
A is −4/2, which equals −2.
Similarly, the slope at point B is −0.25. The tangent at point B
goes through the point (4, 2). The change in y equals 0.5, and the
change in x equals −2. The slope at point B is −0.25.
F I G U R E A l . 8
Problem 7
y
10
8
6
4
2
0 12.04.0 8.0
F I G U R E A l . 9
Problems 8 and 9
10.0
8.0
6.0
4.0
1.5
— x
10
Loading page 22...
G R A P H S I N E C O N O M I C S 1 7
9. Calculate the slope across the arc AB.
The slope across the arc AB is −1.125. The slope across an arc AB
equals the change in y, which is 4.5 (6.0 minus 1.5) divided by the
change in x, which equals −4 (2 minus 6). The slope across the arc
AB equals 4.5/−4, which is −1.125.
Price
(dollar
s per
ride)
Balloon rides
(number per day)
50F 70F 90F
5 32 40 50
10 27 32 40
15 18 27 32
Loading page 23...
1 8 A P P E N D I X 1
Use the table to work Problems 10 and 11. The table gives the price of a balloon ride, the
temperature, and the number of rides a day.
10. Draw a graph to show the relationship between the price and the number of rides, when
temperature is 70°F. Describe this relationship.
Figure A1.10 shows the
relationship between the price
and the number of balloon rides
when the temperature is 70F.
The relationship between the
price and the number of rides is
inverse; that is, when the price
rises, the number of rides
decreases.
11. What happens in the graph in Problem 10 if
the temperature rises to 90°F?
If the temperature rises to
90F, the curve shifts
rightward. This shift is
illustrated in Figure A1.11. In
that figure, both the initial
curve, which applies when the
temperature is 70F, and the new
curve, which applies when the
temperature is 90F, are
illustrated. The curve when the
temperature is 90F lies to the
right of the curve when the
temperature is 70F indicating
that at every price, more
balloon rides are taken when the
temperature is 90F rather than
70F.
FIGURE A l . 1 0
Problem 10
15.00
10.00
5.00
5 10 15 20 25 30 35 40 45 50
Number of rides
FIGURE A l . 1 1
Problem 11
5.00
5 10 15 20 25 30 35 40 45 50
Number of rides
Loading page 24...
G R A P H S I N E C O N O M I C S 1 9
Answers to Additional Problems and Applications
Use the spreadsheet to work Problems
12 to 14. The spreadsheet provides data
on oil and gasoline: Column A is the
year, column B is the price of oil (dollars
per barrel), column C is the price of
gasoline (cents per gallon), column D is
U.S. oil production, and column E is the
U.S. quantity of gasoline refined (both in
millions of barrels per day).
12. Draw a scatter diagram of the price of oil and the quantity of U.S. oil produced. Describe the
relationship.
Figure A1.12 shows the scatter diagram between the price of a barrel
of oil and the quantity of U.S. oil produced. It shows a weak
negative relationship.
13. Draw a scatter diagram of the price of gasoline and the quantity of gasoline refined.
Describe the relationship.
Figure A1.13 shows the scatter diagram between the price of a gallon
of gasoline and the quantity of gasoline refined. It shows a weak
negative relationship.
A B C D E
1 2006 66 262 5.1 15.6
2 2007 72 284 5.1 15.4
3 2008 100 330 5.0 15.3
4 2009 62 241 5.4 14.8
5 2010 79 284 5.5 15.2
6 2011 95 354 5.7 15.1
7 2012 94 364 6.5 15.5
8 2013 98 353 7.5 15.2
9 2014 93 344 8.8 15.5
10 2015 49 252 9.4 16.6
11 2016 45 225 8.9 16.4
F I G U R E A l . 1 2
Problem 12
F I G U R E A l . 1 3
Problem 13
Price (dollars per barrel of oil)
Price (cents per gallon of gasoline)
CO °
o
: O
350
300
250
200
150
5.0 14.8 15.2 15.6 16.0 16.4 16.86.0 7.0 8.0 9.0 10.0
U.S. oil production (millions of barrels per day) U.S. gasoline refined (millions of barrels per day)
Loading page 25...
2 0 A P P E N D I X 1
14. Draw a scatter diagram of the quantity of U.S. oil produced and the quantity of gasoline
refined. Describe the relationship.
Figure A1.14 shows the scatter
diagram between the quantity of
U.S. oil produced and the
quantity of gasoline refined. It
shows a positive relationship.
Use the following data to work Problems 15 to 17.
Draw a graph that shows the relationship
between the two variables x and y in the
table to the right.
To make a graph that shows the
relationship between x and y,
plot the x variable on the x-axis
and the y variable on the y-axis.
Figure A1.15 shows this graph.
15. a. Is the relationship positive or negative?
The relationship is negative
because x and y move in opposite
directions: As x increases, y
decreases.
b. Does the slope of the relationship become
steeper or flatter as the value of x increases?
The slope becomes steeper as x
increases.
c. Think of some economic relationships that
might be similar to this one.
The less expensive a good, the
greater is the number of people
who buy it. The higher the interest rate, the smaller is the number
of people who take out home mortgages. The less expensive gasoline,
the greater the miles car owners drive.
x 0
1
2 3
4
5
y 25 24 22 18 12 0
F I G U R E A l . 1 4
Problem 14
10.0
9.0
8.0
U.S. oil production [millions of barrels per day)
O O
14.8 15.2 16.0 16.4
U.S. gasoline refined (millions of barrels per day)
r i u u n c M i . i j
Problem 15
y
256
20
15
10
5 -
X
Loading page 26...
G R A P H S I N E C O N O M I C S 2 1
16. Calculate the slope of the relationship between x and y when x equals 3.
The slope equals −4.0. The slope of the curve at the point where x
is 3 is equal to the slope of the tangent to the curve at that
point. Plot the relationship and then draw the tangent line at the
point where x is 3 and y is 18. Now calculate the slope of this
tangent line by finding another point on the tangent. When x equals
5, y equals 10 on the tangent, so another point is x equals 5 and y
equals 10. The slope equals the change in y, 8, divided by the
change in x, −2, so the slope is −4.0.
17. Calculate the slope of the relationship across the arc as x increases from 4 to 5.
The slope is –12. The slope of the relationship across the arc when
x increases from 4 to 5 is equal to the slope of the straight line
joining the points on the curve at x equals 4 and x equals 5. When x
increases from 4 to 5, y falls from 12 to 0. The slope equals the
change in y, 12 (12 minus 0), divided by the change in x, −1 (4
minus 5), so the slope across the arc is −12.0.
18. Calculate the slope of the curve in Figure
A1.16 at point A.
The slope is −2. The curve is a
straight line, so its slope is
the same at all points on the
curve. Slope equals the change in
the variable on the y-axis
divided by the change in the
variable on the x-axis. To
calculate the slope, select two
points on the line. One point is
at 18 on the y-axis and 0 on the
x-axis, and another is at 9 on
the x-axis and 0 on the y-axis.
The change in y from 18 to 0 is
associated with the change in x
from 0 to 9. Therefore the slope
of the curve equals −18/9, which
equals −2.
Use Figure A1.17to work Problems 19 and 20.
19. Calculate the slope at point A and at point B.
The slope at point A is −4, and
the slope at point B is −1. To
calculate the slope at a point on
a curved line, draw the tangent
to the line at the point. Then
F I G U R E A l . 1 6
Problem 18
y
18
10
X
0 4 9
F I G U R E A l .1 7
Problems 19 and 20
4
©2018 Pearson Educatio
8
2
2
Loading page 27...
2 2 A P P E N D I X 1
find a second point on the tangent and calculate the slope of the
tangent.
The tangent at point A cuts the x-axis at 2.5. The slope of the
tangent equals the change in y divided by the change in x. The
change in y equals 6 (6 minus 0) and the change in x equals −1.5 (1
minus 2.5). The slope at point A is 6/−1.5, which equals −4.
Similarly, the slope at point B is −1. The tangent at point B cuts
the y-axis at 5. The change in y equals 3, and the change in x
equals −3. The slope at point B is −1.
20. Calculate the slope across the arc AB.
The slope across the arc AB is −2. The slope across the arc AB
equals the change in y, which is 4 (6 minus 2) divided by the change
in x, which equals −2 (1 minus 3). The slope across the arc AB
equals 4/−2, which equals −2.
Use the following table to work Problems 21 to 23.
The table gives information about umbrellas:
price, the number purchased, and rainfall in
inches.
21. Draw a graph to show the relationship
between the price and the number of
umbrellas purchased, holding the
amount of rainfall constant at 1 inch.
Describe this relationship.
Figure A1.18 shows the
relationship. To draw a
graph of the relationship between
the price and the number of
umbrellas when the rainfall
equals 1 inch, keep the rainfall
at 1 inch and plot the data in
that column against the price.
This curve is the relationship
between price and number of
umbrellas when the rainfall is 1
inches. The relationship between
the price and the number of
umbrellas is an inverse
relationship; as the price rises,
the number of umbrellas
decreases.
22. What happens in the graph in Problem 21 if
the price rises and rainfall is constant?
If the price rises, the number of umbrellas decreases. In Figure
A1.18, there is a movement upward along the (unchanged) curve.
Price
(dollar
s per
umbrell
a)
Umbrellas
(numbers per day)
0 1 2
(inches of rainfall)
20 4 7 8
30 2 4 7
4 2 4F I G U R E A l . 1 8
Problem 21
1 2 3 4 5 6 7 8
Umbrellas (number)
Loading page 28...
G R A P H S I N E C O N O M I C S 2 3
23. What happens in the graph in Problem 21 if
the rainfall increases from 1 inch to 2 inches?
As shown in Figure A1.19, the
curve shifts rightward. In that
figure, both the initial curve,
which applies when the rainfall
is 1 inch, and the new curve,
which applies when the rainfall
is 2 inches, are illustrated. The
curve when the rainfall is 2
inches lies to the right of the
curve when the rainfall is 1 inch
indicating that at every price,
more umbrellas are purchased when
the rainfall is 2 inches than
when the rainfall is 1 inch.
F I G U R E A 1 . 1 9
Problem 23
Price (dollars per umbrella)
NJ co
o o o
1 2 3 4 5 6 7 8
Umbrellas (number)
Loading page 29...
A n s w e r s t o t h e R e v i e w Q u i z z e s
Page 36
1. How does the production possibilities frontier illustrate scarcity?
The unattainable combinations of production that lie beyond the PPF illustrate the concept of
scarcity. There simply are not enough resources to produce any of these combinations of outputs.
Additionally, while moving along the PPF to increase the production of one good requires that
the production of another good be reduced, which also illustrates scarcity.
2. How does the production possibilities frontier illustrate production efficiency?
The combinations of outputs that lie on the PPF illustrate the concept of production efficiency.
These points are the maximum production points possible and are attained only by producing
the goods and services at the lowest possible cost. Any point inside the frontier reflects
production where one or both outputs may be increased without decreasing the other output
level. Clearly, such points cannot be production efficient.
3. How does the production possibilities frontier show that every choice involves a tradeoff?
Movements along the PPF frontier illustrate that producing more of one good requires producing
less of other good. This observation reflects the result that a tradeoff must be made when
producing output efficiently.
4. How does the production possibilities frontier illustrate opportunity cost?
The negative slope of the production possibility curve illustrates the concept of opportunity cost.
Moving along the production possibility frontier, producing additional units of a good requires
that the output of another good must fall. This sacrifice is the opportunity cost of producing more
of the first good.
5. Why is opportunity cost a ratio?
The slope of the PPF is a ratio that expresses the quantity of lost production of the good on the y-
axis to the increase in the production of the good on the x-axis moving downward along the PPF.
The steeper the slope, the greater ratio, and the greater is the opportunity cost of increasing the
output of the good measured on the horizontal axis.
6. Why does the PPF bow outward and what does that imply about the relationship between
opportunity cost and the quantity produced?
Some resources are better suited to produce one type of good or service, like pizza. Other
resources are better suited to produce other goods or services, like DVDs. If society allocates
resources wisely, it will use each resource to produce the kind of output for which it is best
suited. Consider a PPF with pizza measured on the x-axis and DVDs measured on the y-axis. A
small increase in pizza output when pizza production is relatively low requires only a small
increase in the use of those resources still good at making pizza and not good at making DVDs.
This yields a small decrease in DVD production for a large increase in pizza production, creating
a relatively low opportunity cost reflected in the gentle slope of the PPF over this range of output.
However, the same small increase in pizza output when pizza production is relatively large will
require society to devote to pizza production those resources that are less suited to making pizza
2 THE ECONOMIC
PROBLEM
C h a p t e r
Loading page 30...
2 2 C H A P T E R 2
and more suited to making DVDs. This reallocation of resources yields a relatively small increase
in pizza output for a large decrease in DVD output, creating a relatively high opportunity cost
reflected in the steep slope of the PPF over this range of output. The opportunity cost of pizza
production increases with the quantity of pizza produced as the slope of the PPF becomes ever
steeper. This effect creates the bowed out effect (the concavity of the PPF function) and means
that as more of a good is produced, the opportunity cost of producing additional units increases.
Page 39
1. What is marginal cost? How is it measured?
Marginal cost is the opportunity cost of producing one more unit of a good or service. Along a PPF
marginal cost is reflected in the absolute value of the slope of the PPF. In particular, the
magnitude of the slope of the PPF is the marginal cost of a unit of the good measured along the x-
axis. As the magnitude of the slope changes moving along the PPF, the marginal cost changes.
2. What is marginal benefit? How is it measured?
The marginal benefit from a good or service is the benefit received from consuming one more
unit of it. It is measured by what an individual is willing to give up (or pay) for an additional that
last unit.
3. How does the marginal benefit from a good change as the quantity produced of that good
increases?
As the more of a good is consumed, the marginal benefit received from each unit is smaller than
the marginal benefit received from the unit consumed immediately before it, and is larger than
the marginal benefit from the unit consumed immediately after it. This set of results is known as
the principle of decreasing marginal benefit and is often assumed by economists to be a common
characteristic of an individual’s preferences over most goods and services in the economy.
4. What is allocative efficiency and how does it relate to the production possibilities frontier?
Production efficiency occurs when production takes place at a point on the PPF. This indicates
that all available resources are being used for production and society cannot produce additional
units of one good or service without reducing the output of another good or service. Allocative
efficiency, however, requires that the goods and services produced are those that provide the
greatest possible benefit. This definition means that the allocative efficient level of output is the
point on the PPF (and hence is a production efficient point) for which the marginal benefit equals
the marginal cost.
5. What conditions must be satisfied if resources are used efficiently?
Resources are used efficiently when more of one good or service cannot be produced without
producing less of some of another good or service that is valued more highly. This is known as
allocative efficiency and it occurs when: 1) production efficiency is achieved, and 2) the marginal
benefit received from the last unit produced is equal to the marginal cost of producing the last
unit.
Page 44
1. What gives a person a comparative advantage?
A person has a comparative advantage in an activity if that person can perform the activity at a
lower opportunity cost than anyone else, If the person gives up the least amount of other goods
and services to produce a particular good or service, the person has the lowest opportunity cost
of producing that good or service.
2. Distinguish between comparative advantage and absolute advantage.
A person has a comparative advantage in producing a good when he or she has the lowest
opportunity cost of producing it. Comparative advantage is based on the output forgone. A person
Loading page 31...
30 more pages available. Scroll down to load them.
Preview Mode
Sign in to access the full document!
100%
Study Now!
XY-Copilot AI
Unlimited Access
Secure Payment
Instant Access
24/7 Support
AI Assistant
Document Details
Subject
Mathematics