Solution Manual For Health Economics, 2013th Edition

Find textbook answers quickly with Solution Manual For Health Economics, 2013th Edition, a detailed solutions manual designed to make studying easier.

Joseph Wilson
Contributor
4.4
56
5 months ago
Preview (16 of 234 Pages)
100%
Purchase to unlock

Page 1

Solution Manual For Health Economics, 2013th Edition - Page 1 preview image

Loading page image...

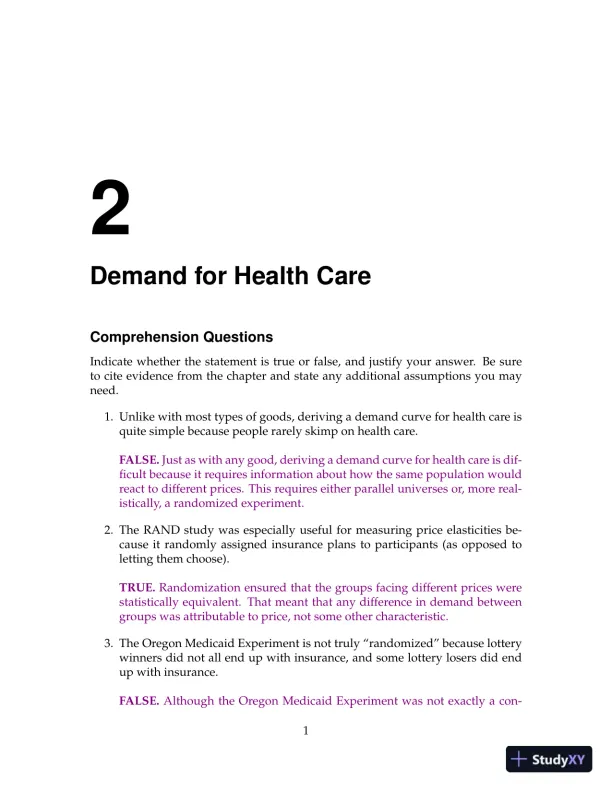
2Demand for Health CareComprehension QuestionsIndicate whether the statement is true or false, and justify your answer. Be sureto cite evidence from the chapter and state any additional assumptions you mayneed.1. Unlike with most types of goods, deriving a demand curve for health care isquite simple because people rarely skimp on health care.FALSE.Just as with any good, deriving a demand curve for health care is dif-ficult because it requires information about how the same population wouldreact to different prices. This requires either parallel universes or, more real-istically, a randomized experiment.2. The RAND study was especially useful for measuring price elasticities be-cause it randomly assigned insurance plans to participants (as opposed toletting them choose).TRUE.Randomization ensured that the groups facing different prices werestatistically equivalent. That meant that any difference in demand betweengroups was attributable to price, not some other characteristic.3. The Oregon Medicaid Experiment is not truly “randomized” because lotterywinners did not all end up with insurance, and some lottery losers did endup with insurance.FALSE.Although the Oregon Medicaid Experiment was not exactly a con-1

Page 2

Solution Manual For Health Economics, 2013th Edition - Page 2 preview image

Loading page image...

Page 3

Solution Manual For Health Economics, 2013th Edition - Page 3 preview image

Loading page image...

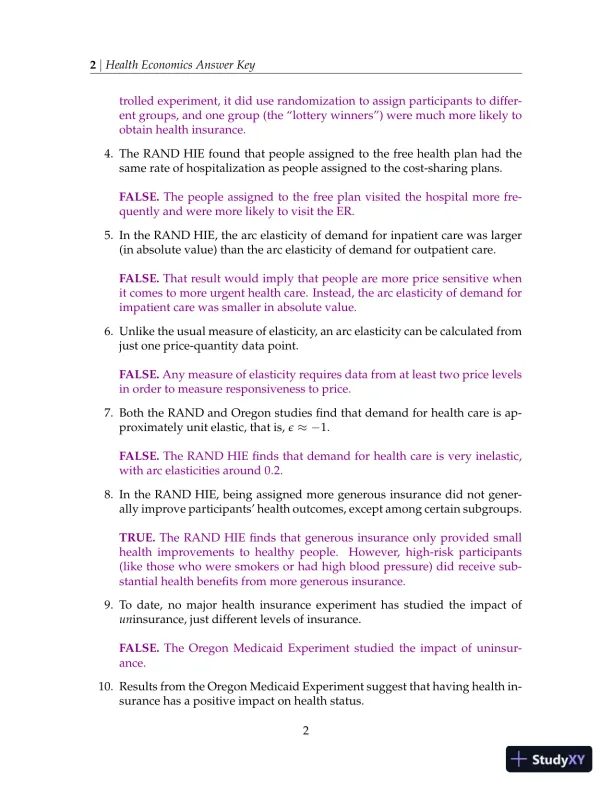
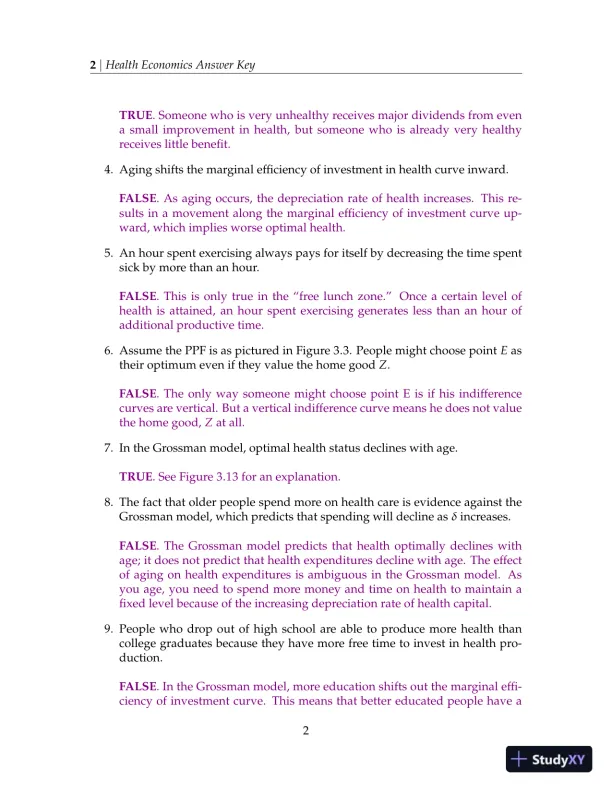
2|Health Economics Answer Keytrolled experiment, it did use randomization to assign participants to differ-ent groups, and one group (the “lottery winners”) were much more likely toobtain health insurance.4. The RAND HIE found that people assigned to the free health plan had thesame rate of hospitalization as people assigned to the cost-sharing plans.FALSE.The people assigned to the free plan visited the hospital more fre-quently and were more likely to visit the ER.5. In the RAND HIE, the arc elasticity of demand for inpatient care was larger(in absolute value) than the arc elasticity of demand for outpatient care.FALSE.That result would imply that people are more price sensitive whenit comes to more urgent health care. Instead, the arc elasticity of demand forimpatient care was smaller in absolute value.6. Unlike the usual measure of elasticity, an arc elasticity can be calculated fromjust one price-quantity data point.FALSE.Any measure of elasticity requires data from at least two price levelsin order to measure responsiveness to price.7. Both the RAND and Oregon studies find that demand for health care is ap-proximately unit elastic, that is,≈ −1.FALSE.The RAND HIE finds that demand for health care is very inelastic,with arc elasticities around 0.2.8. In the RAND HIE, being assigned more generous insurance did not gener-ally improve participants’ health outcomes, except among certain subgroups.TRUE.The RAND HIE finds that generous insurance only provided smallhealth improvements to healthy people.However, high-risk participants(like those who were smokers or had high blood pressure) did receive sub-stantial health benefits from more generous insurance.9. To date, no major health insurance experiment has studied the impact ofuninsurance, just different levels of insurance.FALSE.The Oregon Medicaid Experiment studied the impact of uninsur-ance.10. Results from the Oregon Medicaid Experiment suggest that having health in-surance has a positive impact on health status.2

Page 4

Solution Manual For Health Economics, 2013th Edition - Page 4 preview image

Loading page image...

Chapter 2|Demand for Health Care|3TRUE.Lottery winners in the Oregon Medicaid Experiment were not morelikely to survive than lottery losers, but they had better self-reported physicalhealth and mental health.3

Page 5

Solution Manual For Health Economics, 2013th Edition - Page 5 preview image

Loading page image...

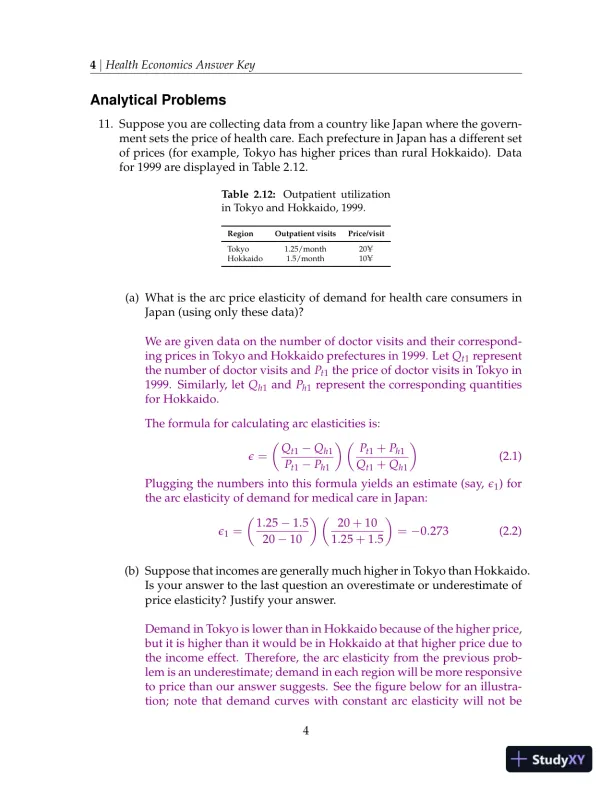
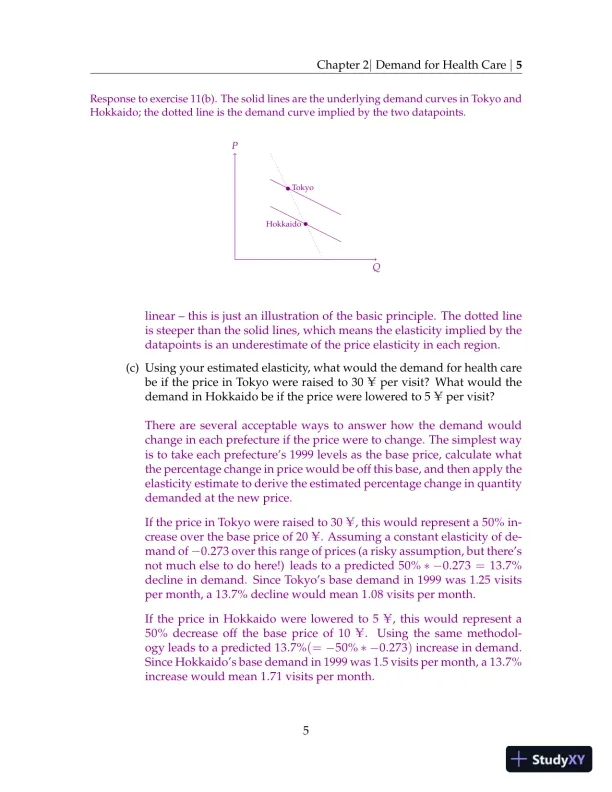
4|Health Economics Answer KeyAnalytical Problems11. Suppose you are collecting data from a country like Japan where the govern-ment sets the price of health care. Each prefecture in Japan has a different setof prices (for example, Tokyo has higher prices than rural Hokkaido). Datafor 1999 are displayed in Table 2.12.Table 2.12:Outpatient utilizationin Tokyo and Hokkaido, 1999.RegionOutpatient visitsPrice/visitTokyo1.25/month20UHokkaido1.5/month10U(a) What is the arc price elasticity of demand for health care consumers inJapan (using only these data)?We are given data on the number of doctor visits and their correspond-ing prices in Tokyo and Hokkaido prefectures in 1999. LetQt1representthe number of doctor visits andPt1the price of doctor visits in Tokyo in1999. Similarly, letQh1andPh1represent the corresponding quantitiesfor Hokkaido.The formula for calculating arc elasticities is:=(Qt1Qh1Pt1Ph1) (Pt1+Ph1Qt1+Qh1)(2.1)Plugging the numbers into this formula yields an estimate (say,1) forthe arc elasticity of demand for medical care in Japan:1=(1.251.52010) (20+101.25+1.5)=0.273(2.2)(b) Suppose that incomes are generally much higher in Tokyo than Hokkaido.Is your answer to the last question an overestimate or underestimate ofprice elasticity? Justify your answer.Demand in Tokyo is lower than in Hokkaido because of the higher price,but it is higher than it would be in Hokkaido at that higher price due tothe income effect. Therefore, the arc elasticity from the previous prob-lem is an underestimate; demand in each region will be more responsiveto price than our answer suggests. See the figure below for an illustra-tion; note that demand curves with constant arc elasticity will not be4

Page 6

Solution Manual For Health Economics, 2013th Edition - Page 6 preview image

Loading page image...

Chapter 2|Demand for Health Care|5Response to exercise 11(b). The solid lines are the underlying demand curves in Tokyo andHokkaido; the dotted line is the demand curve implied by the two datapoints.QPHokkaidoTokyolinear – this is just an illustration of the basic principle. The dotted lineis steeper than the solid lines, which means the elasticity implied by thedatapoints is an underestimate of the price elasticity in each region.(c) Using your estimated elasticity, what would the demand for health carebe if the price in Tokyo were raised to 30Uper visit? What would thedemand in Hokkaido be if the price were lowered to 5Uper visit?There are several acceptable ways to answer how the demand wouldchange in each prefecture if the price were to change. The simplest wayis to take each prefecture’s 1999 levels as the base price, calculate whatthe percentage change in price would be off this base, and then apply theelasticity estimate to derive the estimated percentage change in quantitydemanded at the new price.If the price in Tokyo were raised to 30U, this would represent a 50% in-crease over the base price of 20U. Assuming a constant elasticity of de-mand of0.273 over this range of prices (a risky assumption, but there’snot much else to do here!) leads to a predicted 50%∗ −0.273=13.7%decline in demand. Since Tokyo’s base demand in 1999 was 1.25 visitsper month, a 13.7% decline would mean 1.08 visits per month.If the price in Hokkaido were lowered to 5U, this would represent a50% decrease off the base price of 10U.Using the same methodol-ogy leads to a predicted 13.7%(=50%∗ −0.273)increase in demand.Since Hokkaido’s base demand in 1999 was 1.5 visits per month, a 13.7%increase would mean 1.71 visits per month.5

Page 7

Solution Manual For Health Economics, 2013th Edition - Page 7 preview image

Loading page image...

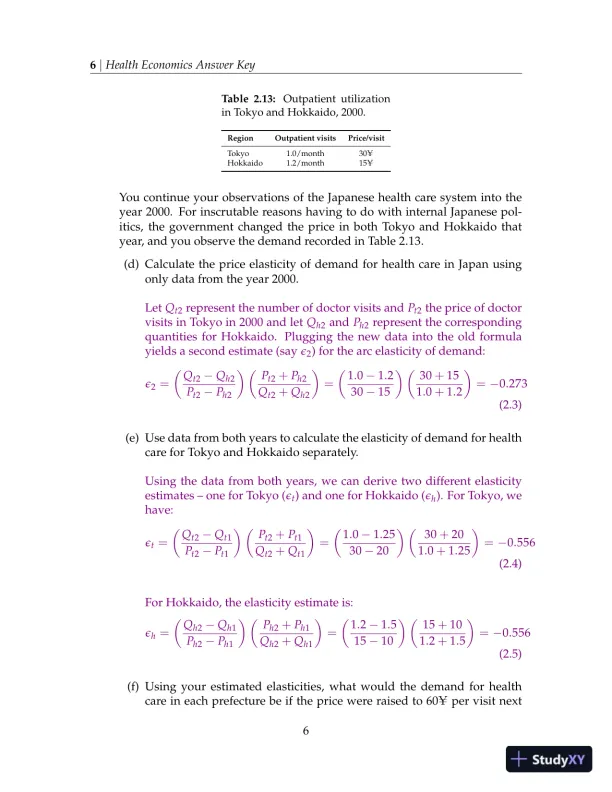
6|Health Economics Answer KeyTable 2.13:Outpatient utilizationin Tokyo and Hokkaido, 2000.RegionOutpatient visitsPrice/visitTokyo1.0/month30UHokkaido1.2/month15UYou continue your observations of the Japanese health care system into theyear 2000. For inscrutable reasons having to do with internal Japanese pol-itics, the government changed the price in both Tokyo and Hokkaido thatyear, and you observe the demand recorded in Table 2.13.(d) Calculate the price elasticity of demand for health care in Japan usingonly data from the year 2000.LetQt2represent the number of doctor visits andPt2the price of doctorvisits in Tokyo in 2000 and letQh2andPh2represent the correspondingquantities for Hokkaido.Plugging the new data into the old formulayields a second estimate (say2) for the arc elasticity of demand:2=(Qt2Qh2Pt2Ph2) (Pt2+Ph2Qt2+Qh2)=(1.01.23015) (30+151.0+1.2)=0.273(2.3)(e) Use data from both years to calculate the elasticity of demand for healthcare for Tokyo and Hokkaido separately.Using the data from both years, we can derive two different elasticityestimates – one for Tokyo (t) and one for Hokkaido (h). For Tokyo, wehave:t=(Qt2Qt1Pt2Pt1) (Pt2+Pt1Qt2+Qt1)=(1.01.253020) (30+201.0+1.25)=0.556(2.4)For Hokkaido, the elasticity estimate is:h=(Qh2Qh1Ph2Ph1) (Ph2+Ph1Qh2+Qh1)=(1.21.51510) (15+101.2+1.5)=0.556(2.5)(f) Using your estimated elasticities, what would the demand for healthcare in each prefecture be if the price were raised to 60Uper visit next6

Page 8

Solution Manual For Health Economics, 2013th Edition - Page 8 preview image

Loading page image...

Chapter 2|Demand for Health Care|7year (for both prefectures)?If the price of doctor visits were raised to 60Uin 2001 in Tokyo, thiswould represent a 100% increase over the price of 30Uin 2000. Apply-ing thetestimate of demand elasticity in Tokyo yields a predicted de-crease in demand of 55.6%(=100%∗ −0.556)from year 2000 demandlevels. This yields a predicted 1.00.444=0.444 visits per month in2001 in Tokyo.If the price of doctor visits were raised to 60Uin 2001 in Hokkaido, thiswould represent a 300% increase over the price of 15Uin 2000. Apply-ing thehestimate of demand elasticity in Hokkaido yields a predicteddecrease in demand of 166.7%(300%∗ −0.556)from year 2000 de-mand levels. We would predict no outpatient visits at all in Hokkaidoin 2001! This is of course very unlikely; this result illustrates the limita-tions of assuming a constant elasticity.(g) Combine the Tokyo and Hokkaido estimates from exercise 11(e) to geta single estimate of the price elasticity of health care demand for all ofJapan. Assume that Tokyo is five times as populous as all of Hokkaido.To combine these elasticity estimates into a single national estimate (say3), we can take a simple population weighted average of the two elas-ticity estimates,tandh, from the two prefectures. LetPtbe the popula-tion of Tokyo, and letPhbe the population of Hokkaido. The populationaverage estimate is:3=tPt+hPhPt+Ph(2.6)We are given thatPt=5Ph, so this expression can be simplified:3=5tPh+hPh5Ph+Ph=5t+h6(2.7)Applying this formula yields an elasticity estimate of3=0.556.Since the estimated elasticities were the same in each region, it wouldhave been easy to jump straight to this answer without doing any math.12.Preventative carerefers to care taken to prevent future diseases rather thanto treat current ones. Compared to emergency room care, preventative careis rarely urgent, and benefits can be difficult to measure – if you had the fluvaccine this year but did not catch the flu, it is impossible to tell if it was theshot or assiduous hand washing that preserved you.7

Page 9

Solution Manual For Health Economics, 2013th Edition - Page 9 preview image

Loading page image...

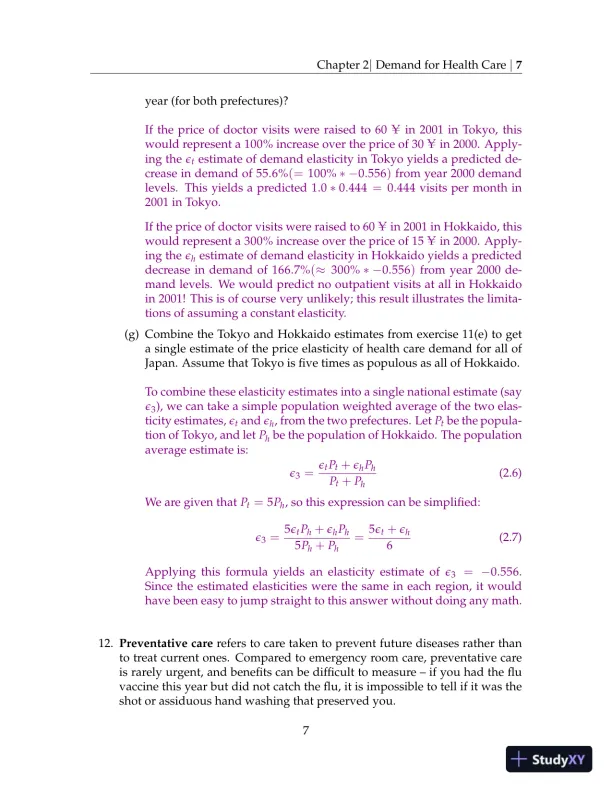
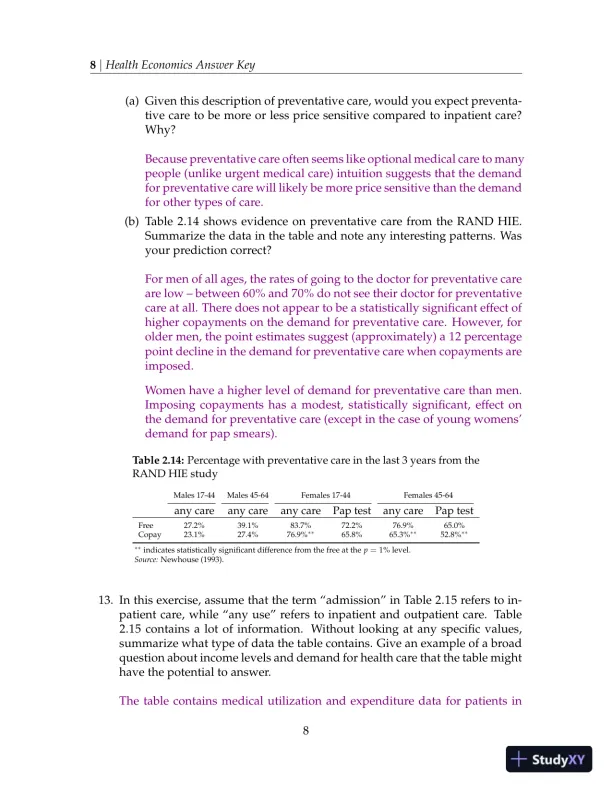
8|Health Economics Answer Key(a) Given this description of preventative care, would you expect preventa-tive care to be more or less price sensitive compared to inpatient care?Why?Because preventative care often seems like optional medical care to manypeople (unlike urgent medical care) intuition suggests that the demandfor preventative care will likely be more price sensitive than the demandfor other types of care.(b) Table 2.14 shows evidence on preventative care from the RAND HIE.Summarize the data in the table and note any interesting patterns. Wasyour prediction correct?For men of all ages, the rates of going to the doctor for preventative careare low – between 60% and 70% do not see their doctor for preventativecare at all. There does not appear to be a statistically significant effect ofhigher copayments on the demand for preventative care. However, forolder men, the point estimates suggest (approximately) a 12 percentagepoint decline in the demand for preventative care when copayments areimposed.Women have a higher level of demand for preventative care than men.Imposing copayments has a modest, statistically significant, effect onthe demand for preventative care (except in the case of young womens’demand for pap smears).Table 2.14:Percentage with preventative care in the last 3 years from theRAND HIE studyMales 17-44Males 45-64Females 17-44Females 45-64any careany careany carePap testany carePap testFree27.2%39.1%83.7%72.2%76.9%65.0%Copay23.1%27.4%76.9%∗∗65.8%65.3%∗∗52.8%∗∗∗∗indicates statistically significant difference from the free at thep=1% level.Source:Newhouse (1993).13. In this exercise, assume that the term “admission” in Table 2.15 refers to in-patient care, while “any use” refers to inpatient and outpatient care. Table2.15 contains a lot of information.Without looking at any specific values,summarize what type of data the table contains. Give an example of a broadquestion about income levels and demand for health care that the table mighthave the potential to answer.The table contains medical utilization and expenditure data for patients in8

Page 10

Solution Manual For Health Economics, 2013th Edition - Page 10 preview image

Loading page image...

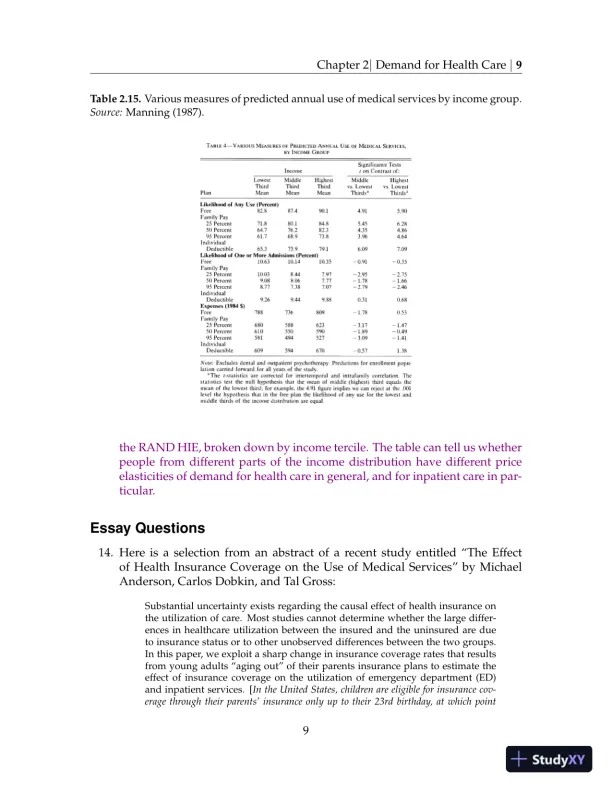
Chapter 2|Demand for Health Care|9Table 2.15.Various measures of predicted annual use of medical services by income group.Source:Manning (1987).the RAND HIE, broken down by income tercile. The table can tell us whetherpeople from different parts of the income distribution have different priceelasticities of demand for health care in general, and for inpatient care in par-ticular.Essay Questions14. Here is a selection from an abstract of a recent study entitled “The Effectof Health Insurance Coverage on the Use of Medical Services” by MichaelAnderson, Carlos Dobkin, and Tal Gross:Substantial uncertainty exists regarding the causal effect of health insurance onthe utilization of care. Most studies cannot determine whether the large differ-ences in healthcare utilization between the insured and the uninsured are dueto insurance status or to other unobserved differences between the two groups.In this paper, we exploit a sharp change in insurance coverage rates that resultsfrom young adults “aging out” of their parents insurance plans to estimate theeffect of insurance coverage on the utilization of emergency department (ED)and inpatient services. [In the United States, children are eligible for insurance cov-erage through their parents’ insurance only up to their 23rd birthday, at which point9

Page 11

Solution Manual For Health Economics, 2013th Edition - Page 11 preview image

Loading page image...

10|Health Economics Answer Keythey lose eligibility.] Using the National Health Interview Survey (NHIS) and acensus of emergency department records and hospital discharge records fromseven states, we find that aging out results in an abrupt 5 to 8 percentage pointreduction in the probability of having health insurance. We find that not havinginsurance leads to a 40 percent reduction in ED visits and a 61 percent reductionin inpatient hospital admissions.(a) This study does not use randomization to assign people to different in-surance plans. What two groups are being compared in this study?This study compared people who were just under age 23 and just overage 23. Because of the law regarding coverage through parents’ insur-ance, these groups have significantly different rates of insurance cover-age.(b) Identify at least one important methodological differences between thedesign of this study and the RAND HIE. Give a hypothetical reason thatthis difference would bias the results.One important difference is that the study does not use randomization,but instead compares two similar groups with different health insur-ance coverage rates (those under age 23 and those over age 23).Thismethodology could bias the results if people over age 23 have less needfor inpatient care than people under 23.In that case, a “natural” de-cline in inpatient use among 23-year-olds would be wrongly attributedto increased uninsurance.(c) Are the findings of this study generally consistent with the findingsfrom the Oregon Medicaid Experiment?No. The Oregon Medicaid Experiment found that having health insur-ance had little to no effect on emergency room visits or inpatient stays,but this study finds that having health insurance makes patients muchmore likely to visit the emergency room and much more likely to receiveinpatient care.10

Page 12

Solution Manual For Health Economics, 2013th Edition - Page 12 preview image

Loading page image...

3Demand for Health: The GrossmanModelComprehension QuestionsIndicate whether the statement is true or false, and justify your answer. Be sureto cite evidence from the chapter and state any additional assumptions you mayneed.Review the basic assumptions of the Grossman model before answeringthese questions.1. In real life, investments in health can generate long-lasting benefits, but theGrossman Model neglects this aspect of health.FALSE. One of the central features of the model is that health is (in part)an investment good. If someone invests in his health today, it will be higherboth today and in the future.2. In the framework of the Grossman model, one’s level of health is completelycontrolled by her actions. Thus, in any given period, an individual is uncon-strained in her choice of health status.FALSE. Individuals do have a lot of control over their health level, but theremay be high levels of health that they cannot achieve given time and incomeconstraints. If someone invests all her time and money in improving health,she may still not be as healthy as she would like.3. In the Grossman model, the marginal efficiency of investment in health caredeclines as health improves.1

Page 13

Solution Manual For Health Economics, 2013th Edition - Page 13 preview image

Loading page image...

2|Health Economics Answer KeyTRUE. Someone who is very unhealthy receives major dividends from evena small improvement in health, but someone who is already very healthyreceives little benefit.4. Aging shifts the marginal efficiency of investment in health curve inward.FALSE. As aging occurs, the depreciation rate of health increases. This re-sults in a movement along the marginal efficiency of investment curve up-ward, which implies worse optimal health.5. An hour spent exercising always pays for itself by decreasing the time spentsick by more than an hour.FALSE. This is only true in the “free lunch zone.”Once a certain level ofhealth is attained, an hour spent exercising generates less than an hour ofadditional productive time.6. Assume the PPF is as pictured in Figure 3.3. People might choose pointEastheir optimum even if they value the home goodZ.FALSE. The only way someone might choose point E is if his indifferencecurves are vertical. But a vertical indifference curve means he does not valuethe home good,Zat all.7. In the Grossman model, optimal health status declines with age.TRUE. See Figure 3.13 for an explanation.8. The fact that older people spend more on health care is evidence against theGrossman model, which predicts that spending will decline asδincreases.FALSE. The Grossman model predicts that health optimally declines withage; it does not predict that health expenditures decline with age. The effectof aging on health expenditures is ambiguous in the Grossman model. Asyou age, you need to spend more money and time on health to maintain afixed level because of the increasing depreciation rate of health capital.9. People who drop out of high school are able to produce more health thancollege graduates because they have more free time to invest in health pro-duction.FALSE. In the Grossman model, more education shifts out the marginal effi-ciency of investment curve. This means that better educated people have a2

Page 14

Solution Manual For Health Economics, 2013th Edition - Page 14 preview image

Loading page image...

Chapter 3|Demand for Health: The Grossman Model|3PPF that is shifted upwards relative to people with fewer years of education.Thus, better educated people spend less time sick and have more productivetime overall. See Figure 3.14.10. According to the Grossman model, people choose an optimal time to die (bar-ring any unforeseen accidents).TRUE. In the Grossman model, death occurs when it no longer makes senseto invest in health because the depreciation rate of health capital is so high.3

Page 15

Solution Manual For Health Economics, 2013th Edition - Page 15 preview image

Loading page image...

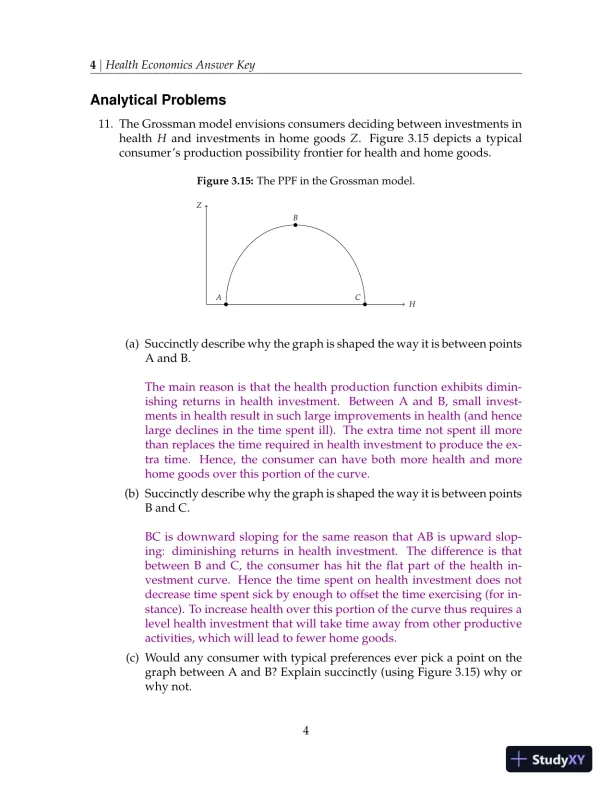
4|Health Economics Answer KeyAnalytical Problems11. The Grossman model envisions consumers deciding between investments inhealthHand investments in home goodsZ.Figure 3.15 depicts a typicalconsumer’s production possibility frontier for health and home goods.Figure 3.15:The PPF in the Grossman model.HZABC(a) Succinctly describe why the graph is shaped the way it is between pointsA and B.The main reason is that the health production function exhibits dimin-ishing returns in health investment.Between A and B, small invest-ments in health result in such large improvements in health (and hencelarge declines in the time spent ill). The extra time not spent ill morethan replaces the time required in health investment to produce the ex-tra time.Hence, the consumer can have both more health and morehome goods over this portion of the curve.(b) Succinctly describe why the graph is shaped the way it is between pointsB and C.BC is downward sloping for the same reason that AB is upward slop-ing: diminishing returns in health investment.The difference is thatbetween B and C, the consumer has hit the flat part of the health in-vestment curve.Hence the time spent on health investment does notdecrease time spent sick by enough to offset the time exercising (for in-stance). To increase health over this portion of the curve thus requires alevel health investment that will take time away from other productiveactivities, which will lead to fewer home goods.(c) Would any consumer with typical preferences ever pick a point on thegraph between A and B? Explain succinctly (using Figure 3.15) why orwhy not.4

Page 16

Solution Manual For Health Economics, 2013th Edition - Page 16 preview image

Loading page image...

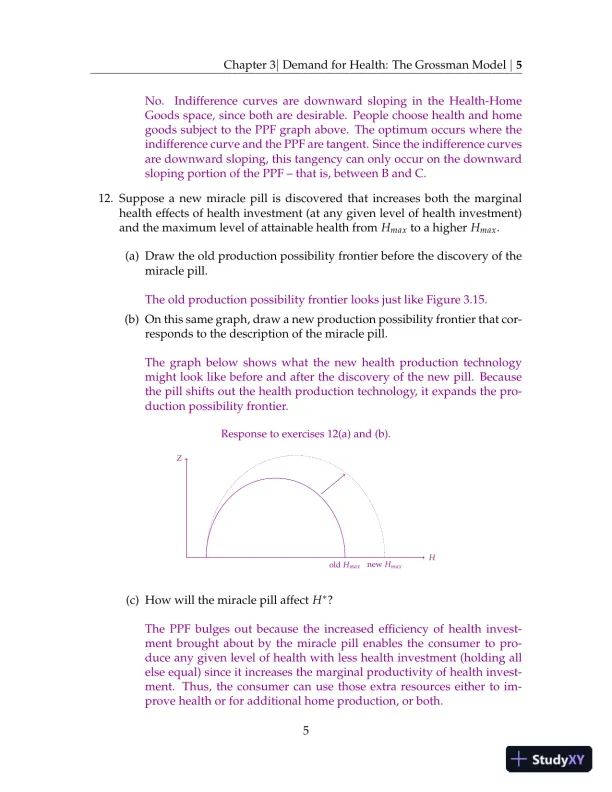
Chapter 3|Demand for Health: The Grossman Model|5No.Indifference curves are downward sloping in the Health-HomeGoods space, since both are desirable. People choose health and homegoods subject to the PPF graph above. The optimum occurs where theindifference curve and the PPF are tangent. Since the indifference curvesare downward sloping, this tangency can only occur on the downwardsloping portion of the PPF – that is, between B and C.12. Suppose a new miracle pill is discovered that increases both the marginalhealth effects of health investment (at any given level of health investment)and the maximum level of attainable health fromHmaxto a higherHmax.(a) Draw the old production possibility frontier before the discovery of themiracle pill.The old production possibility frontier looks just like Figure 3.15.(b) On this same graph, draw a new production possibility frontier that cor-responds to the description of the miracle pill.The graph below shows what the new health production technologymight look like before and after the discovery of the new pill. Becausethe pill shifts out the health production technology, it expands the pro-duction possibility frontier.Response to exercises 12(a) and (b).HZoldHmaxnewHmax(c) How will the miracle pill affectH?The PPF bulges out because the increased efficiency of health invest-ment brought about by the miracle pill enables the consumer to pro-duce any given level of health with less health investment (holding allelse equal) since it increases the marginal productivity of health invest-ment.Thus, the consumer can use those extra resources either to im-prove health or for additional home production, or both.5
Preview Mode

This document has 234 pages. Sign in to access the full document!

Study Now!

XY-Copilot AI
Unlimited Access
Secure Payment
Instant Access
24/7 Support
Document Chat

Document Details

Subject
Economics

Related Documents

View all