Solution Manual For Industrial Organization: Contemporary Theory and Empirical Applications, 5th Edition

Study more effectively with Solution Manual For Industrial Organization: Contemporary Theory and Empirical Applications, 5th Edition, a student-friendly textbook guide.

Lily Green
Contributor
4.4
46
5 months ago
Preview (16 of 162 Pages)
100%
Purchase to unlock

Page 1

Solution Manual For Industrial Organization: Contemporary Theory and Empirical Applications, 5th Edition - Page 1 preview image

Loading page image...

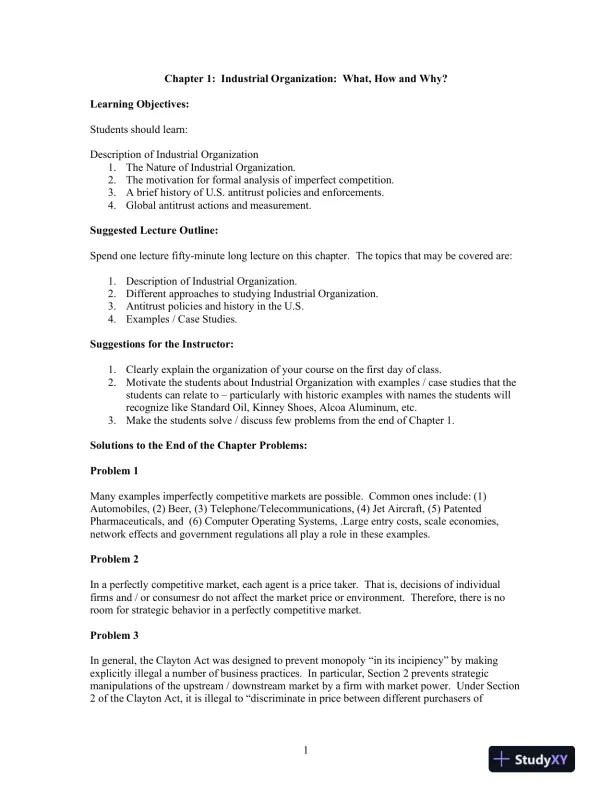
1Chapter 1: Industrial Organization: What, How and Why?Learning Objectives:Students should learn:Description of Industrial Organization1.The Nature of Industrial Organization.2.The motivation for formal analysis of imperfect competition.3.A brief history of U.S. antitrust policies and enforcements.4.Global antitrust actions and measurement.Suggested Lecture Outline:Spend one lecture fifty-minute long lecture on this chapter. The topics that may be covered are:1.Description of Industrial Organization.2.Different approaches to studying Industrial Organization.3.Antitrust policiesand history in the U.S.4.Examples / Case Studies.Suggestions for the Instructor:1.Clearly explain the organization of your course on the first day of class.2.Motivate the students about Industrial Organization with examples / case studies that thestudents can relate toparticularly with historic examples with names the students willrecognize like Standard Oil, Kinney Shoes, Alcoa Aluminum, etc.3.Make the students solve / discuss few problems from the end of Chapter 1.Solutions to the End of the Chapter Problems:Problem 1Many examples imperfectly competitive markets are possible. Common ones include: (1)Automobiles, (2) Beer, (3) Telephone/Telecommunications, (4) Jet Aircraft, (5) PatentedPharmaceuticals, and (6) Computer Operating Systems, .Large entry costs, scaleeconomies,network effects and government regulations all play a role in these examples.Problem 2In a perfectly competitive market, each agent is a price taker. That is, decisions of individualfirmsand / or consumesr do not affect the market price or environment. Therefore, there is noroom for strategic behavior in a perfectly competitive market.Problem 3In general, the Clayton Act was designed to prevent monopoly “in its incipiency” by makingexplicitly illegal a number of business practices. In particular, Section 2 prevents strategicmanipulations of the upstream / downstream market by a firm with market power. Under Section2 of the Clayton Act, it is illegal to “discriminate in price between different purchasers of

Page 2

Solution Manual For Industrial Organization: Contemporary Theory and Empirical Applications, 5th Edition - Page 2 preview image

Loading page image...

Page 3

Solution Manual For Industrial Organization: Contemporary Theory and Empirical Applications, 5th Edition - Page 3 preview image

Loading page image...

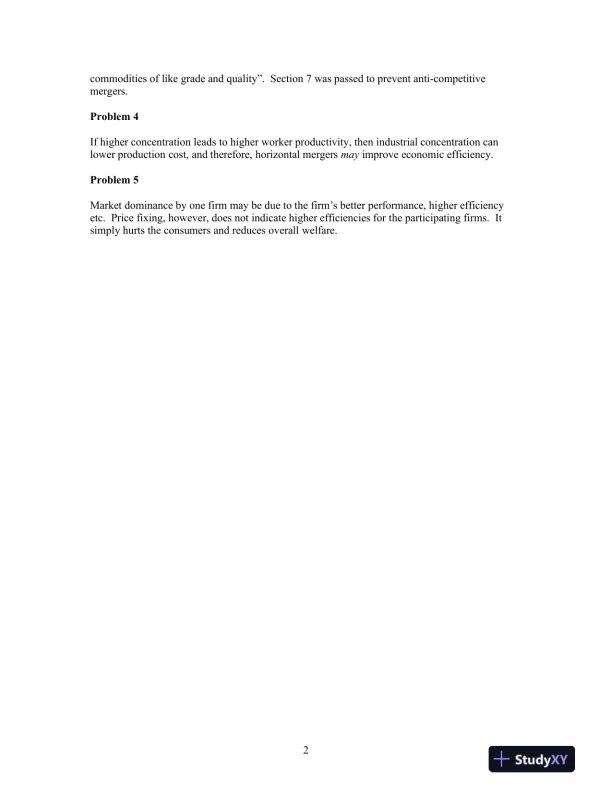
2commodities of like grade and quality”. Section 7 was passed to prevent anti-competitivemergers.Problem 4If higher concentration leads to higher worker productivity, then industrial concentration canlower production cost, and therefore, horizontal mergersmayimprove economic efficiency.Problem 5Market dominance by one firm may be due to the firm’s better performance, higher efficiencyetc. Price fixing, however, does not indicate higher efficiencies for the participating firms. Itsimply hurts the consumers and reduces overall welfare.

Page 4

Solution Manual For Industrial Organization: Contemporary Theory and Empirical Applications, 5th Edition - Page 4 preview image

Loading page image...

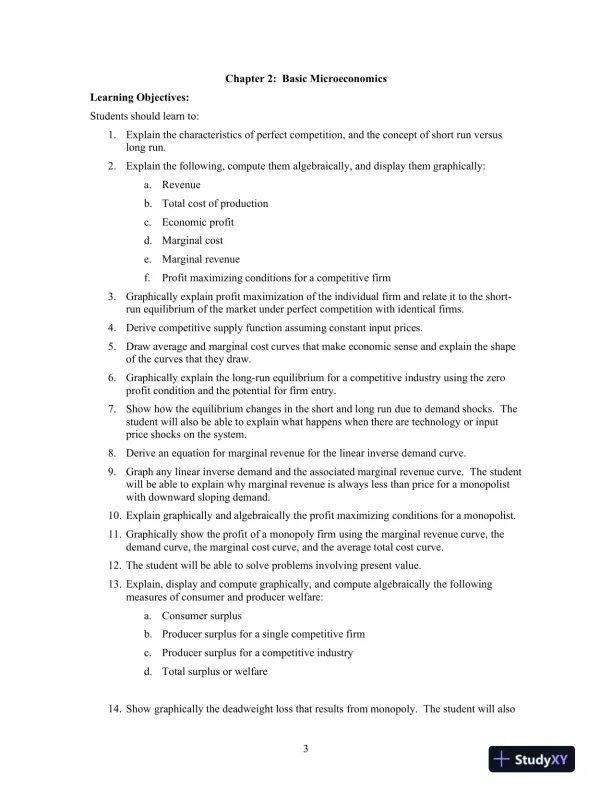
3Chapter 2:Basic MicroeconomicsLearning Objectives:Students should learn to:1.Explain the characteristics of perfect competition,and the concept of short run versuslong run.2.Explain the following, compute them algebraically, and display them graphically:a.Revenueb.Total cost of productionc.Economic profitd.Marginal coste.Marginal revenuef.Profit maximizing conditions for a competitive firm3.Graphically explain profit maximization of the individual firm and relate it to the short-run equilibrium of the market under perfect competition with identical firms.4.Derive competitive supply function assuming constant input prices.5.Draw average and marginal cost curves that make economic sense and explain the shapeof the curves that they draw.6.Graphically explain the long-run equilibrium for a competitive industry using the zeroprofit condition and the potential for firm entry.7.Show how the equilibrium changes in the short and long run due to demand shocks. Thestudent will also be able to explain what happens when there are technology or inputprice shocks on the system.8.Derive an equation for marginal revenue for the linear inverse demand curve.9.Graph any linear inverse demand and the associated marginal revenue curve. The studentwill be able to explain why marginal revenue is always less than price for a monopolistwith downward sloping demand.10.Explain graphically and algebraically the profit maximizing conditions for a monopolist.11.Graphically show the profit of a monopoly firm using the marginal revenue curve, thedemand curve, the marginal cost curve, and the average total cost curve.12.The student will be able to solve problems involving present value.13.Explain, display and compute graphically, and compute algebraically the followingmeasures of consumer and producer welfare:a.Consumer surplusb.Producer surplus for a single competitive firmc.Producer surplus for a competitive industryd.Total surplus or welfare14.Show graphically the deadweight loss that results from monopoly. The student will also

Page 5

Solution Manual For Industrial Organization: Contemporary Theory and Empirical Applications, 5th Edition - Page 5 preview image

Loading page image...

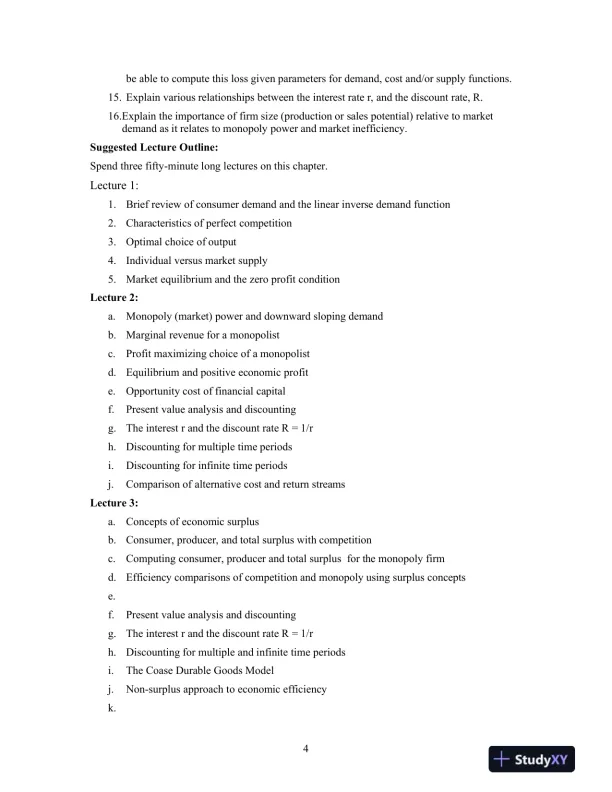
4be able to compute this loss given parameters for demand, cost and/or supply functions.15.Explain various relationships between the interest rate r, and the discount rate, R.16.Explain the importance of firm size (production or sales potential) relative to marketdemand as it relates to monopoly power and market inefficiency.Suggested Lecture Outline:Spend three fifty-minute long lectures on this chapter.Lecture 1:1.Brief review of consumer demand and the linear inverse demand function2.Characteristics of perfect competition3.Optimal choice of output4.Individualversusmarket supply5.Market equilibrium and the zero profit conditionLecture 2:a.Monopoly (market) power and downward sloping demandb.Marginal revenue for a monopolistc.Profit maximizing choice of a monopolistd.Equilibrium and positive economic profite.Opportunity cost of financial capitalf.Present value analysis and discountingg.The interest r and the discount rate R = 1/rh.Discounting for multiple time periodsi.Discounting for infinite time periodsj.Comparison of alternative cost and return streamsLecture 3:a.Concepts of economic surplusb.Consumer, producer, and total surplus with competitionc.Computingconsumer, producer and total surplusfor the monopoly firmd.Efficiency comparisons of competition and monopoly using surplus conceptse.f.Present value analysis and discountingg.The interest r and the discount rate R = 1/rh.Discounting for multiple and infinite time periodsi.The Coase Durable Goods Modelj.Non-surplus approach to economic efficiencyk.

Page 6

Solution Manual For Industrial Organization: Contemporary Theory and Empirical Applications, 5th Edition - Page 6 preview image

Loading page image...

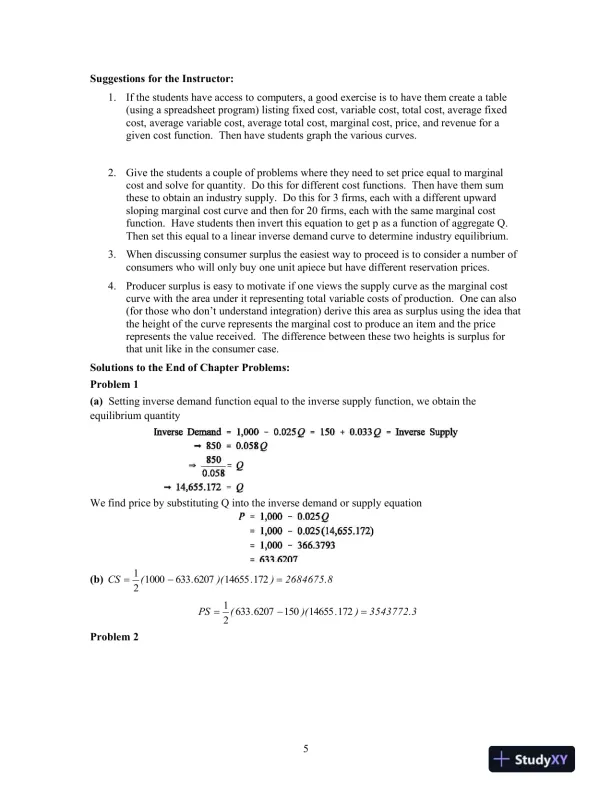
5Suggestions for the Instructor:1.If the students have access to computers, a good exercise is to have them create a table(using a spreadsheet program) listing fixed cost, variable cost, total cost, average fixedcost, average variable cost, average total cost, marginal cost, price, and revenue for agiven cost function. Then have students graph the various curves.2.Give the students a couple of problems where they need to set price equal to marginalcost and solve for quantity. Do this for different cost functions. Then have them sumthese to obtain an industry supply. Do this for 3 firms, each with a different upwardsloping marginal cost curve and then for 20 firms, each with the same marginal costfunction. Have students then invert this equation to get p as a function of aggregate Q.Then set this equal to a linear inverse demand curve to determine industry equilibrium.3.When discussing consumer surplus the easiest way to proceed is to consider a number ofconsumers who will only buy one unit apiece but have different reservation prices.4.Producer surplus is easy to motivate if one views the supply curve as the marginal costcurve with the area under it representing total variable costs of production. One can also(for those who don’t understand integration) derive this area as surplus using the idea thatthe height of the curve represents the marginal cost to produce an item and the pricerepresents the value received. The difference between these two heights is surplus forthat unit like in the consumer case.Solutions to the End of Chapter Problems:Problem 1(a)Setting inverse demand function equal to the inverse supply function, we obtain theequilibrium quantityWe find price by substituting Q into the inverse demand or supply equation(b)2684675.8).)(.(CS1721465562076331000213543772.3).)(.(PS17214655150620763321Problem 2

Page 7

Solution Manual For Industrial Organization: Contemporary Theory and Empirical Applications, 5th Edition - Page 7 preview image

Loading page image...

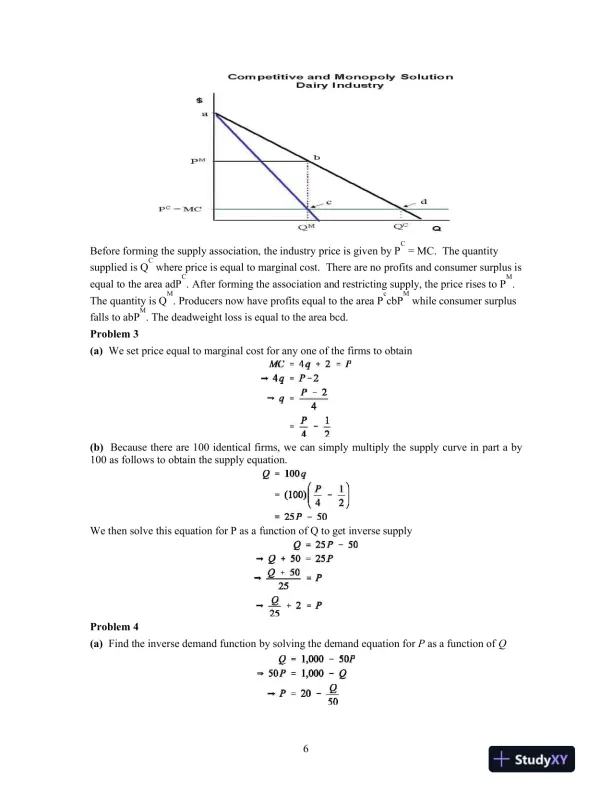
6Before forming the supply association, the industry price is given by PC= MC. The quantitysupplied is QCwhere price is equal to marginal cost. There are no profits and consumer surplus isequal to the area adPC. After forming the association and restricting supply, the price rises to PM.The quantity is QM. Producers now have profits equal to the area PccbPMwhile consumer surplusfalls to abPM. The deadweight loss is equal to the area bcd.Problem 3(a)We set price equal to marginal cost for any one of the firms to obtain(b)Because there are 100 identical firms, we can simply multiply the supply curve in part a by100 as follows to obtain the supply equation.We then solve this equation for P as a function of Q to get inverse supplyProblem 4(a)Find the inverse demand function by solving the demand equation forPas a function ofQ

Page 8

Solution Manual For Industrial Organization: Contemporary Theory and Empirical Applications, 5th Edition - Page 8 preview image

Loading page image...

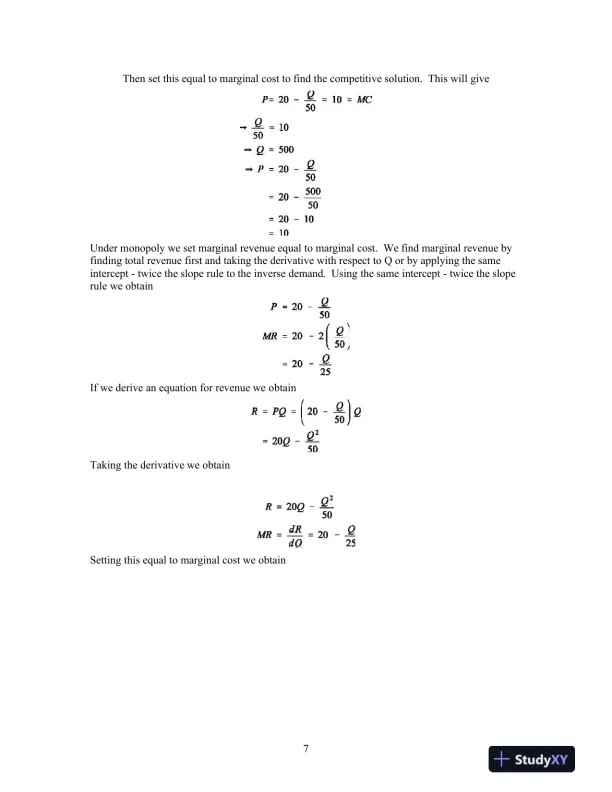
7Then set this equal to marginal cost to find the competitive solution. This will giveUnder monopoly we set marginal revenue equal to marginal cost. We find marginal revenue byfinding total revenue first and taking the derivative with respect to Q or by applying the sameintercept-twice the slope rule to the inverse demand. Using the same intercept-twice the sloperule we obtainIf we derive an equation for revenue weobtainTaking the derivative we obtainSetting this equal to marginal cost we obtain

Page 9

Solution Manual For Industrial Organization: Contemporary Theory and Empirical Applications, 5th Edition - Page 9 preview image

Loading page image...

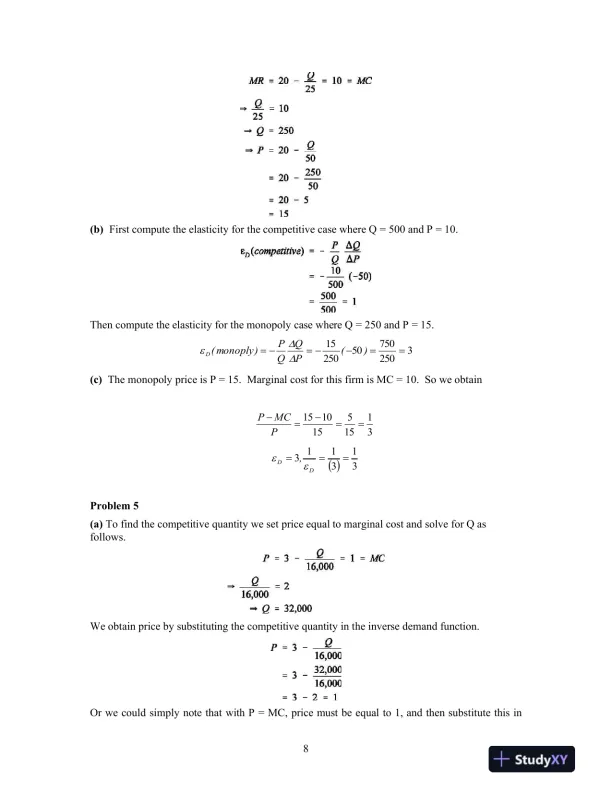
8(b)First compute the elasticity for the competitive case where Q = 500 and P = 10.Then compute the elasticity for the monopoly case where Q = 250 and P = 15.32507505025015)(PQQP)monoply(D(c)The monopoly price is P = 15. Marginal cost for this firm is MC = 10. So we obtain31155151015PMCP 313113DD,Problem 5(a)To find the competitive quantity we set price equal to marginal cost and solve for Q asfollows.We obtain price by substituting the competitive quantity in the inverse demand function.Or we could simply note that with P = MC, price must be equal to 1, and then substitute this in

Page 10

Solution Manual For Industrial Organization: Contemporary Theory and Empirical Applications, 5th Edition - Page 10 preview image

Loading page image...

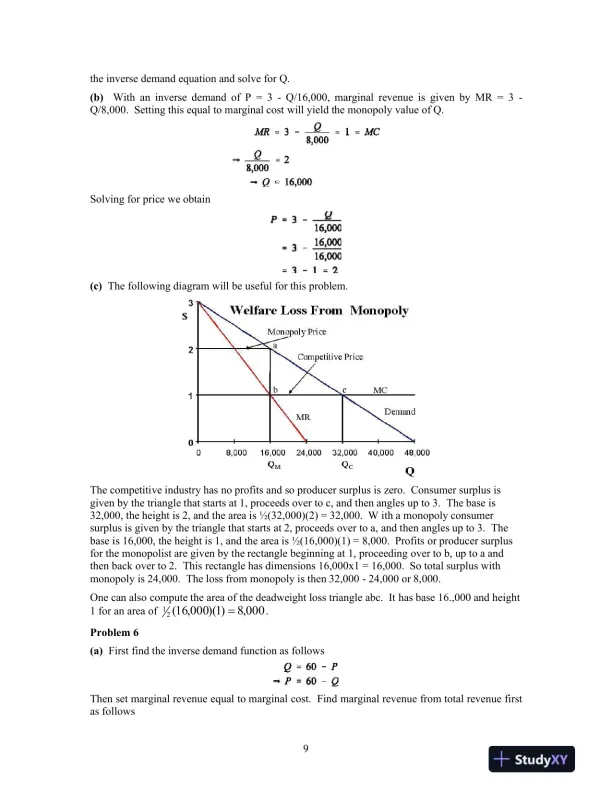
9the inverse demand equation and solve for Q.(b)With an inverse demand of P = 3-Q/16,000, marginal revenue is given by MR = 3-Q/8,000. Setting this equal to marginal cost will yield the monopoly value of Q.Solving for price we obtain(c)The following diagram will be useful for this problem.The competitive industry has no profits and so producer surplus is zero. Consumer surplus isgiven by the triangle that starts at 1, proceeds over to c, and then angles up to 3. The base is32,000, the height is 2, and the area is ½(32,000)(2) = 32,000. W ith a monopoly consumersurplus is given by the triangle that starts at 2, proceeds over to a, and then angles up to 3. Thebase is 16,000, the height is 1, and the area is ½(16,000)(1) = 8,000. Profits or producer surplusfor the monopolist are given by the rectangle beginning at 1, proceeding over to b, up to a andthen back over to 2. This rectangle has dimensions 16,000x1 = 16,000. So total surplus withmonopoly is 24,000. The loss from monopoly is then 32,000-24,000 or 8,000.One can also compute the area of the deadweight loss triangle abc. It has base 16.,000 and height1 for an area of000,8)1)(000,16(21.Problem 6(a)First find the inverse demand function as followsThen set marginal revenue equal to marginal cost. Find marginal revenue from total revenue firstas follows

Page 11

Solution Manual For Industrial Organization: Contemporary Theory and Empirical Applications, 5th Edition - Page 11 preview image

Loading page image...

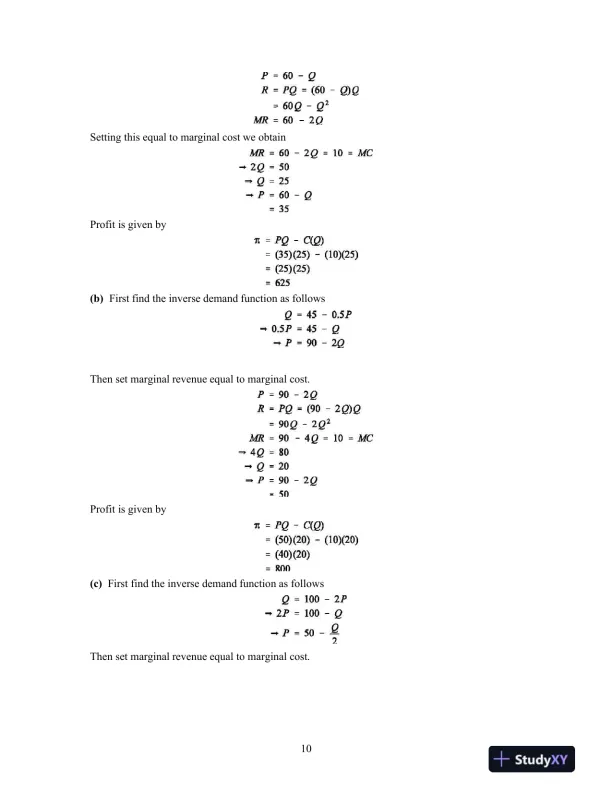
10Setting this equal to marginal cost we obtainProfit is given by(b)First find the inverse demand function as followsThen set marginal revenue equal to marginal cost.Profit is given by(c)First find the inverse demand function as followsThen set marginal revenue equal to marginal cost.

Page 12

Solution Manual For Industrial Organization: Contemporary Theory and Empirical Applications, 5th Edition - Page 12 preview image

Loading page image...

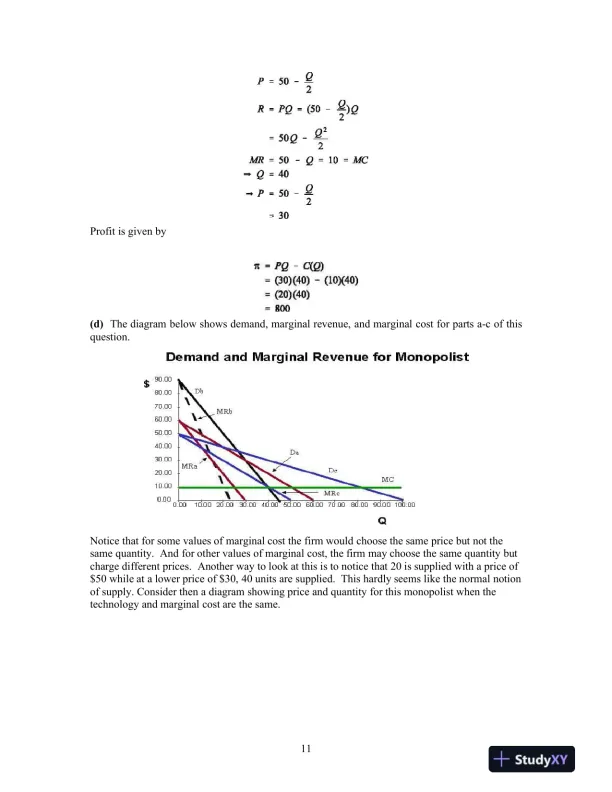
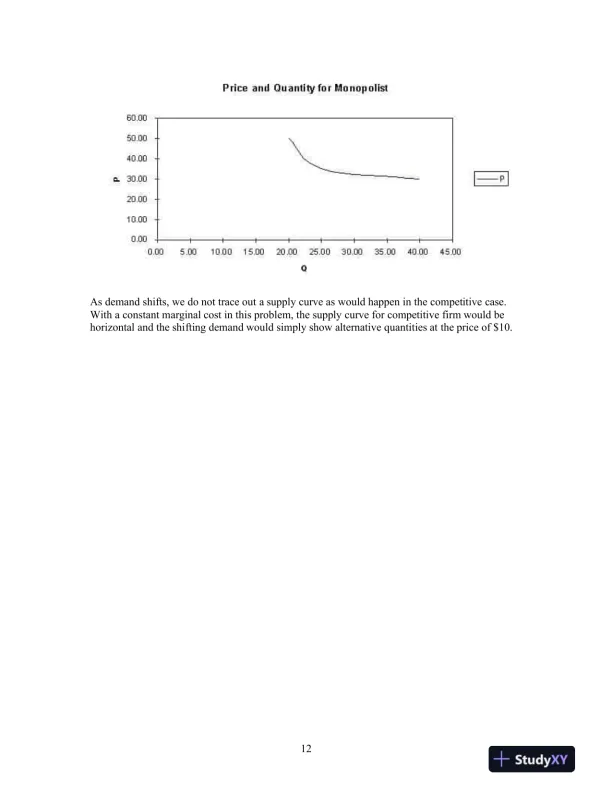
11Profit is given by(d)The diagram below shows demand, marginal revenue, and marginal cost for parts a-c of thisquestion.Notice that for some values of marginal cost the firm would choose the same price but not thesame quantity. And for other values of marginal cost, the firm may choose the same quantity butcharge different prices. Another way to look at this is to notice that 20 is supplied with a price of$50 while at a lower price of $30, 40 units are supplied. This hardly seems like the normal notionof supply. Consider then a diagram showing price and quantity for this monopolist when thetechnology and marginal cost are the same.

Page 13

Solution Manual For Industrial Organization: Contemporary Theory and Empirical Applications, 5th Edition - Page 13 preview image

Loading page image...

12As demand shifts, we do not trace out a supply curve as would happen in the competitive case.With a constant marginal cost in this problem, the supply curve for competitive firm would behorizontal and the shifting demand would simply show alternative quantities at the price of $10.

Page 14

Solution Manual For Industrial Organization: Contemporary Theory and Empirical Applications, 5th Edition - Page 14 preview image

Loading page image...

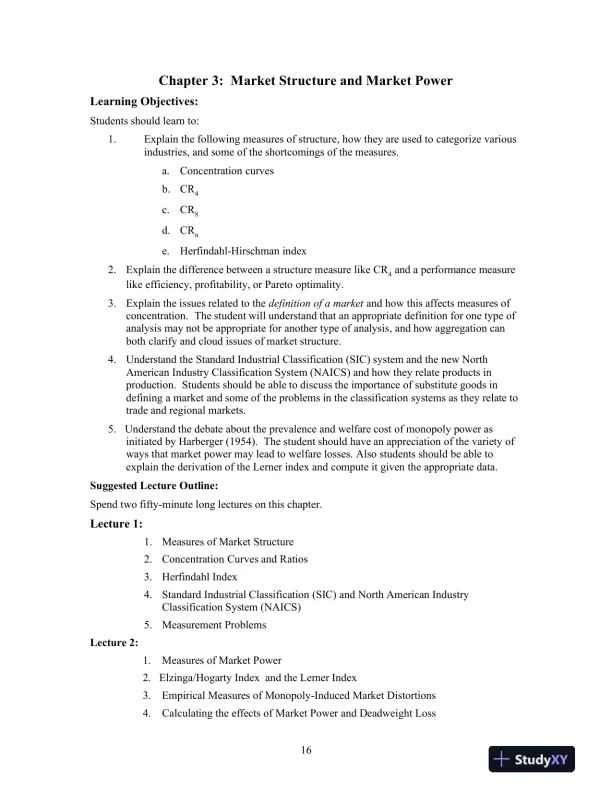
16Chapter 3: Market Structure and Market PowerLearning Objectives:Students should learn to:1.Explain the following measures of structure, how they are used to categorize variousindustries, and some of the shortcomings of the measures.a.Concentration curvesb.CR4c.CR8d.CRne.Herfindahl-Hirschman index2.Explain the difference between a structure measure like CR4and a performance measurelike efficiency, profitability, or Pareto optimality.3.Explain the issues related to thedefinition of a marketand how this affects measures ofconcentration. The student will understand that an appropriate definition for one type ofanalysis may not be appropriate for another type of analysis,and how aggregation canboth clarify and cloud issues of market structure.4.Understand the Standard Industrial Classification (SIC) system and the new NorthAmerican Industry Classification System (NAICS) and how they relate products inproduction. Students shouldbe able to discuss the importance of substitute goods indefining a market and some of the problems in the classification systems as they relate totrade and regional markets.5.Understand the debate about the prevalence and welfare cost of monopoly power asinitiated by Harberger (1954). The student shouldhave an appreciation of the variety ofways that market power may lead to welfare losses. Alsostudents shouldbe able toexplain the derivation ofthe Lerner index andcompute it giventheappropriate data.Suggested Lecture Outline:Spend two fifty-minute long lectures on this chapter.Lecture 1:1.Measures of Market Structure2.Concentration Curves and Ratios3.Herfindahl Index4.Standard Industrial Classification (SIC) andNorth American IndustryClassification System (NAICS)5.Measurement ProblemsLecture 2:1.Measures of Market Power2.Elzinga/Hogarty Indexand theLerner Index3.Empirical Measures of Monopoly-Induced Market Distortions4.Calculating the effects of Market Power and Deadweight Loss

Page 15

Solution Manual For Industrial Organization: Contemporary Theory and Empirical Applications, 5th Edition - Page 15 preview image

Loading page image...

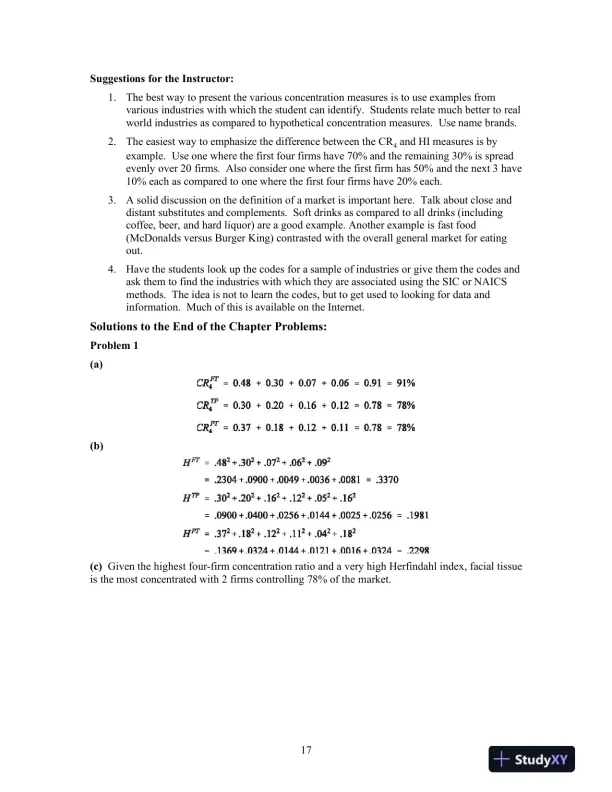
17Suggestions for the Instructor:1.The best way to present the various concentration measures is to use examples fromvarious industries with which the student can identify. Students relate much better to realworld industries as compared to hypothetical concentration measures.Use name brands.2.The easiest way to emphasize the difference between the CR4and HImeasures is byexample. Use one where the first four firms have 70% and the remaining 30% is spreadevenly over 20 firms. Also consider one where the first firm has 50% and the next 3 have10% each as compared to one where the first four firms have 20% each.3.A solid discussion on the definition of a market is important here. Talk about close anddistant substitutes and complements. Soft drinks as compared to all drinks (includingcoffee, beer,and hard liquor) are a good example. Another example is fast food(McDonalds versus Burger King) contrasted withtheoverall general market for eatingout.4.Have the studentslook up the codes for a sample of industries or give them the codes andask them to find the industries with which they are associatedusing the SIC or NAICSmethods. The idea is not to learn the codes,but to get used to looking for dataandinformation. Much of this is available on the Internet.Solutions to the End of the Chapter Problems:Problem 1(a)(b)(c)Given the highest four-firm concentration ratio and a very high Herfindahl index, facial tissueis the most concentrated with 2 firms controlling 78% of the market.

Page 16

Solution Manual For Industrial Organization: Contemporary Theory and Empirical Applications, 5th Edition - Page 16 preview image

Loading page image...

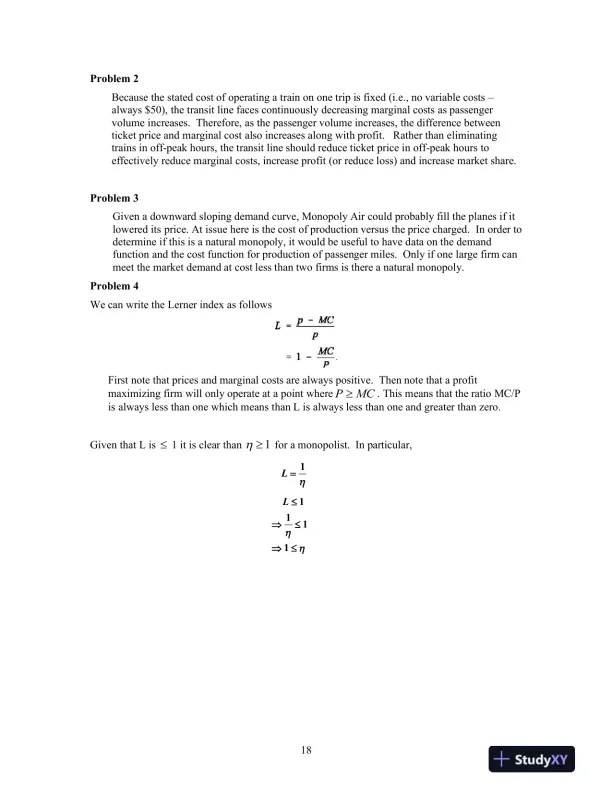
18Problem 2Because the stated cost of operating a train on one trip is fixed (i.e., no variable costsalways $50), the transit line faces continuously decreasing marginal costs as passengervolume increases. Therefore, as the passenger volume increases, the difference betweenticket price and marginal cost also increases along with profit.Rather than eliminatingtrains in off-peak hours, the transit line should reduce ticket price in off-peak hours toeffectively reduce marginal costs, increase profit (or reduce loss) and increase market share.Problem 3Given a downward sloping demand curve, Monopoly Air could probably fill the planes if itlowered its price. At issue here is the cost of production versus the price charged. In order todetermine if this is a natural monopoly, it would be useful to have data on the demandfunction and the cost function for production of passenger miles. Only if one large firm canmeet the market demand at cost less than two firms is there a natural monopoly.Problem 4We can write the Lerner index as followsFirst note that prices and marginal costs are always positive. Then note that a profitmaximizing firm will only operate at a point whereMCP. This means that the ratio MC/Pis always less than one which means than L is always less than one and greater than zero.Given that L is1 it is clear than1for a monopolist. In particular,1L1111L
Preview Mode

This document has 162 pages. Sign in to access the full document!

Study Now!

XY-Copilot AI
Unlimited Access
Secure Payment
Instant Access
24/7 Support
Document Chat

Document Details

Subject
Economics

Related Documents

View all