Solution Manual for Introduction to Probability and Statistics, 15th Edition

Solution Manual for Introduction to Probability and Statistics, 15th Edition is your study companion, providing answers to textbook exercises and reinforcing key concepts.

Alice Perry
Contributor
4.0
52
5 months ago
Preview (16 of 505 Pages)
100%
Purchase to unlock

Page 1

Solution Manual for Introduction to Probability and Statistics, 15th Edition - Page 1 preview image

Loading page image...

Complete Solutions Manualto AccompanyIntroduction toProbability and Statistics15th EditionWilliam Mendenhall, III1925-2009Robert J. BeaverUniversity of California, Riverside, EmeritusPrepared byBarbara M. BeaverBarbara M. BeaverUniversity of California, Riverside, Emerita

Page 2

Solution Manual for Introduction to Probability and Statistics, 15th Edition - Page 2 preview image

Loading page image...

Page 3

Solution Manual for Introduction to Probability and Statistics, 15th Edition - Page 3 preview image

Loading page image...

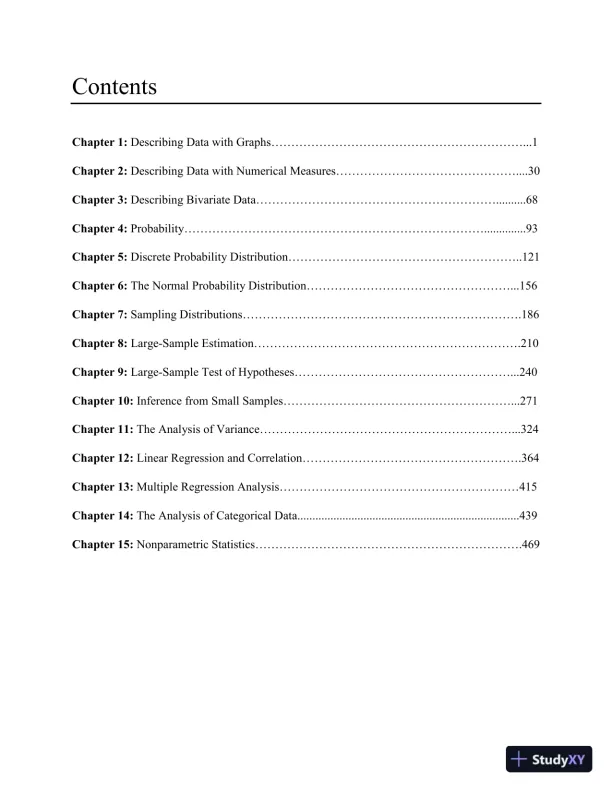
ContentsChapter 1:Describing Data with Graphs………………………………………………………...1Chapter 2:Describing Data with Numerical Measures………………………………………....30Chapter 3:Describing Bivariate Data……………………………………………………..........68Chapter 4:Probability…………………………………………………………………..............93Chapter 5:Discrete Probability Distribution…………………………………………………..121Chapter 6:The Normal Probability Distribution……………………………………………...156Chapter 7:Sampling Distributions…………………………………………………………….186Chapter 8:Large-Sample Estimation………………………………………………………….210Chapter 9:Large-Sample Test of Hypotheses………………………………………………...240Chapter 10:Inference from Small Samples…………………………………………………...271Chapter 11:The Analysis of Variance………………………………………………………...324Chapter 12:Linear Regression and Correlation……………………………………………….364Chapter 13:Multiple Regression Analysis……………………………………………………415Chapter 14:The Analysis of Categorical Data..........................................................................439Chapter 15:Nonparametric Statistics………………………………………………………….469

Page 4

Solution Manual for Introduction to Probability and Statistics, 15th Edition - Page 4 preview image

Loading page image...

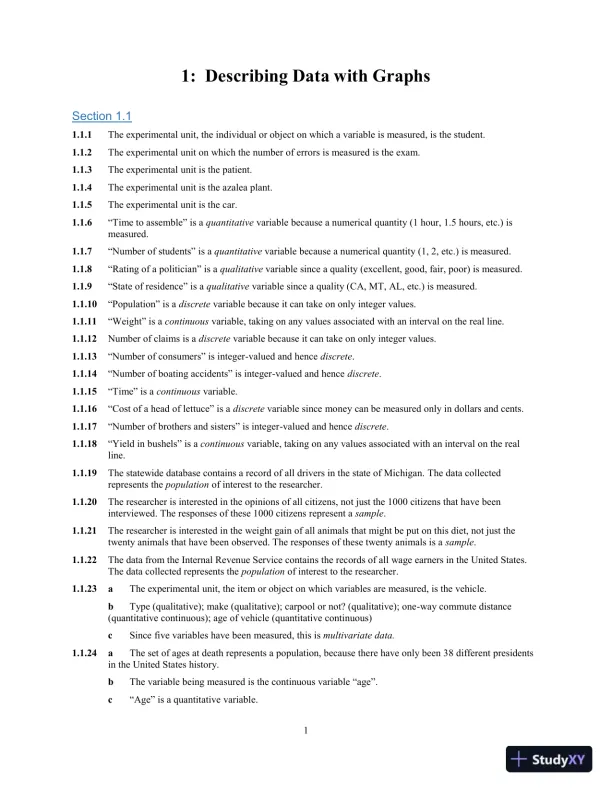
11: Describing Data with GraphsSection 1.11.1.1The experimental unit, the individual or object on which a variable is measured, is the student.1.1.2The experimental unit on which the number of errors is measured is the exam.1.1.3The experimentalunit is the patient.1.1.4The experimental unit is the azalea plant.1.1.5The experimental unit is the car.1.1.6“Time to assemble” is aquantitativevariable because a numerical quantity (1 hour, 1.5 hours, etc.) ismeasured.1.1.7“Number of students”is aquantitativevariable because a numerical quantity (1, 2, etc.) is measured.1.1.8“Rating of a politician” is aqualitativevariable since a quality (excellent, good, fair, poor) is measured.1.1.9“State of residence” is aqualitativevariable since a quality (CA, MT, AL, etc.) is measured.1.1.10“Population” is adiscretevariable because it can take on only integer values.1.1.11“Weight” is acontinuousvariable, taking on any values associated with an interval on the real line.1.1.12Number of claims is adiscretevariable because it can take on only integer values.1.1.13“Number of consumers” is integer-valued and hencediscrete.1.1.14“Number of boating accidents” is integer-valued and hencediscrete.1.1.15“Time” is acontinuousvariable.1.1.16“Cost of a head of lettuce” is adiscretevariable sincemoney can bemeasuredonly in dollars and cents.1.1.17“Number of brothers and sisters” is integer-valued and hencediscrete.1.1.18“Yield inbushels” is acontinuousvariable, taking on any values associated with an interval on the realline.1.1.19The statewide database contains a record of all drivers in the state of Michigan.The data collectedrepresentsthepopulationof interest to the researcher.1.1.20The researcher is interested in the opinions of all citizens, not just the 1000 citizens that have beeninterviewed. The responses of these 1000 citizensrepresentasample.1.1.21The researcher is interested in the weight gain of all animals that might be put on this diet, not just thetwenty animals that have been observed. The responses of these twenty animals is asample.1.1.22The data from the Internal Revenue Service contains the records of all wage earners in the United States.The data collected represents thepopulationof interest to the researcher.1.1.23aThe experimental unit, the item or object on which variables are measured, is the vehicle.bType (qualitative); make (qualitative); carpool or not? (qualitative); one-way commute distance(quantitative continuous); age of vehicle (quantitative continuous)cSince five variables have been measured, this ismultivariate data.1.1.24aThe set of ages at death represents a population, because there have only been 38different presidentsin the United States history.bThe variable being measured is the continuous variable “age”.c“Age” is a quantitative variable.

Page 5

Solution Manual for Introduction to Probability and Statistics, 15th Edition - Page 5 preview image

Loading page image...

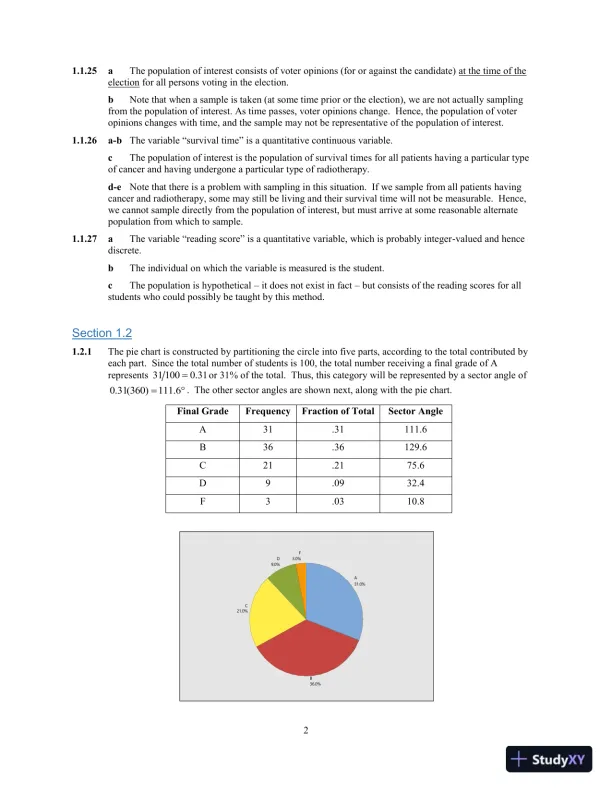
21.1.25aThe population of interest consists of voteropinions (for or against the candidate)at the time of theelectionfor all persons voting in the election.bNote that when a sample is taken (at some time prior or the election), we are not actually samplingfrom the population of interest. As time passes, voter opinions change. Hence, the population of voteropinions changes with time, and the sample may not be representative of the population of interest.1.1.26a-bThe variable “survival time” is a quantitative continuous variable.cThe population of interest is the population of survival times for all patients having a particular typeof cancer and having undergone a particular type of radiotherapy.d-eNote that there is a problem with sampling in this situation. If we sample from all patientshavingcancer and radiotherapy, some may still be living and their survival time will not be measurable. Hence,we cannot sample directly from the population of interest, but must arrive at some reasonable alternatepopulation from which to sample.1.1.27aThe variable “reading score” is a quantitative variable, which is probably integer-valued and hencediscrete.bThe individual on which the variable is measured is the student.cThepopulation is hypotheticalit does not exist in factbut consists of the reading scores for allstudents who could possibly be taught by this method.Section 1.21.2.1The pie chart is constructed by partitioning the circle into five parts, accordingto the total contributed byeach part. Since the total number of students is 100, the total number receiving a final grade of Arepresents31 1000.31=or 31% of the total. Thus, this category will be represented by a sector angle of0.31(360)111.6=. The other sector angles are shownnext, along with the pie chart.Final GradeFrequencyFraction of TotalSector AngleA31.31111.6B36.36129.6C21.2175.6D9.0932.4F3.0310.83.0%F9.0%D21.0%C36.0%B31.0%A

Page 6

Solution Manual for Introduction to Probability and Statistics, 15th Edition - Page 6 preview image

Loading page image...

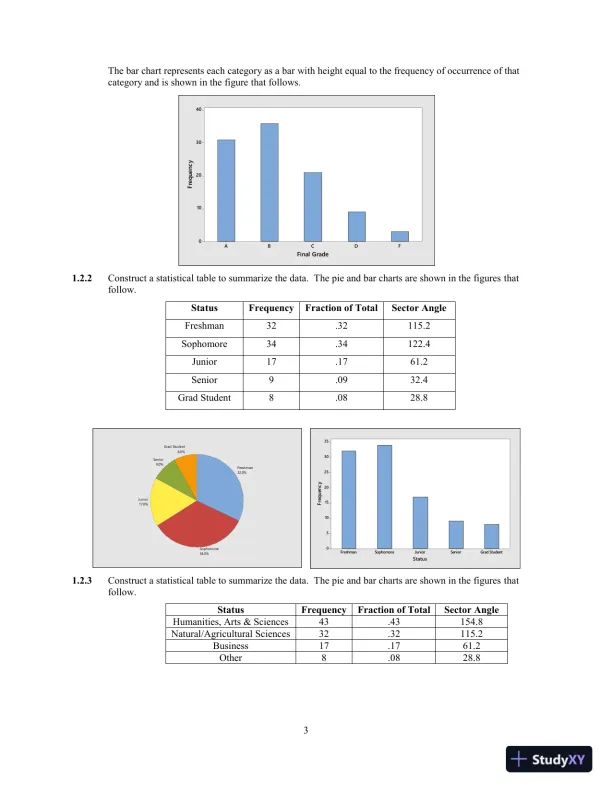
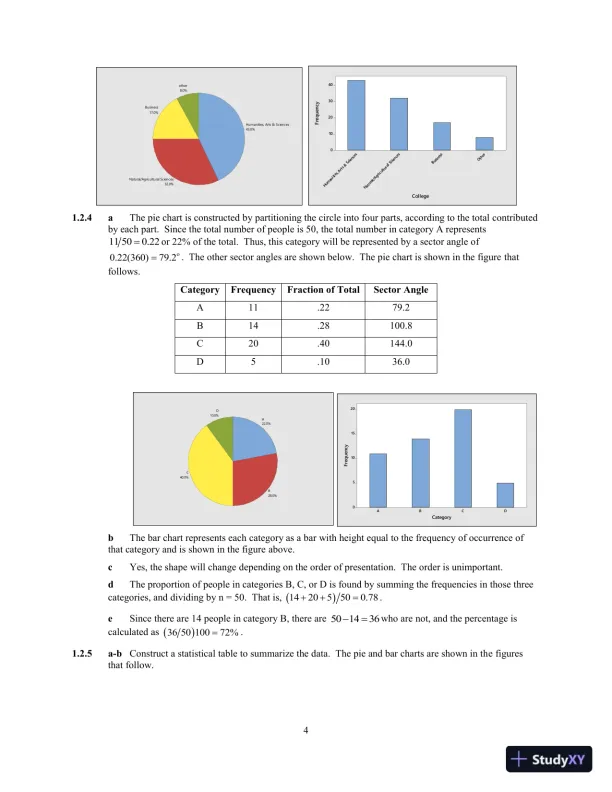
3The bar chart represents each category as a bar with height equal to the frequency of occurrence of thatcategory and is shown in the figurethat follows.1.2.2Construct a statistical table to summarize the data. The pie and bar charts are shown in the figuresthatfollow.StatusFrequencyFraction of TotalSector AngleFreshman32.32115.2Sophomore34.34122.4Junior17.1761.2Senior9.0932.4GradStudent8.0828.81.2.3Construct a statistical table to summarize the data. The pie and bar charts are shown in the figuresthatfollow.StatusFrequencyFraction of TotalSector AngleHumanities, Arts & Sciences43.43154.8Natural/Agricultural Sciences32.32115.2Business17.1761.2Other8.0828.8FDCBA403020100FinalGradeFrequency8.0%GradStudent9.0%Senior17.0%Junior34.0%Sophomore32.0%FreshmanGradStudentSeniorJuniorSophomoreFreshman35302520151050StatusFrequency

Page 7

Solution Manual for Introduction to Probability and Statistics, 15th Edition - Page 7 preview image

Loading page image...

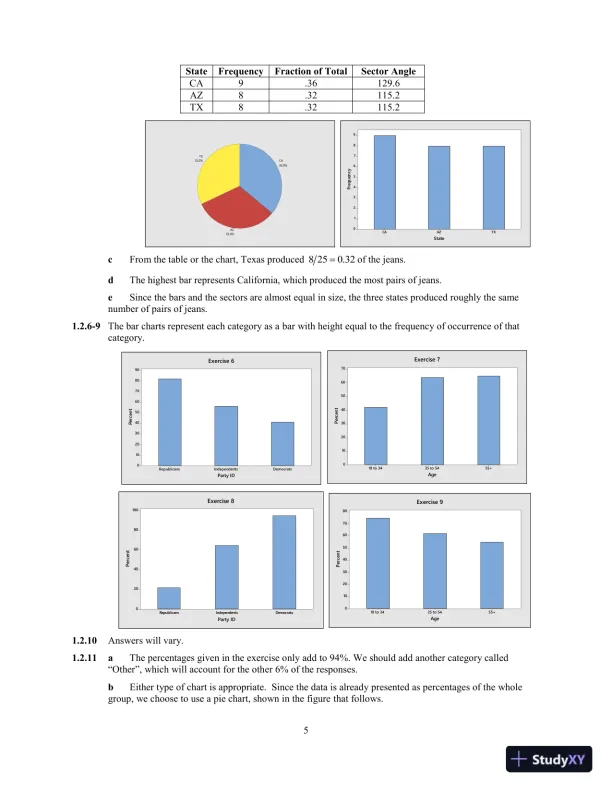
41.2.4aThepie chart is constructed by partitioning the circle into four parts, according to the total contributedby each part. Since the total number of people is 50, the total number in category A represents11 500.22=or 22% of the total. Thus, this category will be represented by a sector angle ofo0.22(360)79.2=. The other sector angles are shown below. The pie chart is shown in the figurethatfollows.CategoryFrequencyFraction of TotalSector AngleA11.2279.2B14.28100.8C20.40144.0D5.1036.0bThe bar chart represents each category as a bar with height equal to the frequency of occurrence ofthat category and is shown in the figureabove.cYes, the shape will changedepending on the order of presentation. The order is unimportant.dThe proportion of people in categories B, C, or D is found by summing the frequencies in those threecategories, and dividing by n = 50. That is,()14205500.78++=.eSince there are 14 people in category B, there are501436=who are not, and the percentage iscalculated as()36 50 10072%=.1.2.5a-bConstruct a statistical table to summarize the data. The pie and bar charts are shown in the figuresthat follow.8.0%other17.0%Business32.0%Natural/AgriculturalSciences43.0%Humanities,Arts&SciencesOtherBusinessNatural/AgriculturalSciencesHumanities,Arts&Sciences403020100CollegeFrequency10.0%D40.0%C28.0%B22.0%ADCBA20151050CategoryFrequency

Page 8

Solution Manual for Introduction to Probability and Statistics, 15th Edition - Page 8 preview image

Loading page image...

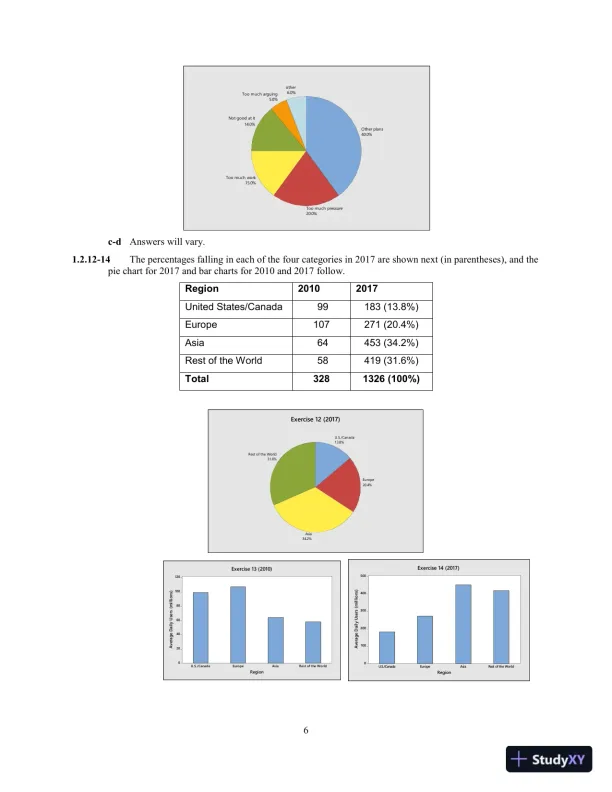
5StateFrequencyFraction of TotalSector AngleCA9.36129.6AZ8.32115.2TX8.32115.2cFrom the table or the chart, Texas produced8 250.32=of the jeans.dThehighest bar represents California, which produced the most pairs of jeans.eSince the bars and the sectors are almost equal in size, the three states produced roughly the samenumber of pairs of jeans.1.2.6-9The bar charts represent each category as abar with height equal to the frequency of occurrence of thatcategory.1.2.10Answers will vary.1.2.11aThe percentages given in the exercise only add to 94%. We should add another category called“Other”, which will account for the other 6% of the responses.bEither type of chart is appropriate. Since the data is already presented as percentages of the wholegroup, we choose to use a pie chart, shown in the figurethat follows.32.0%TX32.0%AZ36.0%CATXAZCA9876543210StateFrequencyDemocratsIndependentsRepublicans9080706050403020100PartyIDPercentExercise655+35to5418to34706050403020100AgePercentExercise7DemocratsIndependentsRepublicans100806040200PartyIDPercentExercise855+35to5418to3480706050403020100AgePercentExercise9

Page 9

Solution Manual for Introduction to Probability and Statistics, 15th Edition - Page 9 preview image

Loading page image...

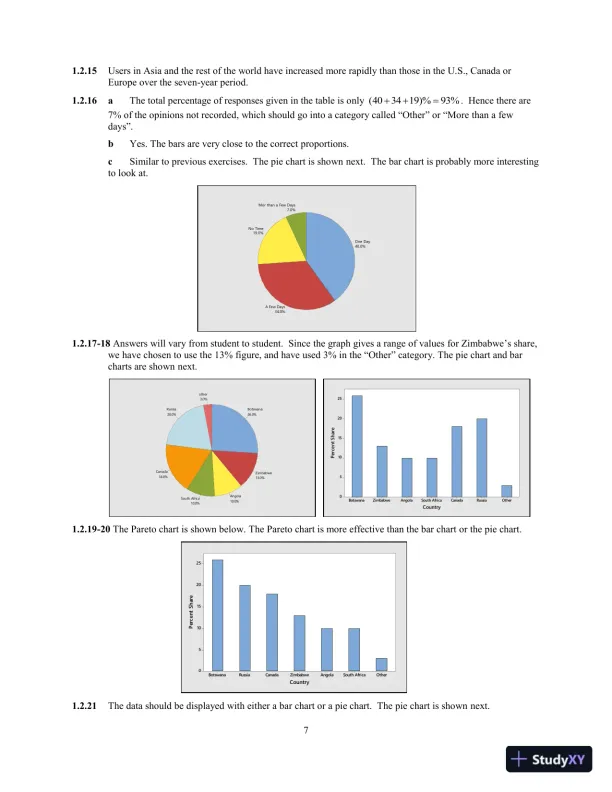
6c-dAnswers will vary.1.2.12-14The percentages falling in each of thefourcategoriesin 2017are shownnext(in parentheses), and thepie chartfor2017andbar charts for 2010 and 2017follow.Region20102017United States/Canada99183 (13.8%)Europe107271 (20.4%)Asia64453(34.2%)Rest of the World58419 (31.6%)Total3281326 (100%)6.0%other5.0%Toomucharguing14.0%Notgoodatit15.0%Toomuchwork20.0%Toomuchpressure40.0%Otherplans31.6%RestoftheWorld34.2%Asia20.4%Europe13.8%U.S./CanadaExercise12(2017)RestoftheWorldAsiaEuropeU.S./Canada120100806040200RegionAverageDailyUsers(millions)Exercise13(2010)RestoftheWorldAsiaEuropeU.S./Canada5004003002001000RegionAverageDailyUsers(millions)Exercise14(2017)

Page 10

Solution Manual for Introduction to Probability and Statistics, 15th Edition - Page 10 preview image

Loading page image...

71.2.15Users in Asia and the rest of the world have increased more rapidly than those in the U.S., Canada orEurope over theseven-yearperiod.1.2.16aThetotal percentage of responses given in the table is only(403419)%93%++=. Hence there are7% of the opinions not recorded, which should go into a category called “Other” or “More than a fewdays”.bYes. The bars are very close to the correctproportions.cSimilar to previous exercises. The pie chart is shownnext. The bar chart is probably more interestingto look at.1.2.17-18Answers will vary from student to student. Since the graph gives a range of values for Zimbabwe’s share,we have chosen to use the 13% figure, and have used 3% in the “Other” category. The pie chart and barcharts are shownnext.1.2.19-20The Pareto chart is shown below.ThePareto chart is more effective than the bar chartor the pie chart.1.2.21The data should be displayed with either a bar chart or a pie chart. The pie chart is shownnext.7.0%MorthanaFewDays19.0%NoTime34.0%AFewDays40.0%OneDay3.0%other20.0%Russia18.0%Canada10.0%SouthAfrica10.0%Angola13.0%Zimbabwe26.0%BotswanaOtherRussiaCanadaSouthAfricaAngolaZimbabweBotswana2520151050CountryPercentShareOtherSouthAfricaAngolaZimbabweCanadaRussiaBotswana2520151050CountryPercentShare

Page 11

Solution Manual for Introduction to Probability and Statistics, 15th Edition - Page 11 preview image

Loading page image...

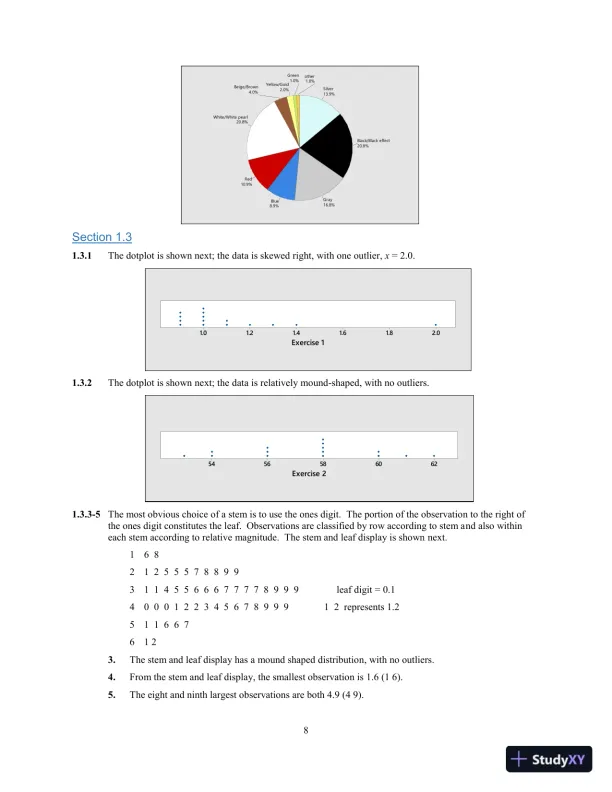
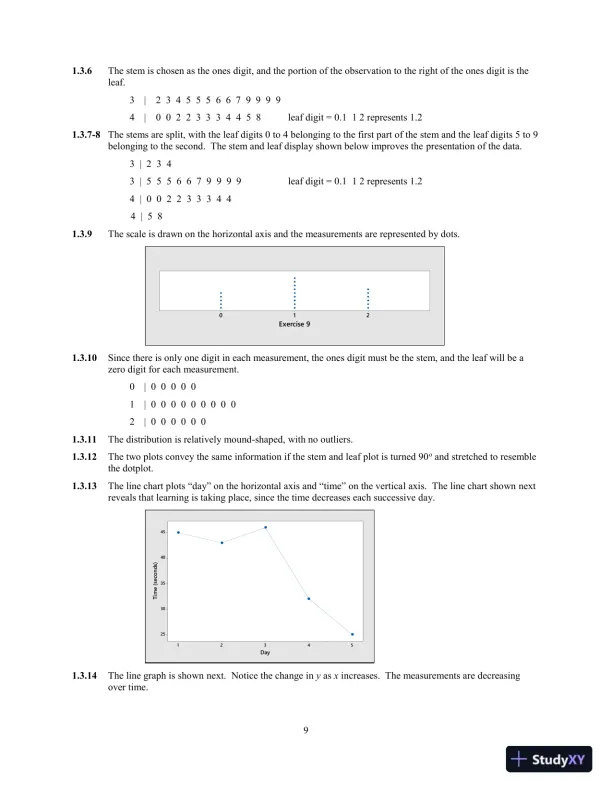
8Section 1.31.3.1The dotplotis shown next; the data is skewed right, with one outlier,x= 2.0.1.3.2The dotplot is shownnext; the data isrelatively mound-shaped, with no outliers.1.3.3-5The most obvious choice of a stem is to use the ones digit. The portion of the observation to the right ofthe ones digit constitutes the leaf. Observations are classified by row according to stem and also withineach stem according to relative magnitude. The stem and leaf display is shownnext.16 821 2 5 5 5 7 8 8 9 931 1 4 5 5 6 6 6 7 7 7 7 8 9 9 9leaf digit = 0.140 00 1 2 2 3 4 5 6 7 8 9 9 91 2 represents 1.251 1 6 6 761 23.The stem and leaf display has a mound shaped distribution, with no outliers.4.From the stem and leaf display, the smallest observation is 1.6 (1 6).5.The eightand ninth largest observations are both 4.9 (4 9).1.0%other1.0%Green2.0%Yellow/Gold4.0%Beige/Brown20.8%White/Whitepearl10.9%Red8.9%Blue16.8%Gray20.8%Black/Blackeffect13.9%Silver2.01.81.61.41.21.0Exercise16260585654Exercise2

Page 12

Solution Manual for Introduction to Probability and Statistics, 15th Edition - Page 12 preview image

Loading page image...

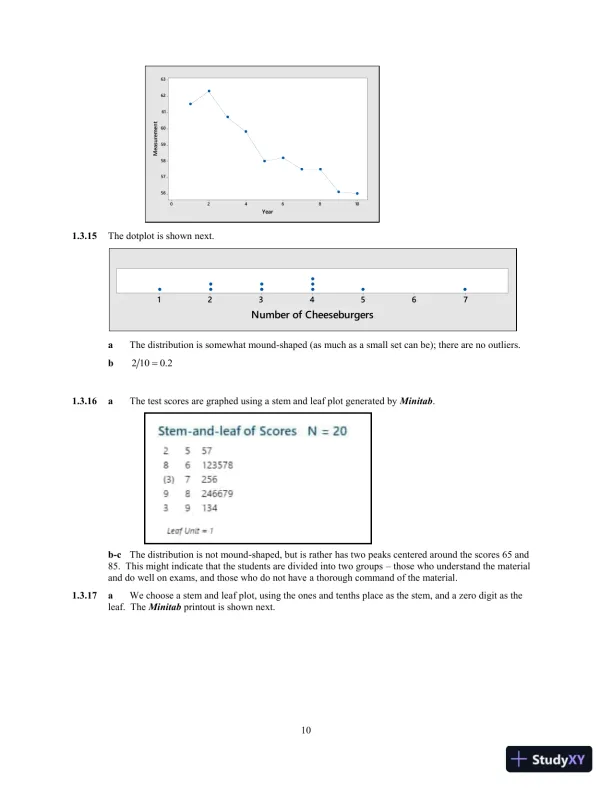
91.3.6The stem is chosen as the ones digit, and the portion of the observation to the right of the ones digit is theleaf.3|2 3 4 5 5 5 6 6 7 9 9 9 94|0 0 2 2 3 3 3 44 5 8leaf digit = 0.1 1 2 represents 1.21.3.7-8The stems are split, with the leaf digits 0 to 4 belonging to the first part of the stem and the leaf digits 5 to 9belonging to the second. The stem and leaf display shown below improves thepresentation of the data.3 | 2 3 43 | 5 5 5 6 6 7 9 9 9 9leaf digit = 0.1 1 2 represents 1.24| 0 0 2 2 3 3 3 4 44|5 81.3.9The scale is drawn on the horizontal axis and the measurements are represented by dots.1.3.10Since there is only one digit in each measurement, the ones digit must be the stem, and the leaf will be azero digit for each measurement.0| 0 0 0 0 01| 0 0 0 0 0 0 0 0 02| 0 0 0 0 0 01.3.11The distributionis relatively mound-shaped, with no outliers.1.3.12The two plots convey the same information if the stem and leaf plot is turned 90oand stretched to resemblethe dotplot.1.3.13The line chart plots “day” on the horizontal axis and “time” on the vertical axis. The line chart shownnextreveals that learning is taking place, since the time decreases each successive day.1.3.14The line graph is shownnext. Notice the change inyasxincreases. The measurements are decreasingover time.210Exercise9543214540353025DayTime(seconds)

Page 13

Solution Manual for Introduction to Probability and Statistics, 15th Edition - Page 13 preview image

Loading page image...

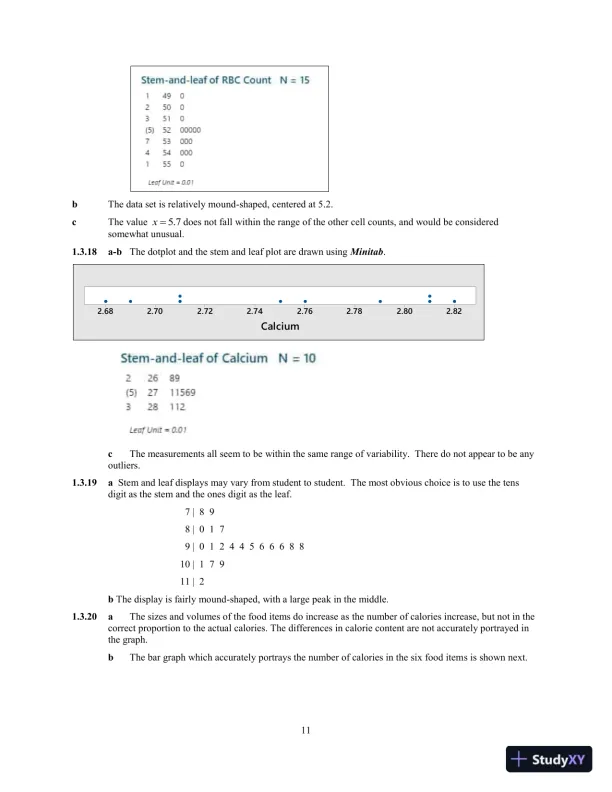
101.3.15Thedotplot is shownnext.aThe distribution is somewhat mound-shaped (as much as a small set can be); there are no outliers.b2 100.2=1.3.16aThe test scores are graphed using a stem and leaf plot generated byMinitab.b-cThe distribution is not mound-shaped, but is ratherhastwo peaks centered around the scores 65 and85. This might indicate that the students are divided into two groupsthose who understand the materialand do well on exams, and those who do not havea thorough command of the material.1.3.17aWe choose a stem and leaf plot, using the ones and tenths place as the stem, and a zero digit as theleaf. TheMinitabprintout is shown next.10864206362616059585756YearMeasurement7654321Number of Cheeseburgers

Page 14

Solution Manual for Introduction to Probability and Statistics, 15th Edition - Page 14 preview image

Loading page image...

11bThe data set is relatively mound-shaped, centered at 5.2.cThe value5.7x=does not fall within the range of the other cell counts, and would be consideredsomewhat unusual.1.3.18a-bThe dotplot and the stem and leaf plot are drawn usingMinitab.cThemeasurements all seem to be within the same range of variability. There do not appear to be anyoutliers.1.3.19aStemand leaf displays may vary from student to student. The most obvious choice is to use the tensdigit as the stem and the ones digitas the leaf.7 | 8 98 | 0 1 79 | 0 1 2 4 4 5 6 6 6 8 810 | 1 7 911 | 2bThe display is fairly mound-shaped, with a large peak in the middle.1.3.20aThe sizes and volumes of the food items do increase asthe number of calories increase, but not in thecorrect proportion to the actual calories. The differences in calorie content are not accurately portrayed inthe graph.bThe bar graph which accurately portrays the number of calories in the six food items is shownnext.2.822.802.782.762.742.722.702.68CalciumDotplot of Calcium

Page 15

Solution Manual for Introduction to Probability and Statistics, 15th Edition - Page 15 preview image

Loading page image...

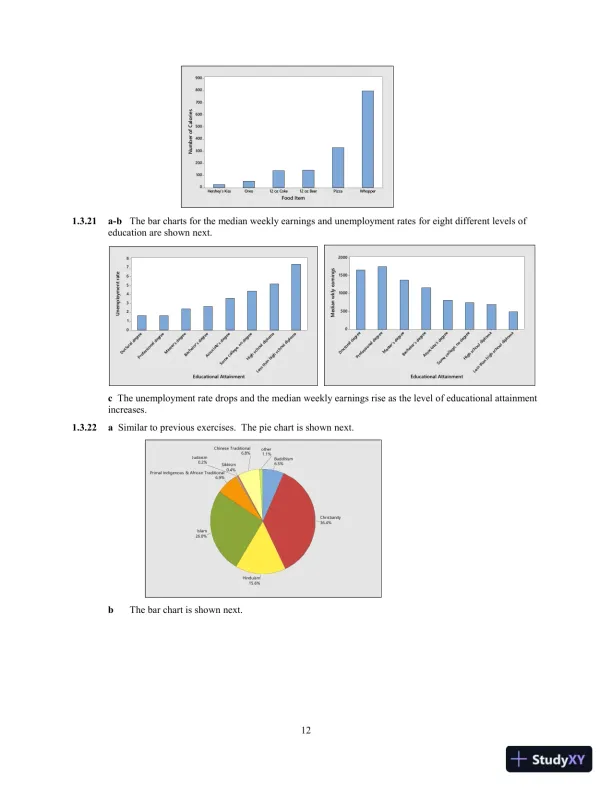
121.3.21a-bThebar charts forthe median weekly earningsand unemployment ratesforeightdifferent levels ofeducationare shownnext.cTheunemployment rate drops and the median weekly earnings rise as the level of educational attainmentincreases.1.3.22aSimilar to previous exercises. The pie chart is shownnext.bThe bar chart is shownnext.WhopperPizza12ozBeer12ozCokeOreoHershey'sKiss9008007006005004003002001000FoodItemNumberofCaloriesLessthanhighschooldiplomaHighschooldiplomaSomecollege,nodegreeAssociate'sdegreeBachelor'sdegreeMaster'sdegreeProfessionaldegreeDoctoraldegree876543210EducationalAttainmentUnemploymentrateLessthanhighschooldiplomaHighschooldiplomaSomecollege,nodegreeAssociate'sdegreeBachelor'sdegreeMaster'sdegreeProfessionaldegreeDoctoraldegree2000150010005000EducationalAttainmentMedianwklyearnings1.1%other6.8%ChineseTraditional0.4%Sikhism0.2%Judaism6.9%PrimalIndigenous&AfricanTraditional26.0%Islam15.6%Hinduism36.4%Christianity6.5%Buddhism

Page 16

Solution Manual for Introduction to Probability and Statistics, 15th Edition - Page 16 preview image

Loading page image...

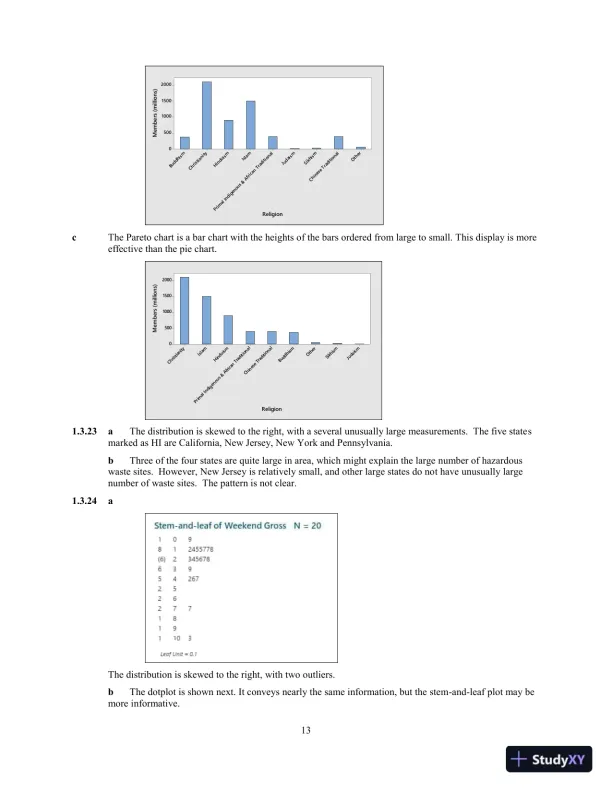
13cThe Pareto chart is a bar chart with the heights of the bars ordered from large to small. This display is moreeffective than the pie chart.1.3.23aThe distribution is skewed to the right, with a several unusually large measurements. The five statesmarked as HI are California, New Jersey, New York and Pennsylvania.bThreeof thefourstates are quite large in area, which might explain the large number of hazardouswaste sites. However,New Jerseyis relatively small, and other large states do not have unusually largenumber of waste sites. The pattern is not clear.1.3.24aThe distribution is skewed to the right, with two outliers.bThe dotplot is shownnext. It conveys nearly the same information, but the stem-and-leaf plot may bemore informative.OtherChineseTraditionalSikhismJudaismPrimalIndigenous&AfricanTraditionalIslamHinduismChristianityBuddhism2000150010005000ReligionMembers(millions)JudaismSikhismOtherBuddhismChineseTraditionalPrimalIndigenous&AfricanTraditionalHinduismIslamChristianity2000150010005000ReligionMembers(millions)
Preview Mode

This document has 505 pages. Sign in to access the full document!

Study Now!

XY-Copilot AI
Unlimited Access
Secure Payment
Instant Access
24/7 Support
Document Chat

Document Details

Subject
Statistics

Related Documents

View all