Solution Manual for Introductory Statistics, 9th Edition

Solution Manual for Introductory Statistics, 9th Edition provides structured notes and analysis for in-depth understanding.

Mia Martinez
Contributor
4.5
42
5 months ago
Preview (16 of 319 Pages)
100%
Purchase to unlock

Page 1

Solution Manual for Introductory Statistics, 9th Edition - Page 1 preview image

Loading page image...

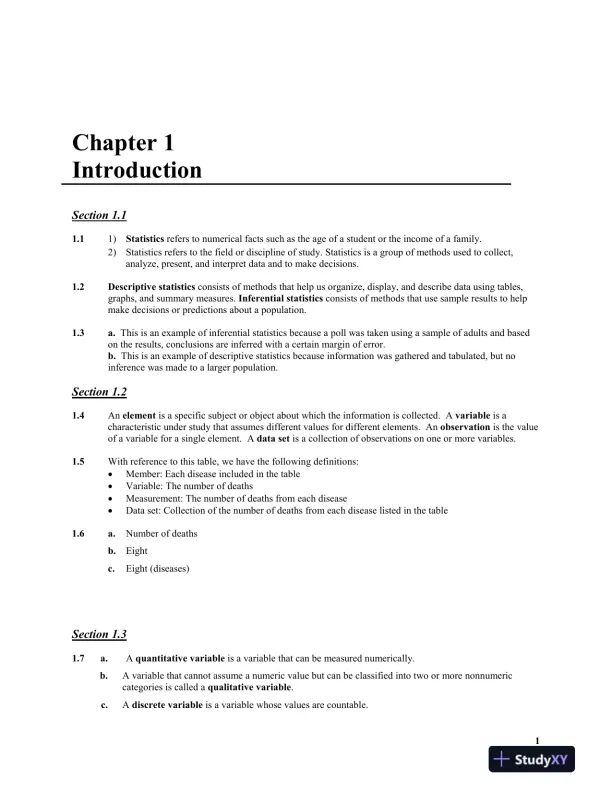
Chapter 1Introduction1Section 1.11.11)Statisticsrefers to numerical facts such as the age of a student or the income of a family.2)Statistics refers to the field or discipline of study. Statistics is a group of methods used to collect,analyze, present, and interpret data and to make decisions.1.2Descriptive statisticsconsists of methods that help us organize, display, and describe data using tables,graphs, and summary measures.Inferential statisticsconsists of methods that use sample results to helpmake decisions or predictions about a population.1.3a.This is an example of inferential statistics because a poll was taken using a sample of adults and basedon the results, conclusions are inferred with a certain margin of error.b.This is an example of descriptive statistics because information was gathered and tabulated, but noinference was made to a larger population.Section 1.21.4Anelementis a specific subject or object about which the information is collected. Avariableis acharacteristic under study that assumes different values for different elements. Anobservationis the valueof a variable for a single element. Adata setis a collection of observations on one or more variables.1.5With reference to this table, we have the following definitions:Member: Each disease included in the tableVariable: The number of deathsMeasurement: The number of deaths from each diseaseData set: Collection of the number of deaths from each disease listed in the table1.6a.Number of deathsb.Eightc.Eight (diseases)Section 1.31.7a.Aquantitative variableis a variable that can be measured numerically.b.A variable that cannot assume a numeric value but can be classified into two or more nonnumericcategories is called aqualitative variable.c.Adiscrete variableisa variable whose values are countable.

Page 2

Solution Manual for Introductory Statistics, 9th Edition - Page 2 preview image

Loading page image...

Page 3

Solution Manual for Introductory Statistics, 9th Edition - Page 3 preview image

Loading page image...

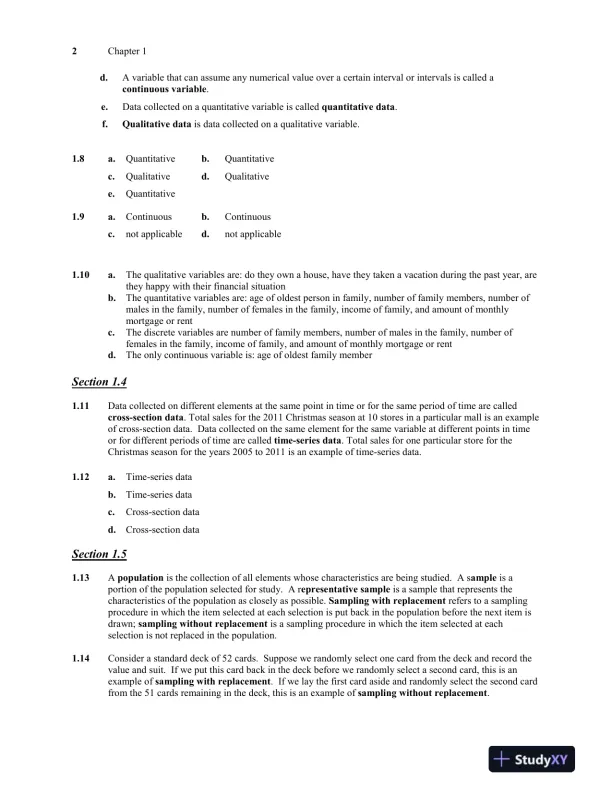
2Chapter 1d.A variable that can assume any numerical value over a certain interval or intervals is called acontinuous variable.e.Data collected on a quantitative variable is calledquantitative data.f.Qualitative dataisdata collected on a qualitative variable.1.8a.Quantitativeb.Quantitativec.Qualitatived.Qualitativee.Quantitative1.9a.Continuousb.Continuousc.not applicabled.not applicable1.10a.The qualitative variables are: do they own a house, have they taken a vacation during the past year, arethey happy with their financial situationb.The quantitative variables are: age of oldest person in family, number of family members, number ofmales in the family, number of females in the family, income of family, and amount of monthlymortgage or rentc.The discrete variables are number of family members, number of males in the family, number offemales in the family, income of family, and amount of monthly mortgage or rentd.The only continuous variable is: age of oldest family memberSection 1.41.11Datacollected on different elements at the same point in time or for the same period of time are calledcross-section data. Total sales for the 2011 Christmas season at 10 stores in a particular mall is an exampleof cross-section data. Data collected on the same element for the same variable at different points in timeor for different periods of time are calledtime-series data. Total sales for one particular store for theChristmas season for the years 2005 to 2011 is an example of time-series data.1.12a.Time-series datab.Time-series datac.Cross-section datad.Cross-section dataSection 1.51.13Apopulationis the collection of all elements whose characteristics are being studied. A sampleisaportion of the population selected for study. A representative sampleis a sample that represents thecharacteristics of the population as closely as possible.Sampling with replacementrefers to a samplingprocedure in which the item selected at each selection is put back in the population before the next item isdrawn;sampling without replacementisa sampling procedure in which the item selected at eachselection is not replaced in the population.1.14Consider a standard deck of 52 cards. Suppose we randomly select one card from the deck and record thevalue and suit. If we put this card back in the deck before we randomly select a second card, this is anexample ofsampling with replacement. If we lay the first card aside and randomly select the second cardfrom the 51 cards remaining in the deck, this is an example ofsampling without replacement.

Page 4

Solution Manual for Introductory Statistics, 9th Edition - Page 4 preview image

Loading page image...

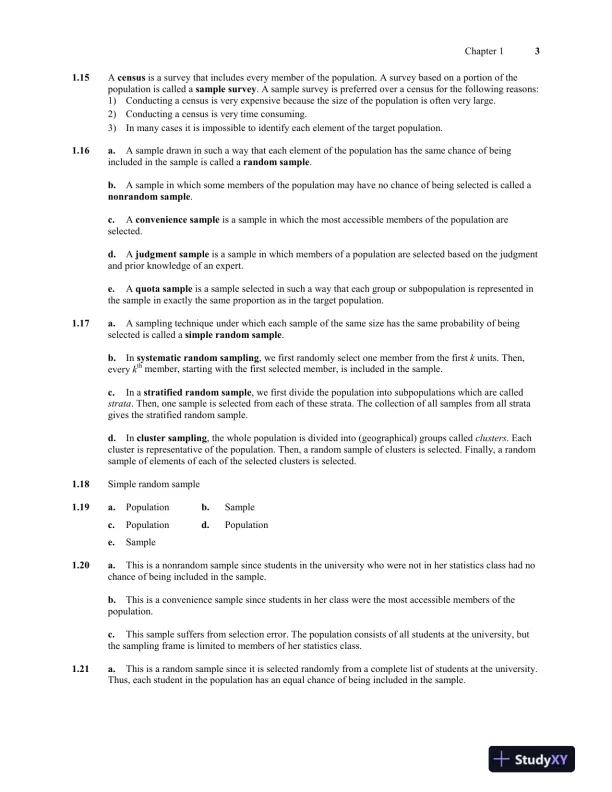
Chapter 131.15Acensusis a survey that includes every member of the population. A survey based on a portion of thepopulation is called asample survey. A sample survey is preferred over a census for the following reasons:1)Conducting a census is very expensive because the size of the population is often very large.2)Conducting a census is very time consuming.3)In many cases it is impossible to identify each element of the target population.1.16a.A sample drawn in such a way that each element of the population has the same chance of beingincluded in the sample is called arandom sample.b.A sample in which some members of the population may have no chance of being selected is called anonrandom sample.c.Aconvenience sampleis a sample in which the most accessible members of the population areselected.d.Ajudgment sampleis a sample in which members of a population are selected based on the judgmentand prior knowledge of an expert.e.Aquota sampleis a sample selected in such a way that each group or subpopulation is represented inthe sample in exactly the same proportion as in the target population.1.17a.A sampling technique under which each sample of the same size has the same probability of beingselected is called asimple random sample.b.Insystematic random sampling, we first randomly select one member from the firstkunits. Then,everykthmember, starting with the first selected member, is included in the sample.c.In astratified random sample, we first divide the population into subpopulations which are calledstrata. Then, one sample is selected from each of these strata. The collection of all samples from all stratagives the stratified random sample.d.Incluster sampling, the whole population is divided into (geographical) groups calledclusters. Eachcluster is representative of the population. Then, a random sample of clusters is selected. Finally, a randomsample of elements of each of the selected clusters is selected.1.18Simple random sample1.19a.Populationb.Samplec.Populationd.Populatione.Sample1.20a.This is a nonrandom sample since students in the university who were not in her statistics class had nochance of being included in the sample.b.This is a convenience sample since students in her class were the most accessible members of thepopulation.c.This sample suffers from selection error. The population consists of all students at the university, butthe sampling frame is limited to members of her statistics class.1.21a.This is a random sample since it is selected randomly from a complete list of students at the university.Thus, each student in the population has an equal chance of being included in the sample.

Page 5

Solution Manual for Introductory Statistics, 9th Edition - Page 5 preview image

Loading page image...

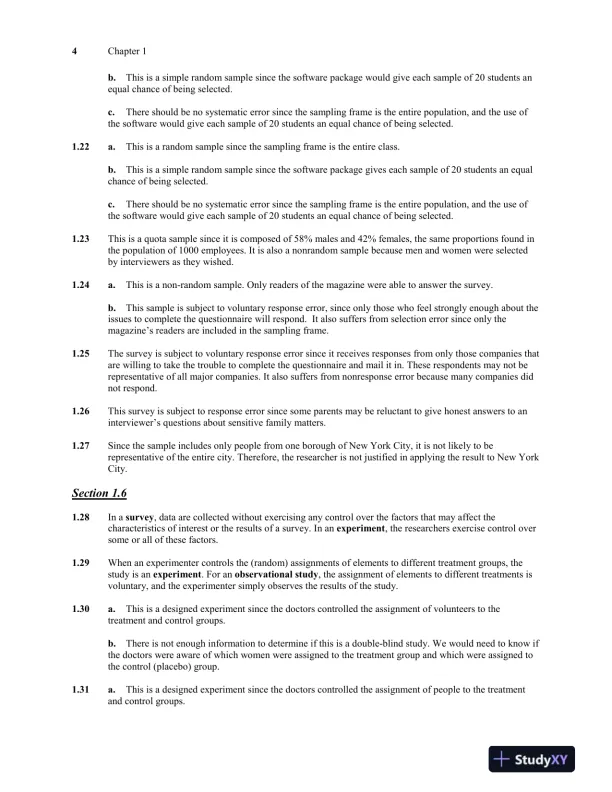
4Chapter 1b.This is a simple random sample since the software package would give each sample of 20 students anequal chance of being selected.c.There should be no systematic error since the sampling frame is the entire population, and the use ofthe software would give each sample of 20 students an equal chance of being selected.1.22a.This is a random sample since the sampling frame is the entire class.b.This is a simple random sample since the software package gives each sample of 20 students an equalchance of being selected.c.There should be no systematic error since the sampling frame is the entire population, and the use ofthe software would give each sample of 20 students an equal chance of being selected.1.23This is a quota sample since it is composed of 58% males and 42% females, the same proportions found inthe population of 1000 employees. It is also a nonrandom sample because men and women were selectedby interviewers as they wished.1.24a.This is a non-random sample. Only readers of the magazine were able to answer the survey.b.This sample is subject to voluntary response error, since only those who feel strongly enough about theissues to complete the questionnaire will respond. It also suffers from selection error since only themagazine’s readers are included in the sampling frame.1.25The survey is subject to voluntary response error since it receives responses from only those companies thatare willing to take the trouble to complete the questionnaire and mail it in. These respondents may not berepresentative of all major companies. It also suffers from nonresponse error because many companies didnot respond.1.26This survey is subject to response error since some parents may be reluctant to give honest answers to aninterviewer’s questions about sensitive family matters.1.27Since the sample includes only people from one borough of New York City, it is not likely to berepresentative of the entire city. Therefore, the researcher is not justified in applying the result to New YorkCity.Section 1.61.28In asurvey, data are collected without exercising any control over the factors that may affect thecharacteristics of interest or the results of a survey. In anexperiment, the researchers exercise control oversome or all of these factors.1.29When an experimenter controls the (random) assignments of elements to different treatment groups, thestudy is anexperiment. For anobservational study, the assignment of elements to different treatments isvoluntary, and the experimenter simply observes the results of the study.1.30a.This is a designed experiment since the doctors controlled the assignment of volunteers to thetreatment and control groups.b.There is not enough information to determine if this is a double-blind study. We would need to know ifthe doctors were aware of which women were assigned to the treatment group and which were assigned tothe control (placebo) group.1.31a.This is a designed experiment since the doctors controlled the assignment of people to the treatmentand control groups.

Page 6

Solution Manual for Introductory Statistics, 9th Edition - Page 6 preview image

Loading page image...

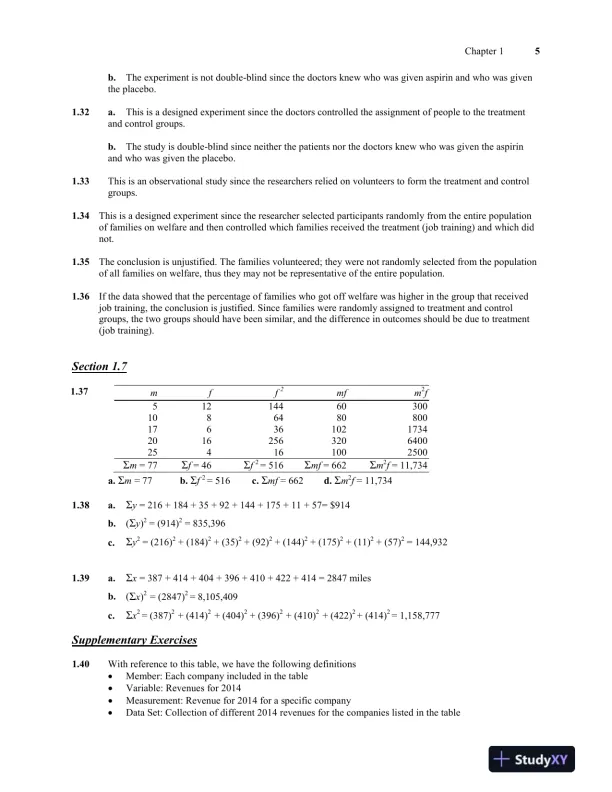
Chapter 15b.The experiment is not double-blind since the doctors knew who was given aspirin and who was giventhe placebo.1.32a.This is a designed experiment since the doctors controlled the assignment of people to the treatmentand control groups.b.The study is double-blind since neither the patients nor the doctors knew who was given the aspirinand who was given the placebo.1.33This is an observational study since the researchers relied on volunteers to form the treatment and controlgroups.1.34This is a designed experiment since the researcher selected participants randomly from the entire populationof families on welfare and then controlled which families received the treatment (job training) and which didnot.1.35The conclusion is unjustified. The families volunteered; they were not randomly selected from the populationof all families on welfare, thus they may not be representative of the entire population.1.36If the data showed that the percentage of families who got off welfare was higher in the group that receivedjob training, the conclusion is justified. Since families were randomly assigned to treatment and controlgroups, the two groups should have been similar, and the difference in outcomes should be due to treatment(job training).Section 1.71.37mff2mfm2f51214460300108648080017636102173420162563206400254161002500Σm= 77Σf= 46Σf2= 516Σmf= 662Σm2f= 11,734a.Σm= 77b.Σf2= 516c.Σmf= 662d.Σm2f= 11,7341.38a.Σy= 216 + 184 + 35 + 92 + 144 + 175 + 11 + 57= $914b.(Σy)2= (914)2= 835,396c.Σy2= (216)2+ (184)2+ (35)2+ (92)2+ (144)2+ (175)2+ (11)2+ (57)2= 144,9321.39a.Σx= 387 + 414 + 404 + 396 + 410 + 422 + 414 = 2847 milesb.(Σx)2= (2847)2= 8,105,409c.Σx2= (387)2+ (414)2+ (404)2+ (396)2+ (410)2+ (422)2+ (414)2= 1,158,777Supplementary Exercises1.40With reference to this table, we have the following definitionsMember: Each company included in the tableVariable: Revenues for 2014Measurement: Revenue for 2014 for a specific companyData Set: Collection of different 2014 revenues for the companies listed in the table

Page 7

Solution Manual for Introductory Statistics, 9th Edition - Page 7 preview image

Loading page image...

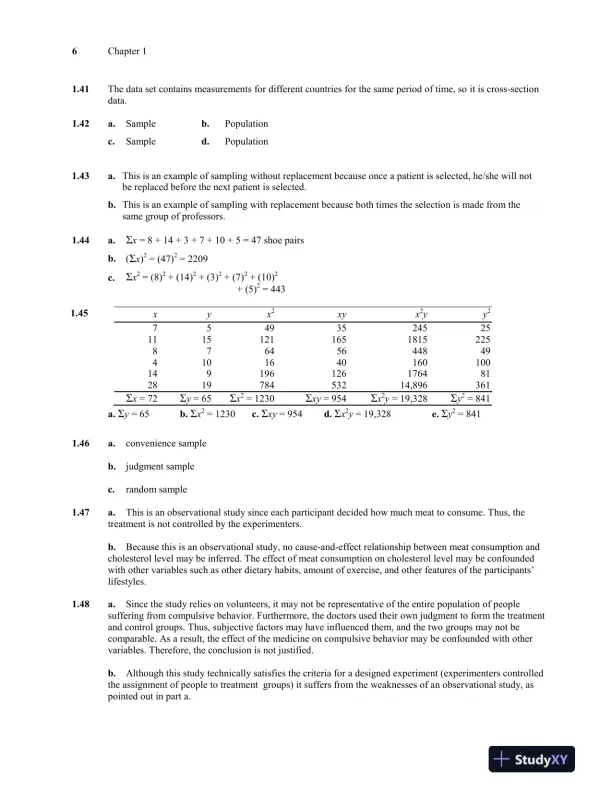
6Chapter 11.41The data set contains measurements for different countries for the same period of time, so it is cross-sectiondata.1.42a.Sampleb.Populationc.Sampled.Population1.43a.This is an example of sampling without replacement because once a patient is selected, he/she will notbe replaced before the next patient is selected.b.This is an example of sampling with replacement because both times the selection is made from thesame group of professors.1.44a.Σx= 8 + 14 + 3 + 7 + 10 + 5 = 47 shoe pairsb.(Σx)2= (47)2= 2209c.Σx2= (8)2+ (14)2+ (3)2+ (7)2+ (10)2+ (5)2= 4431.45xyx2xyx2yy27549352452511151211651815225876456448494101640160100149196126176481281978453214,896361Σx= 72Σy= 65Σx2= 1230Σxy= 954Σx2y= 19,328Σy2= 841a.Σy= 65b.Σx2= 1230c.Σxy= 954d.Σx2y= 19,328e.Σy2= 8411.46a.convenience sampleb.judgment samplec.random sample1.47a.This is an observational study since each participant decided how much meat to consume. Thus, thetreatment is not controlled by the experimenters.b.Because this is an observational study, no cause-and-effect relationship between meat consumption andcholesterol level may be inferred. The effect of meat consumption on cholesterol level may be confoundedwith other variables such as other dietary habits, amount of exercise, and other features of the participants’lifestyles.1.48a.Since the study relies on volunteers, it may not be representative of the entire population of peoplesuffering from compulsive behavior. Furthermore, the doctors used their own judgment to form the treatmentand control groups. Thus, subjective factors may have influenced them, and the two groups may not becomparable. As a result, the effect of the medicine on compulsive behavior may be confounded with othervariables. Therefore, the conclusion is not justified.b.Although this study technically satisfies the criteria for a designed experiment (experimenters controlledthe assignment of people to treatment groups) it suffers from the weaknesses of an observational study, aspointed out in part a.

Page 8

Solution Manual for Introductory Statistics, 9th Edition - Page 8 preview image

Loading page image...

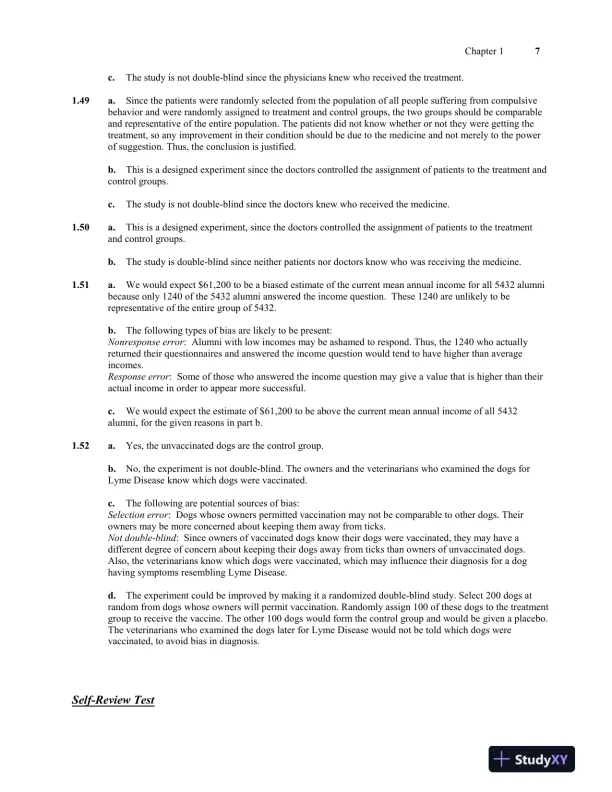
Chapter 17c.The study is not double-blind since the physicians knew who received the treatment.1.49a.Since the patients were randomly selected from the population of all people suffering from compulsivebehavior and were randomly assigned to treatment and control groups, the two groups should be comparableand representative of the entire population. The patients did not know whether or not they were getting thetreatment, so any improvement in their condition should be due to the medicine and not merely to the powerof suggestion. Thus, the conclusion is justified.b.This is a designed experiment since the doctors controlled the assignment of patients to the treatment andcontrol groups.c.The study is not double-blind since the doctors knew who received the medicine.1.50a.This is a designed experiment, since the doctors controlled the assignment of patients to the treatmentand control groups.b.The study is double-blind since neither patients nor doctors know who was receiving the medicine.1.51a.We would expect $61,200 to be a biased estimate of the current mean annual income for all 5432 alumnibecause only 1240 of the 5432 alumni answered the income question. These 1240 are unlikely to berepresentative of the entire group of 5432.b.The following types of bias are likely to be present:Nonresponse error: Alumni with low incomes may be ashamed to respond. Thus, the 1240 who actuallyreturned their questionnaires and answered the income question would tend to have higher than averageincomes.Response error: Some of those who answered the income question may give a value that is higher than theiractual income in order to appear more successful.c.We would expect the estimate of $61,200 to be above the current mean annual income of all 5432alumni, for the given reasons in part b.1.52a.Yes, the unvaccinated dogs are the control group.b.No, the experiment is not double-blind. The owners and the veterinarians who examined the dogs forLyme Disease know which dogs were vaccinated.c.The following are potential sources of bias:Selection error: Dogs whose owners permitted vaccination may not be comparable to other dogs. Theirowners may be more concerned about keeping them away from ticks.Not double-blind: Since owners of vaccinated dogs know their dogs were vaccinated, they may have adifferent degree of concern about keeping their dogs away from ticks than owners of unvaccinated dogs.Also, the veterinarians know which dogs were vaccinated, which may influence their diagnosis for a doghaving symptoms resembling Lyme Disease.d.The experiment could be improved by making it a randomized double-blind study. Select 200 dogs atrandom from dogs whose owners will permit vaccination. Randomly assign 100 of these dogs to the treatmentgroup to receive the vaccine. The other 100 dogs would form the control group and would be given a placebo.The veterinarians who examined the dogs later for Lyme Disease would not be told which dogs werevaccinated, to avoid bias in diagnosis.Self-Review Test

Page 9

Solution Manual for Introductory Statistics, 9th Edition - Page 9 preview image

Loading page image...

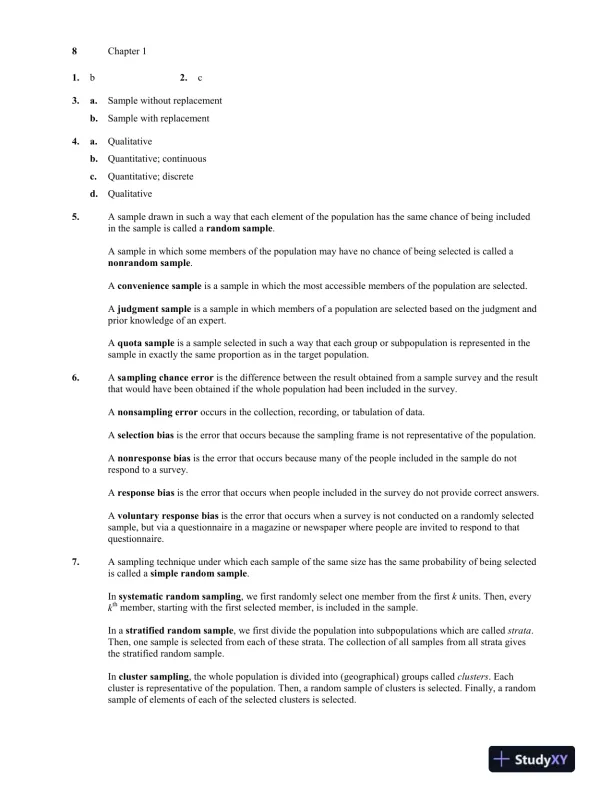
8Chapter 11.b2.c3.a.Sample without replacementb.Sample with replacement4.a.Qualitativeb.Quantitative; continuousc.Quantitative; discreted.Qualitative5.A sample drawn in such a way that each element of the population has the same chance of being includedin the sample is called arandom sample.A sample in which some members of the population may have no chance of being selected is called anonrandom sample.Aconvenience sampleis a sample in which the most accessible members of the population are selected.Ajudgment sampleis a sample in which members of a population are selected based on the judgment andprior knowledge of an expert.Aquota sampleis a sample selected in such a way that each group or subpopulation is represented in thesample in exactly the same proportion as in the target population.6.Asampling chance erroris the difference between the result obtained from a sample survey and the resultthat would have been obtained if the whole population had been included in the survey.Anonsampling erroroccurs in the collection, recording, or tabulation of data.Aselection biasis the error that occurs because the sampling frame is not representative of the population.Anonresponse biasis the error that occurs because many of the people included in the sample do notrespond to a survey.Aresponse biasis the error that occurs when people included in the survey do not provide correct answers.Avoluntary response biasis the error that occurs when a survey is not conducted on a randomly selectedsample, but via a questionnaire in a magazine or newspaper where people are invited to respond to thatquestionnaire.7.A sampling technique under which each sample of the same size has the same probability of being selectedis called asimple random sample.Insystematic random sampling, we first randomly select one member from the firstkunits. Then, everykthmember, starting with the first selected member, is included in the sample.In astratified random sample, we first divide the population into subpopulations which are calledstrata.Then, one sample is selected from each of these strata. The collection of all samples from all strata givesthe stratified random sample.Incluster sampling, the whole population is divided into (geographical) groups calledclusters. Eachcluster is representative of the population. Then, a random sample of clusters is selected. Finally, a randomsample of elements of each of the selected clusters is selected.

Page 10

Solution Manual for Introductory Statistics, 9th Edition - Page 10 preview image

Loading page image...

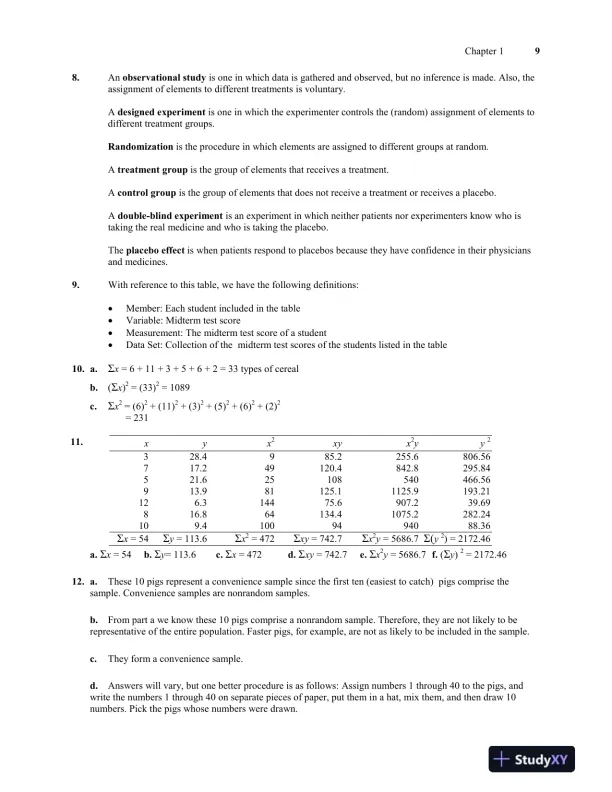
Chapter 198.Anobservational studyis one in which data is gathered and observed, but no inference is made. Also, theassignment of elements to different treatments is voluntary.Adesigned experimentis one in which the experimenter controls the (random) assignment of elements todifferent treatment groups.Randomizationis the procedure in which elements are assigned to different groups at random.Atreatment groupis the group of elements that receives a treatment.Acontrol groupis the group of elements that does not receive a treatment or receives a placebo.Adouble-blind experimentis an experiment in which neither patients nor experimenters know who istaking the real medicine and who is taking the placebo.Theplacebo effectis when patients respond to placebos because they have confidence in their physiciansand medicines.9.With reference to this table, we have the following definitions:Member: Each student included in the tableVariable:Midterm test scoreMeasurement: The midterm test score of a studentData Set: Collection of the midterm test scores of the students listed in the table10. a.Σx= 6 + 11 + 3 + 5 + 6 + 2 = 33 types of cerealb.(Σx)2= (33)2= 1089c.Σx2= (6)2+ (11)2+ (3)2+ (5)2+ (6)2+ (2)2= 23111.xyx2xyx2yy2328.4985.2255.6806.56717.249120.4842.8295.84521.625108540466.56913.981125.11125.9193.21126.314475.6907.239.69816.864134.41075.2282.24109.41009494088.36Σx= 54Σy= 113.6Σx2= 472Σxy= 742.7Σx2y= 5686.7Σ(y2) = 2172.46a.Σx= 54b.Σy= 113.6c.Σx= 472d.Σxy= 742.7e.Σx2y= 5686.7f.(Σy)2= 2172.4612. a.These 10 pigs represent a convenience sample since the first ten (easiest to catch) pigs comprise thesample. Convenience samples are nonrandom samples.b.From part a we know these 10 pigs comprise a nonrandom sample. Therefore, they are not likely to berepresentative of the entire population. Faster pigs, for example, are not as likely to be included in the sample.c.They form a convenience sample.d.Answers will vary, but one better procedure is as follows: Assign numbers 1 through 40 to the pigs, andwrite the numbers 1 through 40 on separate pieces of paper, put them in a hat, mix them, and then draw 10numbers. Pick the pigs whose numbers were drawn.

Page 11

Solution Manual for Introductory Statistics, 9th Edition - Page 11 preview image

Loading page image...

10Chapter 113. a.No, this method is not likely to produce a random sample.b.The following types of biases are likely to be present:Voluntary Response Error: Only readers that have a strong opinion and are willing to pay $1 to respondwill do so.Selection Error: Not all members of the population are included; only those who actually read thatnewspaper may participateResponse Error: A group may have a financial interest in the casino and place many calls in order toinfluence the outcome of the poll.14. a.This is a designed experiment since the doctors controlled the assignment of dieters to the lower sugar andcontrol groups.b.Yes, those who received as much as ten percent of their calories from sucrose were the control group.c.No, this was not a double-blind experiment since both the doctors and dieters knew who was on the lowsugar diet and who was not.15.observational study16.randomized experiment

Page 12

Solution Manual for Introductory Statistics, 9th Edition - Page 12 preview image

Loading page image...

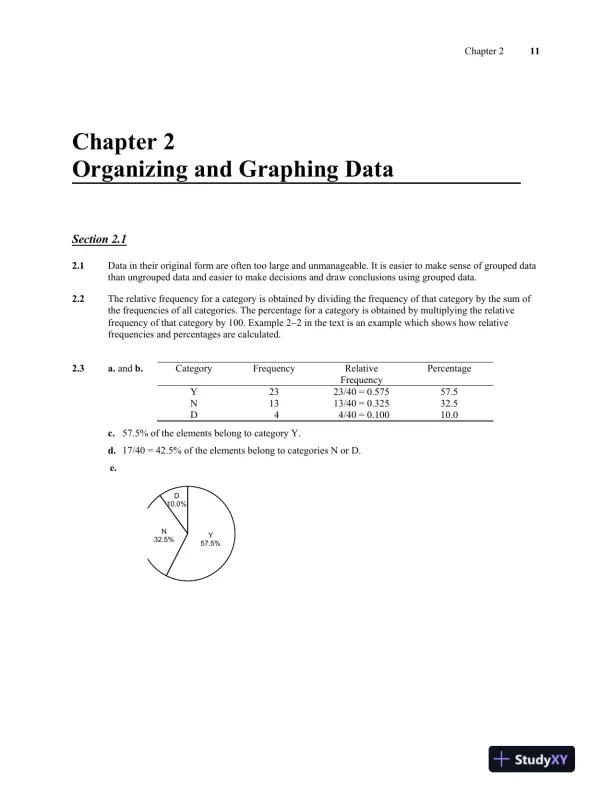
Chapter 211Chapter 2Organizing and Graphing DataSection 2.12.1Data in their original form are often too large and unmanageable. It is easier to make sense of grouped datathan ungrouped data and easier to make decisions and draw conclusions using grouped data.2.2The relative frequency for a category is obtained by dividing the frequency of that category by the sum ofthe frequencies of all categories. The percentage for a category is obtained by multiplying the relativefrequency of that category by 100. Example 22 in the text is an example which shows how relativefrequencies and percentages are calculated.2.3a.andb.CategoryFrequencyRelativeFrequencyPercentageY2323/40 = 0.57557.5N1313/40 = 0.32532.5D44/40 = 0.10010.0c.57.5% of the elements belong to category Y.d.17/40 = 42.5% of the elements belong to categories N or D.e.Y57.5%N32.5%D10.0%

Page 13

Solution Manual for Introductory Statistics, 9th Edition - Page 13 preview image

Loading page image...

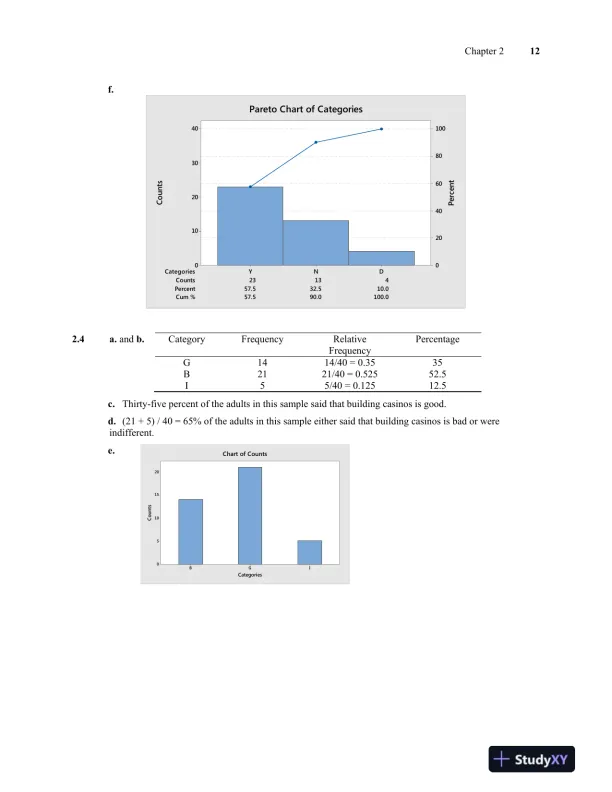
Chapter 212f.2.4a.andb.CategoryFrequencyRelativeFrequencyPercentageG1414/40 = 0.3535B2121/40 = 0.52552.5I55/40 = 0.12512.5c.Thirty-five percent of the adults in this sample said that building casinos is good.d.(21 + 5) / 40 = 65% of the adults in this sample either said that building casinos is bad or wereindifferent.e.Counts23134Percent57.532.510.0Cum %57.590.0100.0CategoriesDNY403020100100806040200CountsPercentPareto Chart of CategoriesIGB20151050CategoriesCountsChart of Counts

Page 14

Solution Manual for Introductory Statistics, 9th Edition - Page 14 preview image

Loading page image...

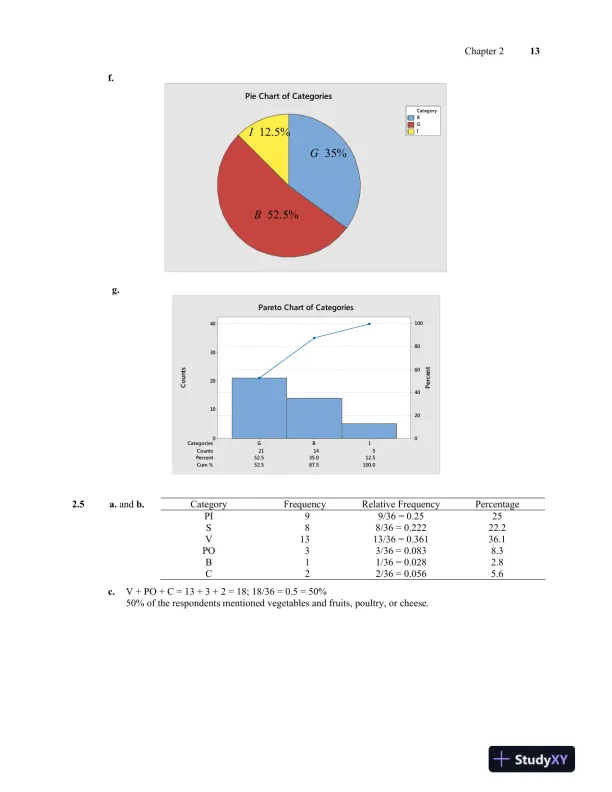
Chapter 213f.g.2.5a.andb.CategoryFrequencyRelative FrequencyPercentagePI99/36 = 0.2525S88/36 = 0.22222.2V1313/36 = 0.36136.1PO33/36 = 0.0838.3B11/36 = 0.0282.8C22/36 = 0.0565.6c.V + PO + C = 13 + 3 + 2 = 18; 18/36 = 0.5 = 50%50% of the respondents mentioned vegetables and fruits, poultry, or cheese.BGICategoryPie Chart of CategoriesCounts21145Percent52.535.012.5Cum %52.587.5100.0CategoriesIBG403020100100806040200CountsPercentPareto Chart of Categories35%G12.5%I52.5%B

Page 15

Solution Manual for Introductory Statistics, 9th Edition - Page 15 preview image

Loading page image...

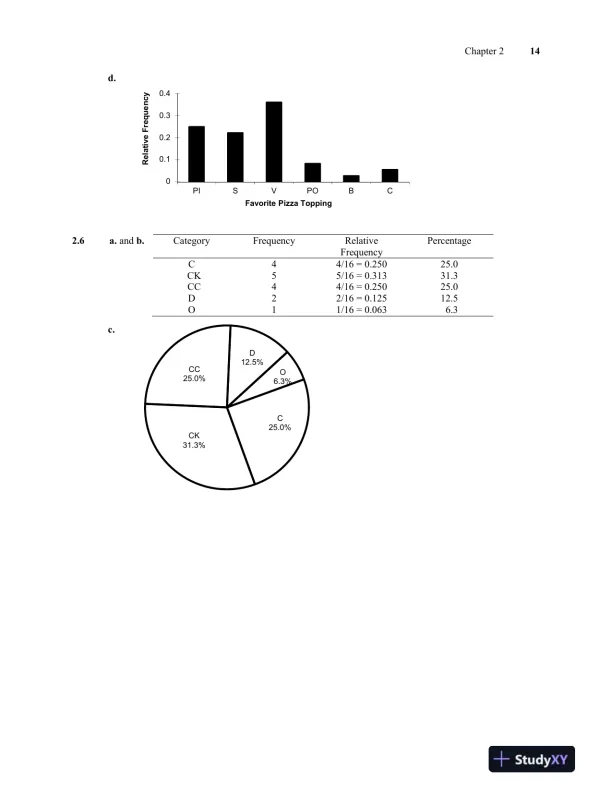
Chapter 214d.2.6a.andb.CategoryFrequencyRelativeFrequencyPercentageC44/16 = 0.25025.0CK55/16 = 0.31331.3CC44/16 = 0.25025.0D22/16 = 0.12512.5O11/16 = 0.0636.3c.00.10.20.30.4PISVPOBCRelative FrequencyFavorite Pizza ToppingC25.0%CK31.3%CC25.0%D12.5%O6.3%

Page 16

Solution Manual for Introductory Statistics, 9th Edition - Page 16 preview image

Loading page image...

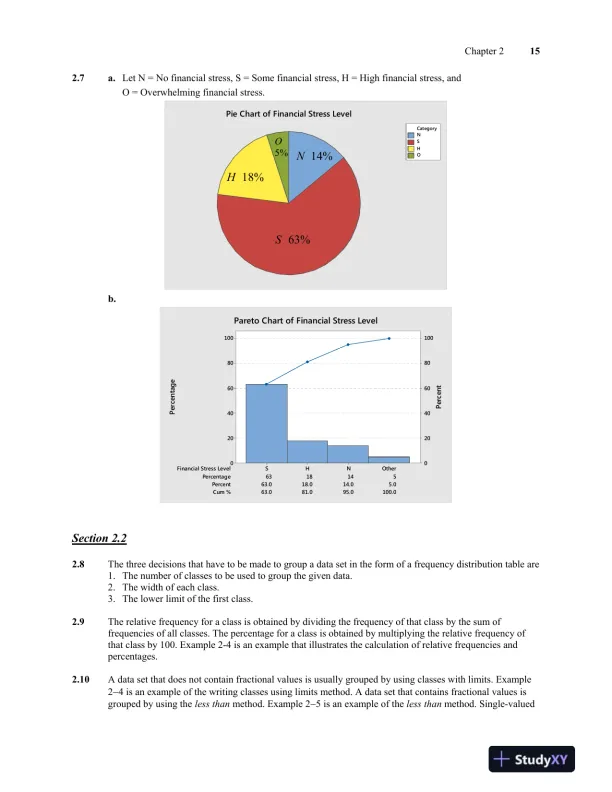
Chapter 2152.7a.Let N = No financial stress, S = Some financial stress, H = High financial stress, andO = Overwhelming financial stress.b.Section 2.22.8The three decisions that have to be made to group a data set in the form of a frequency distribution table are1.The number of classes to be used to group the given data.2.The width of each class.3.The lower limit of the first class.2.9The relative frequency for a class is obtained by dividing the frequency of that class by the sum offrequencies of all classes. The percentage for a class is obtained by multiplying the relative frequency ofthat class by 100. Example 2-4 is an example that illustrates the calculation of relative frequencies andpercentages.2.10A data set that does not contain fractional values is usually grouped by using classes with limits. Example24 is an example of the writing classes using limits method. A data set that contains fractional values isgrouped by using theless thanmethod. Example 25 is an example of theless thanmethod. Single-valuedNSHOCategoryPie Chart of Financial Stress LevelPercentage6318145Percent63.018.014.05.0Cum %63.081.095.0100.0Financial Stress LevelOtherNHS100806040200100806040200PercentagePercentPareto Chart of Financial Stress Level18%H63%S14%N5%O
Preview Mode

This document has 319 pages. Sign in to access the full document!

Study Now!

XY-Copilot AI
Unlimited Access
Secure Payment
Instant Access
24/7 Support
Document Chat

Document Details

Subject
Statistics

Related Documents

View all