Solution Manual for Introductory Statistics: Exploring the World Through Data, 3rd Edition

Solution Manual for Introductory Statistics: Exploring the World Through Data, 3rd Edition makes textbook problem-solving simple, with detailed answers that make learning fun.

Julian Cooper
Contributor
4.9
30
5 months ago
Preview (16 of 219 Pages)
100%
Purchase to unlock

Page 1

Solution Manual for Introductory Statistics: Exploring the World Through Data, 3rd Edition - Page 1 preview image

Loading page image...

SOLUTIONSMANUALINTRODUCTORYSTATISTICS:EXPLORING THEWORDTHROUGHDATATHIRDEDITIONRobert GouldUniversity of California, Los AngelesRebecca WongWest Valley CollegeColleen RyanMoorpark Community College

Page 2

Solution Manual for Introductory Statistics: Exploring the World Through Data, 3rd Edition - Page 2 preview image

Loading page image...

Page 3

Solution Manual for Introductory Statistics: Exploring the World Through Data, 3rd Edition - Page 3 preview image

Loading page image...

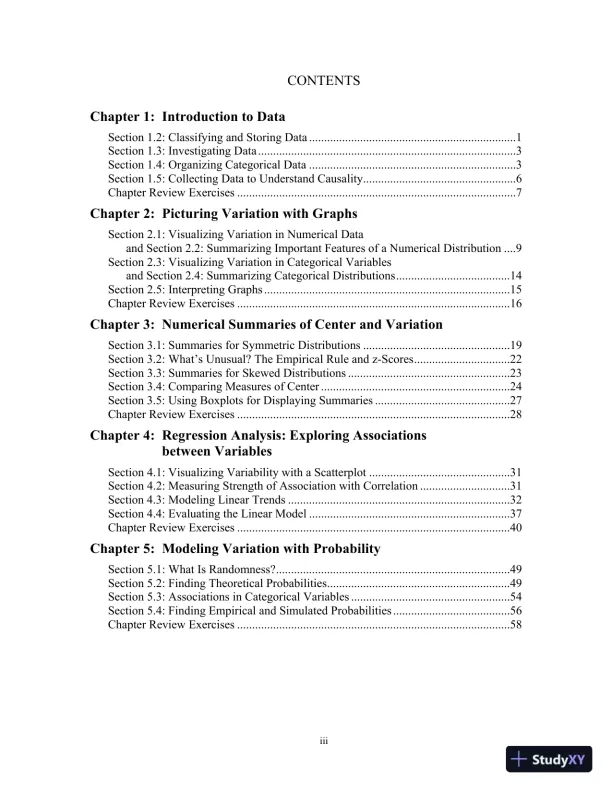
iiiCONTENTSChapter 1: Introduction to DataSection 1.2: Classifying and Storing Data .....................................................................1Section 1.3: Investigating Data ......................................................................................3Section 1.4: Organizing Categorical Data .....................................................................3Section 1.5: Collecting Data to Understand Causality...................................................6Chapter Review Exercises .............................................................................................7Chapter 2: Picturing Variation with GraphsSection 2.1: Visualizing Variation in Numerical Dataand Section 2.2: Summarizing Important Features of a Numerical Distribution ....9Section 2.3: Visualizing Variation in Categorical Variablesand Section 2.4: Summarizing Categorical Distributions......................................14Section 2.5: Interpreting Graphs ..................................................................................15Chapter Review Exercises ...........................................................................................16Chapter 3: Numerical Summaries of Center and VariationSection 3.1: Summaries for Symmetric Distributions .................................................19Section 3.2: What’s Unusual? The Empirical Rule and z-Scores................................22Section 3.3: Summaries for Skewed Distributions ......................................................23Section 3.4: Comparing Measures of Center ...............................................................24Section 3.5: Using Boxplots for Displaying Summaries .............................................27Chapter Review Exercises ...........................................................................................28Chapter 4: Regression Analysis: Exploring Associationsbetween VariablesSection 4.1: Visualizing Variability with a Scatterplot ...............................................31Section 4.2: Measuring Strength of Association with Correlation ..............................31Section 4.3: Modeling Linear Trends ..........................................................................32Section 4.4: Evaluating the Linear Model ...................................................................37Chapter Review Exercises ...........................................................................................40Chapter 5: Modeling Variation with ProbabilitySection 5.1: What Is Randomness?..............................................................................49Section 5.2: Finding Theoretical Probabilities.............................................................49Section 5.3: Associations in Categorical Variables .....................................................54Section 5.4: Finding Empirical and Simulated Probabilities .......................................56Chapter Review Exercises ...........................................................................................58

Page 4

Solution Manual for Introductory Statistics: Exploring the World Through Data, 3rd Edition - Page 4 preview image

Loading page image...

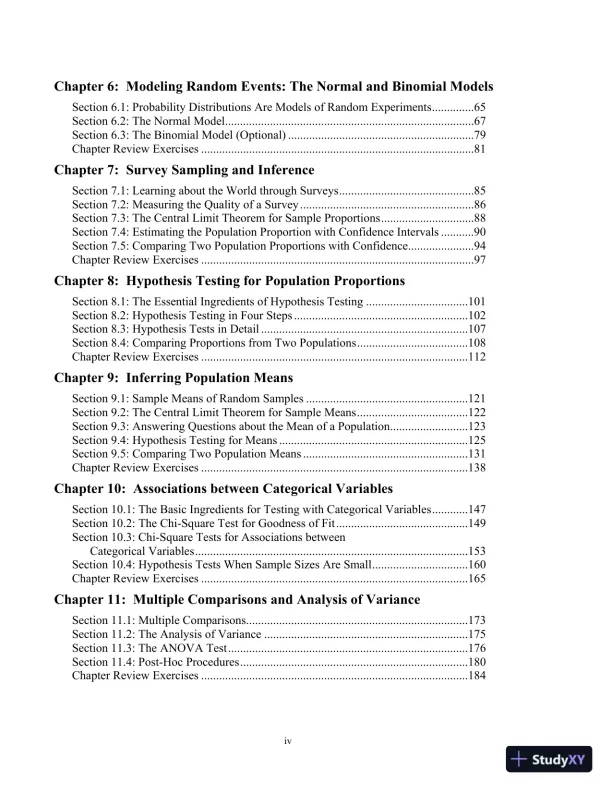
ivChapter 6: Modeling Random Events: The Normal and Binomial ModelsSection 6.1: Probability Distributions Are Models of Random Experiments..............65Section 6.2: The Normal Model...................................................................................67Section 6.3: The Binomial Model (Optional) ..............................................................79Chapter Review Exercises ...........................................................................................81Chapter 7: Survey Sampling and InferenceSection 7.1: Learning about the World through Surveys.............................................85Section 7.2: Measuring the Quality of a Survey ..........................................................86Section 7.3: The Central Limit Theorem for Sample Proportions...............................88Section 7.4: Estimating the Population Proportion with Confidence Intervals ...........90Section 7.5: Comparing Two Population Proportions with Confidence......................94Chapter Review Exercises ...........................................................................................97Chapter 8: Hypothesis Testing for Population ProportionsSection 8.1: The Essential Ingredients of Hypothesis Testing ..................................101Section 8.2: Hypothesis Testing in Four Steps ..........................................................102Section 8.3: Hypothesis Tests in Detail .....................................................................107Section 8.4: Comparing Proportions from Two Populations.....................................108Chapter Review Exercises .........................................................................................112Chapter 9: Inferring Population MeansSection 9.1: Sample Means of Random Samples ......................................................121Section 9.2: The Central Limit Theorem for Sample Means.....................................122Section 9.3: Answering Questions about the Mean of a Population..........................123Section 9.4: Hypothesis Testing for Means ...............................................................125Section 9.5: Comparing Two Population Means .......................................................131Chapter Review Exercises .........................................................................................138Chapter 10: Associations between Categorical VariablesSection 10.1: The Basic Ingredients for Testing with Categorical Variables............147Section 10.2: The Chi-Square Test for Goodness of Fit............................................149Section 10.3: Chi-Square Tests for Associations betweenCategorical Variables...........................................................................................153Section 10.4: Hypothesis Tests When Sample Sizes Are Small................................160Chapter Review Exercises .........................................................................................165Chapter 11: Multiple Comparisons and Analysis of VarianceSection 11.1: Multiple Comparisons..........................................................................173Section 11.2: The Analysis of Variance ....................................................................175Section 11.3: The ANOVA Test................................................................................176Section 11.4: Post-Hoc Procedures............................................................................180Chapter Review Exercises .........................................................................................184

Page 5

Solution Manual for Introductory Statistics: Exploring the World Through Data, 3rd Edition - Page 5 preview image

Loading page image...

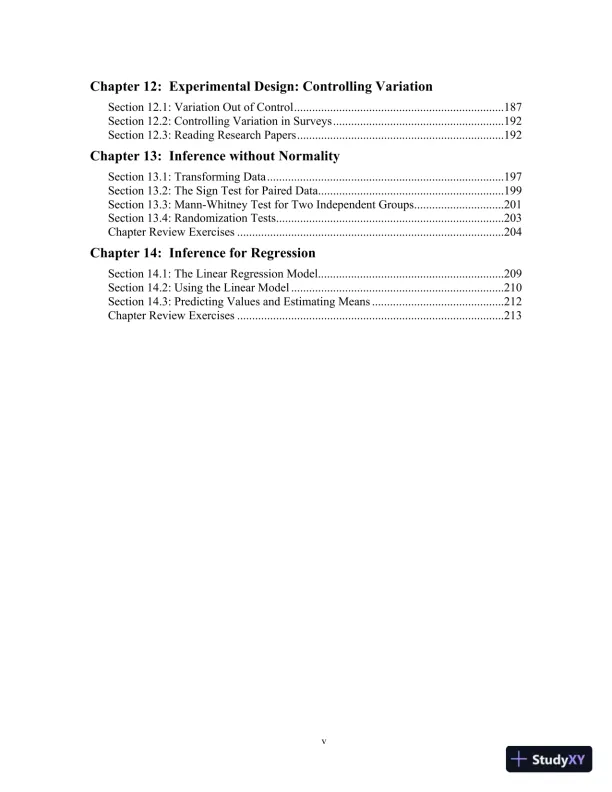
vChapter 12: Experimental Design: Controlling VariationSection 12.1: Variation Out of Control......................................................................187Section 12.2: Controlling Variation in Surveys.........................................................192Section 12.3: Reading Research Papers.....................................................................192Chapter 13: Inference without NormalitySection 13.1: Transforming Data...............................................................................197Section 13.2: The Sign Test for Paired Data..............................................................199Section 13.3: Mann-Whitney Test for Two Independent Groups..............................201Section 13.4: Randomization Tests............................................................................203Chapter Review Exercises .........................................................................................204Chapter 14: Inference for RegressionSection 14.1: The Linear Regression Model..............................................................209Section 14.2: Using the Linear Model .......................................................................210Section 14.3: Predicting Values and Estimating Means ............................................212Chapter Review Exercises .........................................................................................213

Page 6

Solution Manual for Introductory Statistics: Exploring the World Through Data, 3rd Edition - Page 6 preview image

Loading page image...

Page 7

Solution Manual for Introductory Statistics: Exploring the World Through Data, 3rd Edition - Page 7 preview image

Loading page image...

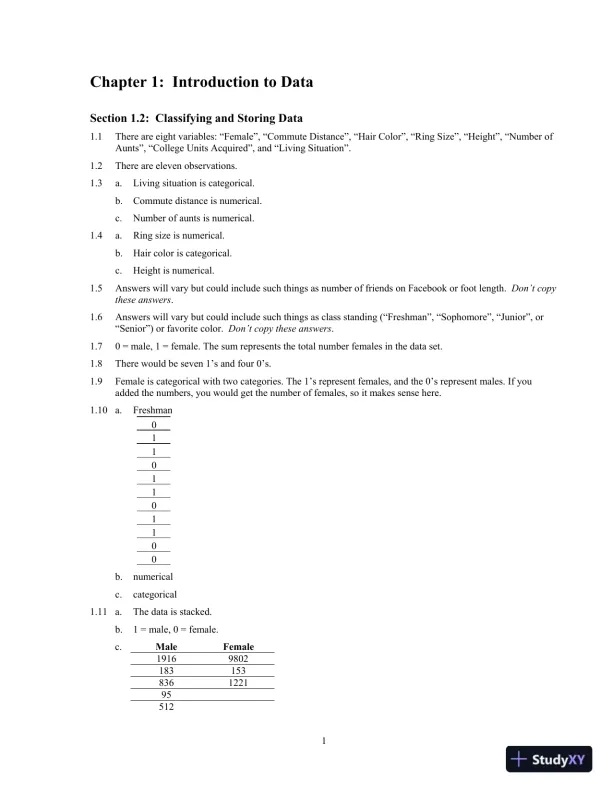
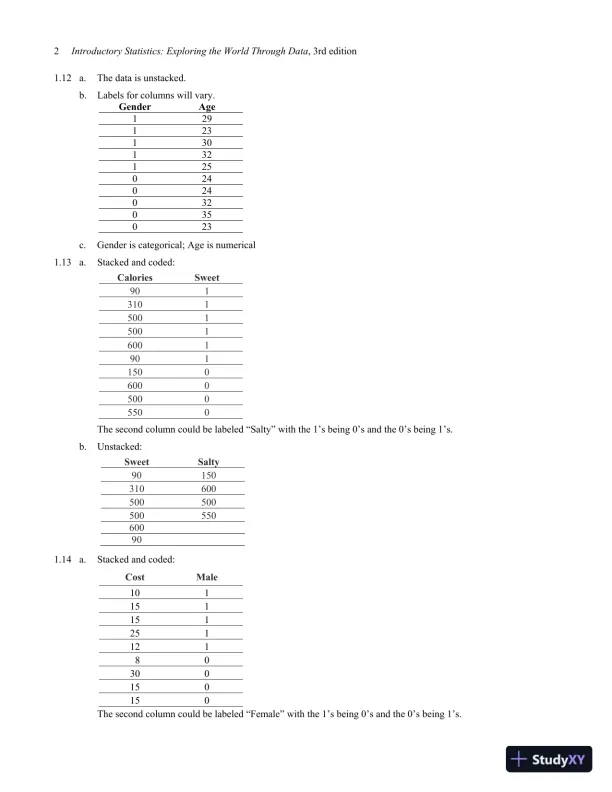
1Chapter 1: Introduction to DataSection 1.2: Classifying and Storing Data1.1There are eight variables: “Female”, “Commute Distance”, “Hair Color”, “Ring Size”, “Height”, “Number ofAunts”, “College Units Acquired”, and “Living Situation”.1.2There are eleven observations.1.3a.Living situation is categorical.b.Commute distance is numerical.c.Number of aunts is numerical.1.4a.Ring size is numerical.b.Hair color is categorical.c.Height is numerical.1.5Answers will vary but could include such things as number of friends on Facebook or foot length.Don’t copythese answers.1.6Answers will vary but could include such things as class standing (“Freshman”, “Sophomore”, “Junior”, or“Senior”) or favorite color.Don’t copy these answers.1.70 = male, 1 = female. The sum represents the total number females in the data set.1.8There would be seven 1’s and four 0’s.1.9Female is categorical with two categories. The 1’s represent females, and the 0’s represent males. If youadded the numbers, you would get the number of females, so it makes sense here.1.10a.Freshmanb.numericalc.categorical1.11a.The data is stacked.b.1 = male, 0 = female.c.MaleFemale1916980218315383612219551201101101100

Page 8

Solution Manual for Introductory Statistics: Exploring the World Through Data, 3rd Edition - Page 8 preview image

Loading page image...

2Introductory Statistics: Exploring the World Through Data, 3rd edition1.12a.The data is unstacked.b.Labels for columns will vary.GenderAge129123130132125024024032035023c.Gender is categorical; Age is numerical1.13a.Stacked and coded:The second column could be labeled “Salty” with the 1’s being 0’s and the 0’s being 1’s.b.Unstacked:1.14a.Stacked and coded:The second column could be labeled “Female” with the 1’s being 0’s and the 0’s being 1’s.CaloriesSweet90131015001500160019011500600050005500SweetSalty9015031060050050050055060090CostMale10115115125112180300150150

Page 9

Solution Manual for Introductory Statistics: Exploring the World Through Data, 3rd Edition - Page 9 preview image

Loading page image...

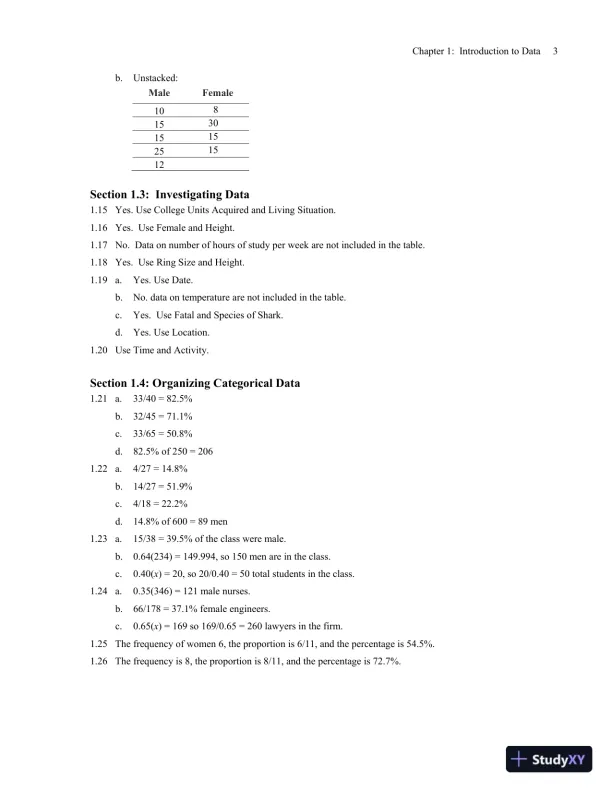
Chapter 1: Introduction to Data3b.Unstacked:Section 1.3: Investigating Data1.15Yes. Use College Units Acquired and Living Situation.1.16Yes. Use Female and Height.1.17No. Data on number of hours of study per week are not included in the table.1.18Yes. Use Ring Size and Height.1.19a.Yes. Use Date.b.No. data on temperature are not included in the table.c.Yes. Use Fatal and Species of Shark.d.Yes. Use Location.1.20Use Time and Activity.Section 1.4: Organizing Categorical Data1.21a.33/40 = 82.5%b.32/45 = 71.1%c.33/65 = 50.8%d.82.5% of 250 = 2061.22a.4/27 = 14.8%b.14/27 = 51.9%c.4/18 = 22.2%d.14.8% of 600 = 89 men1.23a.15/38 = 39.5% of the class were male.b.0.64(234) = 149.994, so 150 men are in the class.c.0.40(x) = 20, so 20/0.40 = 50 total students in the class.1.24a.0.35(346) = 121 male nurses.b.66/178 = 37.1% female engineers.c.0.65(x) = 169 so 169/0.65 = 260 lawyers in the firm.1.25The frequency of women 6, the proportion is 6/11, and the percentage is 54.5%.1.26The frequency is 8, the proportion is 8/11, and the percentage is 72.7%.MaleFemale10815301515251512

Page 10

Solution Manual for Introductory Statistics: Exploring the World Through Data, 3rd Edition - Page 10 preview image

Loading page image...

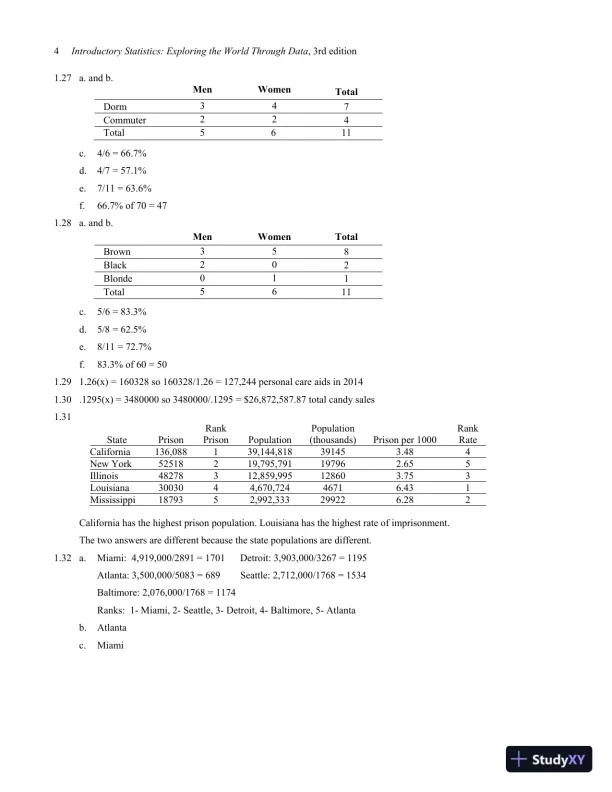
4Introductory Statistics: Exploring the World Through Data, 3rd edition1.27a. and b.MenWomenTotalDorm347Commuter224Total5611c.4/6 = 66.7%d.4/7 = 57.1%e.7/11 = 63.6%f.66.7% of 70 = 471.28a. and b.MenWomenTotalBrown358Black202Blonde011Total5611c.5/6 = 83.3%d.5/8 = 62.5%e.8/11 = 72.7%f.83.3% of 60 = 501.291.26(x) = 160328 so 160328/1.26 = 127,244 personal care aids in 20141.30.1295(x) = 3480000 so 3480000/.1295 = $26,872,587.87 total candy sales1.31StatePrisonRankPrisonPopulationPopulation(thousands)Prison per 1000RankRateCalifornia136,088139,144,818391453.484New York52518219,795,791197962.655Illinois48278312,859,995128603.753Louisiana3003044,670,72446716.431Mississippi1879352,992,333299226.282California has the highest prison population. Louisiana has the highest rate of imprisonment.The two answers are different because the state populations are different.1.32a.Miami: 4,919,000/2891 = 1701Detroit: 3,903,000/3267 = 1195Atlanta: 3,500,000/5083 = 689Seattle: 2,712,000/1768 = 1534Baltimore: 2,076,000/1768 = 1174Ranks: 1- Miami, 2- Seattle, 3- Detroit, 4- Baltimore, 5- Atlantab.Atlantac.Miami

Page 11

Solution Manual for Introductory Statistics: Exploring the World Through Data, 3rd Edition - Page 11 preview image

Loading page image...

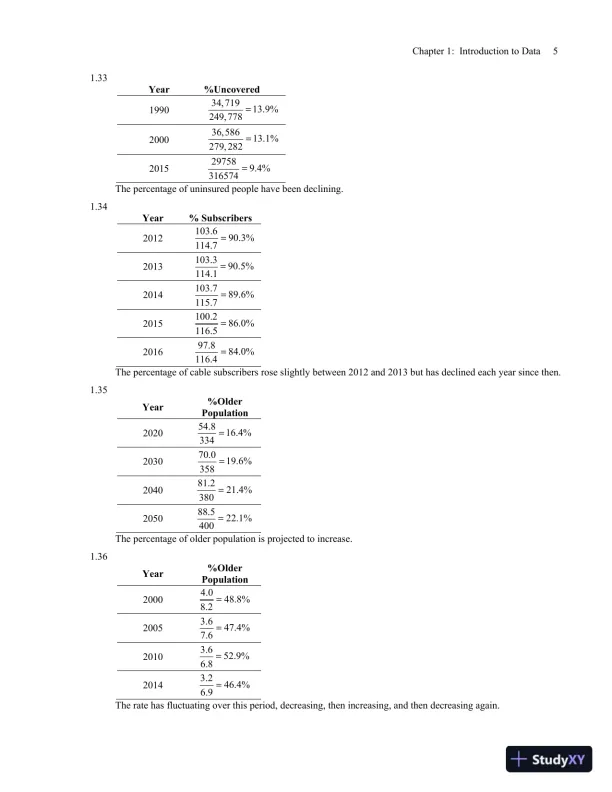
Chapter 1: Introduction to Data51.33Year%Uncovered199034, 71913.9%249, 778200036,58613.1%279, 2822015297589.4%316574The percentage of uninsured people have been declining.1.34Year% Subscribers2012103.690.3%114.72013103.390.5%114.12014103.789.6%115.72015100.286.0%116.5201697.884.0%116.4The percentage of cable subscribers rose slightly between 2012 and 2013 but has declined each year since then.1.35Year%OlderPopulation202054.816.4%334203070.019.6%358204081.221.4%380205088.522.1%400The percentage of older population is projected to increase.1.36Year%OlderPopulation20004.048.8%8.220053.647.4%7.620103.652.9%6.820143.246.4%6.9The rate has fluctuating over this period, decreasing, then increasing, and then decreasing again.

Page 12

Solution Manual for Introductory Statistics: Exploring the World Through Data, 3rd Edition - Page 12 preview image

Loading page image...

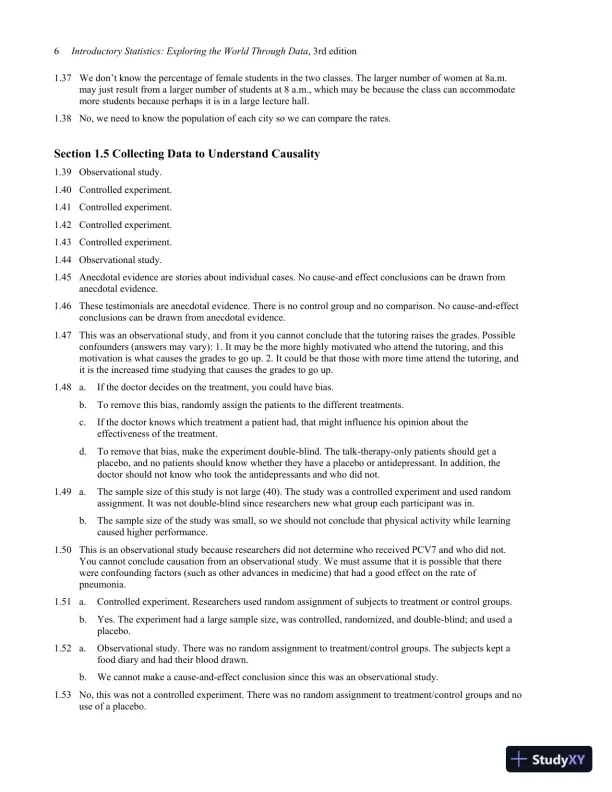
6Introductory Statistics: Exploring the World Through Data, 3rd edition1.37We don’t know the percentage of female students in the two classes. The larger number of women at 8a.m.may just result from a larger number of students at 8 a.m., which may be because the class can accommodatemore students because perhaps it is in a large lecture hall.1.38No, we need to know the population of each city so we can compare the rates.Section 1.5 Collecting Data to Understand Causality1.39Observational study.1.40Controlled experiment.1.41Controlled experiment.1.42Controlled experiment.1.43Controlled experiment.1.44Observational study.1.45Anecdotal evidence are stories about individual cases. No cause-and effect conclusions can be drawn fromanecdotal evidence.1.46These testimonials are anecdotal evidence. There is no control group and no comparison. No cause-and-effectconclusions can be drawn from anecdotal evidence.1.47This was an observational study, and from it you cannot conclude that the tutoring raises the grades. Possibleconfounders (answers may vary): 1. It may be the more highly motivated who attend the tutoring, and thismotivation is what causes the grades to go up. 2. It could be that those with more time attend the tutoring, andit is the increased time studying that causes the grades to go up.1.48a.If the doctor decides on the treatment, you could have bias.b.To remove this bias, randomly assign the patients to the different treatments.c.If the doctor knows which treatment a patient had, that might influence his opinion about theeffectiveness of the treatment.d.To remove that bias, make the experiment double-blind. The talk-therapy-only patients should get aplacebo, and no patients should know whether they have a placebo or antidepressant. In addition, thedoctor should not know who took the antidepressants and who did not.1.49a.The sample size of this study is not large (40). The study was a controlled experiment and used randomassignment. It was not double-blind since researchers new what group each participant was in.b.The sample size of the study was small, so we should not conclude that physical activity while learningcaused higher performance.1.50This is an observational study because researchers did not determine who received PCV7 and who did not.You cannot conclude causation from an observational study. We must assume that it is possible that therewere confounding factors (such as other advances in medicine) that had a good effect on the rate ofpneumonia.1.51a.Controlled experiment. Researchers used random assignment of subjects to treatment or control groups.b.Yes. The experiment had a large sample size, was controlled, randomized, and double-blind; and used aplacebo.1.52a.Observational study. There was no random assignment to treatment/control groups. The subjects kept afood diary and had their blood drawn.b.We cannot make a cause-and-effect conclusion since this was an observational study.1.53No, this was not a controlled experiment. There was no random assignment to treatment/control groups and nouse of a placebo.

Page 13

Solution Manual for Introductory Statistics: Exploring the World Through Data, 3rd Edition - Page 13 preview image

Loading page image...

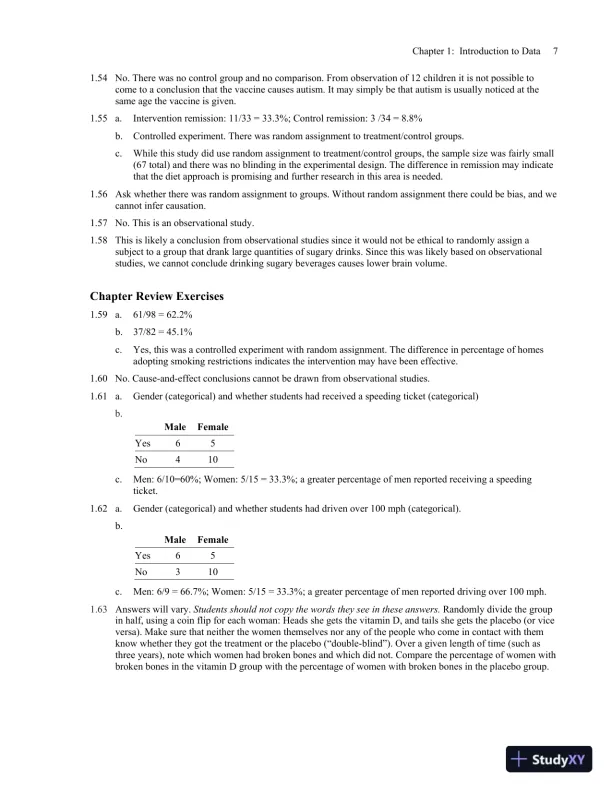
Chapter 1: Introduction to Data71.54No. There was no control group and no comparison. From observation of 12 children it is not possible tocome to a conclusion that the vaccine causes autism. It may simply be that autism is usually noticed at thesame age the vaccine is given.1.55a.Intervention remission: 11/33 = 33.3%; Control remission: 3 /34 = 8.8%b.Controlled experiment. There was random assignment to treatment/control groups.c.While this study did use random assignment to treatment/control groups, the sample size was fairly small(67 total) and there was no blinding in the experimental design. The difference in remission may indicatethat the diet approach is promising and further research in this area is needed.1.56Ask whether there was random assignment to groups. Without random assignment there could be bias, and wecannot infer causation.1.57No. This is an observational study.1.58This is likely a conclusion from observational studies since it would not be ethical to randomly assign asubject to a group that drank large quantities of sugary drinks. Since this was likely based on observationalstudies, we cannot conclude drinking sugary beverages causes lower brain volume.Chapter Review Exercises1.59a.61/98 = 62.2%b.37/82 = 45.1%c.Yes, this was a controlled experiment with random assignment. The difference in percentage of homesadopting smoking restrictions indicates the intervention may have been effective.1.60No. Cause-and-effect conclusions cannot be drawn from observational studies.1.61a.Gender (categorical) and whether students had received a speeding ticket (categorical)b.MaleFemaleYes65No410c.Men: 6/10=60%; Women: 5/15 = 33.3%; a greater percentage of men reported receiving a speedingticket.1.62a.Gender (categorical) and whether students had driven over 100 mph (categorical).b.MaleFemaleYes65No310c.Men: 6/9 = 66.7%; Women: 5/15 = 33.3%; a greater percentage of men reported driving over 100 mph.1.63Answers will vary.Students should not copy the words they see in these answers.Randomly divide the groupin half, using a coin flip for each woman: Heads she gets the vitamin D, and tails she gets the placebo (or viceversa). Make sure that neither the women themselves nor any of the people who come in contact with themknow whether they got the treatment or the placebo (“double-blind”). Over a given length of time (such asthree years), note which women had broken bones and which did not. Compare the percentage of women withbroken bones in the vitamin D group with the percentage of women with broken bones in the placebo group.

Page 14

Solution Manual for Introductory Statistics: Exploring the World Through Data, 3rd Edition - Page 14 preview image

Loading page image...

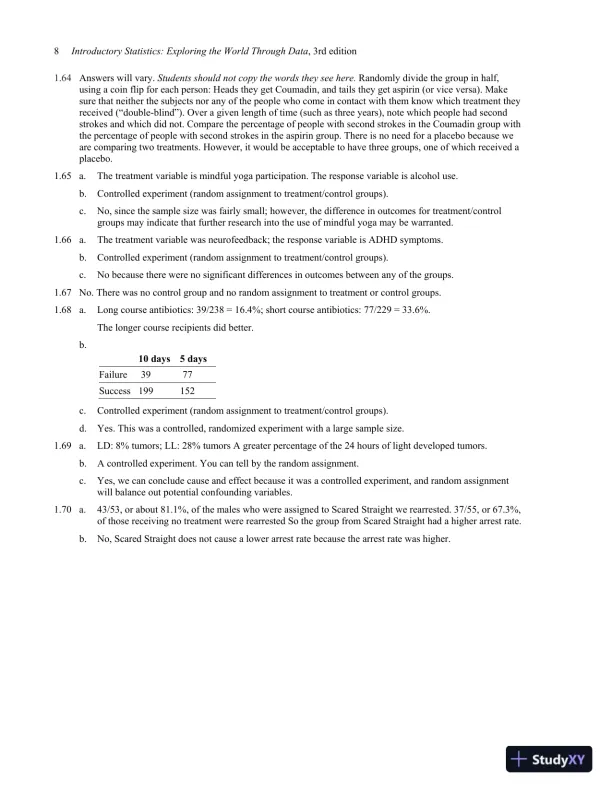
8Introductory Statistics: Exploring the World Through Data, 3rd edition1.64Answers will vary.Students should not copy the words they see here.Randomly divide the group in half,using a coin flip for each person: Heads they get Coumadin, and tails they get aspirin (or vice versa). Makesure that neither the subjects nor any of the people who come in contact with them know which treatment theyreceived (“double-blind”). Over a given length of time (such as three years), note which people had secondstrokes and which did not. Compare the percentage of people with second strokes in the Coumadin group withthe percentage of people with second strokes in the aspirin group. There is no need for a placebo because weare comparing two treatments. However, it would be acceptable to have three groups, one of which received aplacebo.1.65a.The treatment variable is mindful yoga participation. The response variable is alcohol use.b.Controlled experiment (random assignment to treatment/control groups).c.No, since the sample size was fairly small; however, the difference in outcomes for treatment/controlgroups may indicate that further research into the use of mindful yoga may be warranted.1.66a.The treatment variable was neurofeedback; the response variable is ADHD symptoms.b.Controlled experiment (random assignment to treatment/control groups).c.No because there were no significant differences in outcomes between any of the groups.1.67No. There was no control group and no random assignment to treatment or control groups.1.68a.Long course antibiotics: 39/238 = 16.4%; short course antibiotics: 77/229 = 33.6%.The longer course recipients did better.b.10 days5 daysFailure3977Success199152c.Controlled experiment (random assignment to treatment/control groups).d.Yes. This was a controlled, randomized experiment with a large sample size.1.69a.LD: 8% tumors; LL: 28% tumors A greater percentage of the 24 hours of light developed tumors.b.A controlled experiment. You can tell by the random assignment.c.Yes, we can conclude cause and effect because it was a controlled experiment, and random assignmentwill balance out potential confounding variables.1.70a.43/53, or about 81.1%, of the males who were assigned to Scared Straight we rearrested. 37/55, or 67.3%,of those receiving no treatment were rearrested So the group from Scared Straight had a higher arrest rate.b.No, Scared Straight does not cause a lower arrest rate because the arrest rate was higher.

Page 15

Solution Manual for Introductory Statistics: Exploring the World Through Data, 3rd Edition - Page 15 preview image

Loading page image...

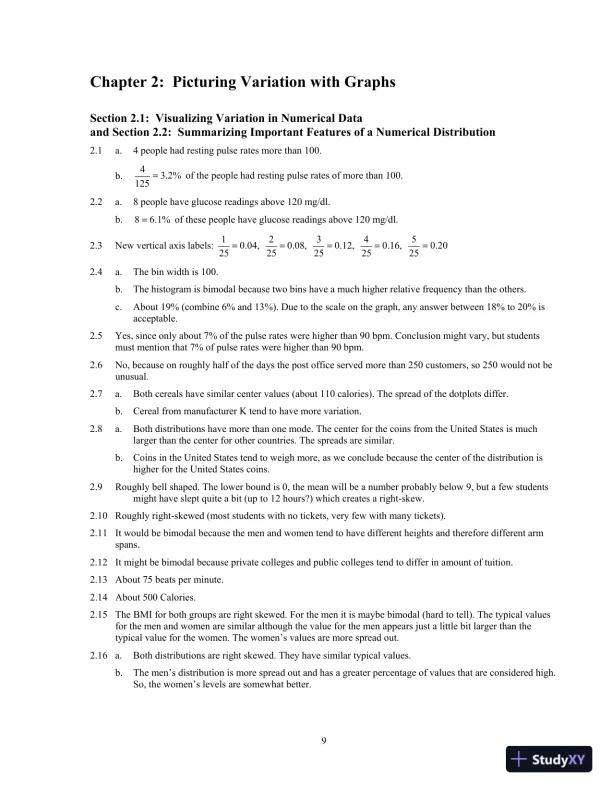
9Chapter 2: Picturing Variation with GraphsSection 2.1: Visualizing Variation in Numerical Dataand Section 2.2: Summarizing Important Features of a Numerical Distribution2.1a.4 people had resting pulse rates more than 100.b.43.2%125of the people had resting pulse rates of more than 100.2.2a.8 people have glucose readings above 120 mg/dl.b.86.1%of these people have glucose readings above 120 mg/dl.2.3New vertical axis labels:10.04,2520.08,2530.12,2540.16,2550.20252.4a.The bin width is 100.b.The histogram is bimodal because two bins have a much higher relative frequency than the others.c.About 19% (combine 6% and 13%). Due to the scale on the graph, any answer between 18% to 20% isacceptable.2.5Yes, since only about 7% of the pulse rates were higher than 90 bpm. Conclusion might vary, but studentsmust mention that 7% of pulse rates were higher than 90 bpm.2.6No, because on roughly half of the days the post office served more than 250 customers, so 250 would not beunusual.2.7a.Both cereals have similar center values (about 110 calories). The spread of the dotplots differ.b.Cereal from manufacturer K tend to have more variation.2.8a.Both distributions have more than one mode. The center for the coins from the United States is muchlarger than the center for other countries. The spreads are similar.b.Coins in the United States tend to weigh more, as we conclude because the center of the distribution ishigher for the United States coins.2.9Roughly bell shaped. The lower bound is 0, the mean will be a number probably below 9, but a few studentsmight have slept quite a bit (up to 12 hours?) which creates a right-skew.2.10Roughly right-skewed (most students with no tickets, very few with many tickets).2.11It would be bimodal because the men and women tend to have different heights and therefore different armspans.2.12It might be bimodal because private colleges and public colleges tend to differ in amount of tuition.2.13About 75 beats per minute.2.14About 500 Calories.2.15The BMI for both groups are right skewed. For the men it is maybe bimodal (hard to tell). The typical valuesfor the men and women are similar although the value for the men appears just a little bit larger than thetypical value for the women. The women’s values are more spread out.2.16a.Both distributions are right skewed. They have similar typical values.b.The men’s distribution is more spread out and has a greater percentage of values that are considered high.So, the women’s levels are somewhat better.

Page 16

Solution Manual for Introductory Statistics: Exploring the World Through Data, 3rd Edition - Page 16 preview image

Loading page image...

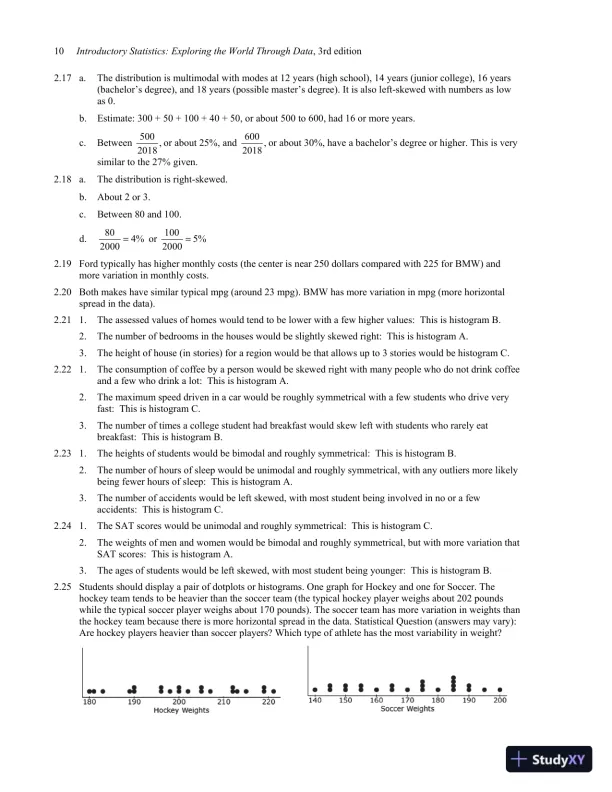
10Introductory Statistics: Exploring the World Through Data, 3rd edition2.17a.The distribution is multimodal with modes at 12 years (high school), 14 years (junior college), 16 years(bachelor’s degree), and 18 years (possible master’s degree). It is also left-skewed with numbers as lowas 0.b.Estimate: 300 + 50 + 100 + 40 + 50, or about 500 to 600, had 16 or more years.c.Between500 ,2018or about 25%, and600 ,2018or about 30%, have a bachelor’s degree or higher. This is verysimilar to the 27% given.2.18a.The distribution is right-skewed.b.About 2 or 3.c.Between 80 and 100.d.804%2000or1005%20002.19Ford typically has higher monthly costs (the center is near 250 dollars compared with 225 for BMW) andmore variation in monthly costs.2.20Both makes have similar typical mpg (around 23 mpg). BMW has more variation in mpg (more horizontalspread in the data).2.211.The assessed values of homes would tend to be lower with a few higher values: This is histogram B.2.The number of bedrooms in the houses would be slightly skewed right: This is histogram A.3.The height of house (in stories) for a region would be that allows up to 3 stories would be histogram C.2.221.The consumption of coffee by a person would be skewed right with many people who do not drink coffeeand a few who drink a lot: This is histogram A.2.The maximum speed driven in a car would be roughly symmetrical with a few students who drive veryfast: This is histogram C.3.The number of times a college student had breakfast would skew left with students who rarely eatbreakfast: This is histogram B.2.231.The heights of students would be bimodal and roughly symmetrical: This is histogram B.2.The number of hours of sleep would be unimodal and roughly symmetrical, with any outliers more likelybeing fewer hours of sleep: This is histogram A.3.The number of accidents would be left skewed, with most student being involved in no or a fewaccidents: This is histogram C.2.241.The SAT scores would be unimodal and roughly symmetrical: This is histogram C.2.The weights of men and women would be bimodal and roughly symmetrical, but with more variation thatSAT scores: This is histogram A.3.The ages of students would be left skewed, with most student being younger: This is histogram B.2.25Students should display a pair of dotplots or histograms. One graph for Hockey and one for Soccer. Thehockey team tends to be heavier than the soccer team (the typical hockey player weighs about 202 poundswhile the typical soccer player weighs about 170 pounds). The soccer team has more variation in weights thanthe hockey team because there is more horizontal spread in the data. Statistical Question (answers may vary):Are hockey players heavier than soccer players? Which type of athlete has the most variability in weight?
Preview Mode

This document has 219 pages. Sign in to access the full document!

Study Now!

XY-Copilot AI
Unlimited Access
Secure Payment
Instant Access
24/7 Support
Document Chat

Document Details

Subject
Statistics

Related Documents

View all