Solution Manual for Labor Economics, 8th Edition

Save time with Solution Manual for Labor Economics, 8th Edition, a quick reference guide to your textbook.

Benjamin Fisher
Contributor
4.1
48
5 months ago
Preview (16 of 133 Pages)
100%
Purchase to unlock

Page 1

Solution Manual for Labor Economics, 8th Edition - Page 1 preview image

Loading page image...

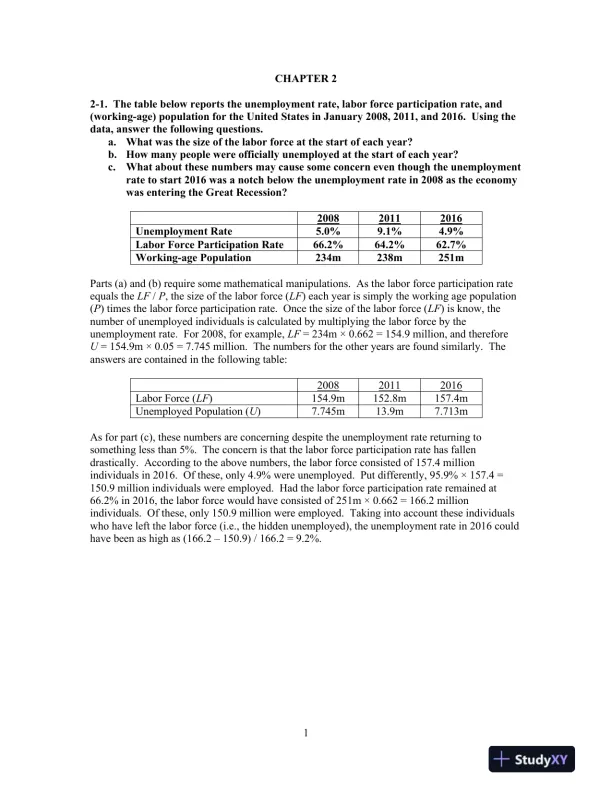
1CHAPTER 22-1.The table below reports the unemployment rate, labor force participation rate, and(working-age) population for the United States in January 2008, 2011, and 2016. Using thedata, answer the following questions.a.What was the size of the labor force at the start of each year?b.How many people were officially unemployed at the start of each year?c.What about these numbers may cause some concern even though the unemploymentrate to start 2016 was a notch below the unemployment rate in 2008 as the economywas entering the Great Recession?200820112016Unemployment Rate5.0%9.1%4.9%Labor Force Participation Rate66.2%64.2%62.7%Working-age Population234m238m251mParts (a) and (b) require some mathematical manipulations. As the labor force participation rateequals theLF/P, the size of the labor force (LF) each year is simply the working age population(P) times the labor force participation rate. Once the size of the labor force (LF) is know, thenumber of unemployed individuals is calculated by multiplying the labor force by theunemployment rate. For 2008, for example,LF= 234m × 0.662 = 154.9 million, and thereforeU= 154.9m × 0.05 = 7.745 million. The numbers for the other years are found similarly. Theanswers are contained in the following table:200820112016Labor Force (LF)154.9m152.8m157.4mUnemployed Population (U)7.745m13.9m7.713mAs for part (c), these numbers are concerning despite the unemployment rate returning tosomething less than 5%. The concern is that the labor force participation rate has fallendrastically. According to the above numbers, the labor force consisted of 157.4 millionindividuals in 2016. Of these, only 4.9% were unemployed. Put differently, 95.9% × 157.4 =150.9 million individuals were employed. Had the labor force participation rate remained at66.2% in 2016, the labor force would have consisted of 251m × 0.662 = 166.2 millionindividuals. Of these, only 150.9 million were employed. Taking into account these individualswho have left the labor force (i.e., the hidden unemployed), the unemployment rate in 2016 couldhave been as high as (166.2150.9) / 166.2 = 9.2%.

Page 2

Solution Manual for Labor Economics, 8th Edition - Page 2 preview image

Loading page image...

Page 3

Solution Manual for Labor Economics, 8th Edition - Page 3 preview image

Loading page image...

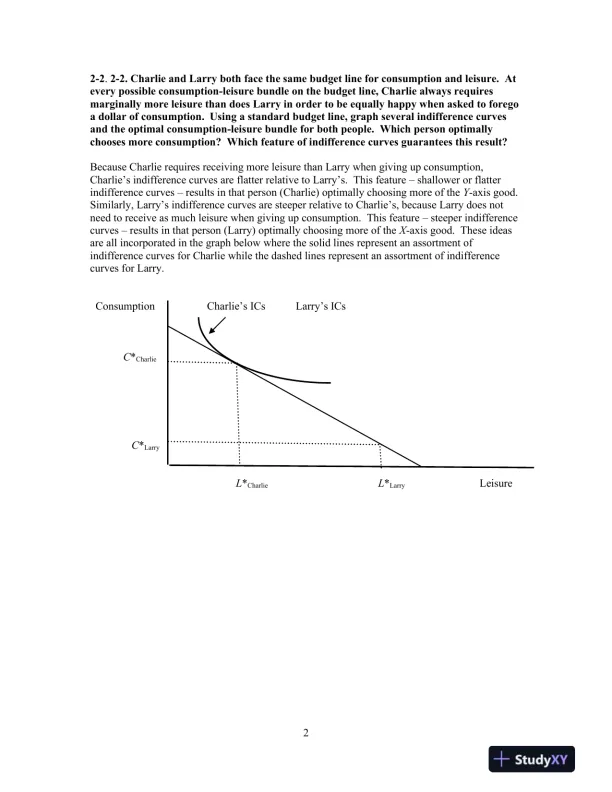
22-2.2-2.Charlie and Larry both face the same budget line for consumption and leisure. Atevery possible consumption-leisure bundle on the budget line, Charlie always requiresmarginally more leisure than does Larry in order to be equally happy when asked to foregoa dollar of consumption. Using a standard budget line, graph several indifference curvesand the optimal consumption-leisure bundle for both people. Which person optimallychooses more consumption? Which feature of indifference curves guarantees this result?Because Charlie requires receiving more leisure than Larry when giving up consumption,Charlie’s indifference curves areflatter relative to Larry’s. This featureshallower or flatterindifference curvesresults in that person (Charlie) optimally choosing more of theY-axis good.Similarly, Larry’s indifference curves are steeper relative to Charlie’s, because Larry does notneed to receive as much leisure when giving up consumption. This featuresteeper indifferencecurvesresults in that person (Larry) optimally choosing more of theX-axis good. These ideasare all incorporated in the graph belowwhere the solid lines represent an assortment ofindifference curves for Charlie while the dashed lines represent an assortment of indifferencecurves for Larry.ConsumptionCharlie’s ICsLarry’s ICsC*CharlieC*LarryL*CharlieL*LarryLeisure

Page 4

Solution Manual for Labor Economics, 8th Edition - Page 4 preview image

Loading page image...

32-3. Tom earns $15 per hour for up to 40 hours of work each weekand$30 per hour forevery hour in excess of 40. Tomalsofaces a 20 percent tax rate,pays $4 per hour in childcare expenses for each hour he works, andreceives $80 in child support payments eachweek. There are 110(non-sleeping)hours in the week. Graph Tom’s weekly budget line.If Tom does not work, he leisures for 110hours and consumes $80.For all hours Tom works up to his first 40, his after-tax and after-child care wage equals(80 percent of $15)$4 = $8 per hour. Thus, if he works for 40 hours, hewill be able toleisure for 70hours and consume $80 + $8(40) = $400.For all hours Tom works over 40, his after-tax and after-child care wage equals (80percent of $30)$4= $20. Thus, if he works for 110 hours (70hours at the overtimewage), he will not leisure at all, but he will consume $80 + $8(40) + $20(70) = $1,800.Tom’s weekly budget line is pictured below.2-4. Cindy gains utility from consumptionCand leisureL. The most leisure she canconsume in any given week is 110hours. Her utility function isU(C,L)= CL. Thisfunctional form implies that Cindy’s marginal rate of substitution isC / L. Cindy receives$660 each week from her great-grandmotherregardless of how much Cindy works. Whatis Cindy’s reservation wage?The reservation wage is theMRSwhen not working at all. Thus,wRES=MRSat maximum leisureequalsC/L= $660/110 = $6.00.Dollars ofConsumption$1,400$400$8070110Hours of Leisure

Page 5

Solution Manual for Labor Economics, 8th Edition - Page 5 preview image

Loading page image...

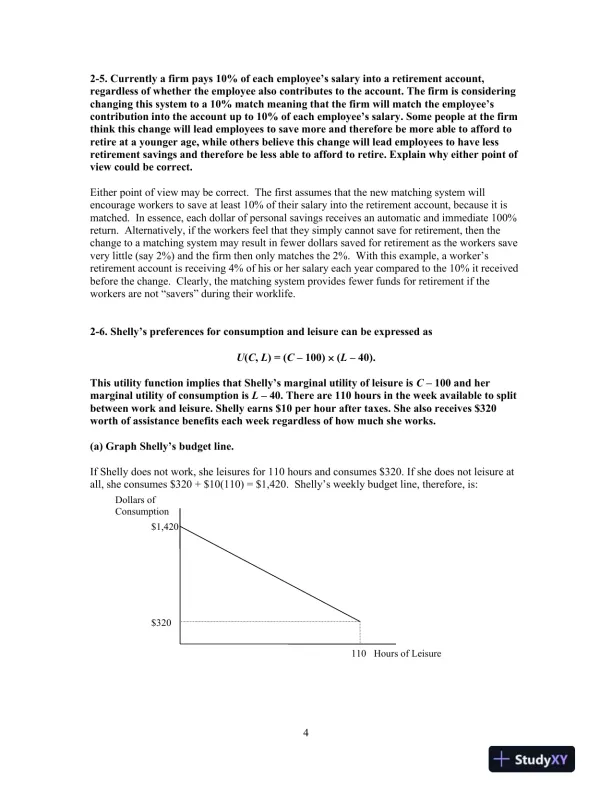
42-5. Currently a firm pays 10% of each employee’s salary into a retirement account,regardless of whether the employee also contributes to the account. The firm is consideringchanging this system to a 10% match meaning that the firm will matchthe employee’scontribution into the accountup to 10% of each employee’s salary.Some people at the firmthinkthis change willleademployees to save more and therefore bemoreable to affordtoretireat a younger age, while others believe thischangewill lead employees to have lessretirement savings and therefore be less able to afford to retire. Explain why either point ofview could be correct.Either point of view may be correct. The first assumes that thenewmatching systemwillencourage workers to save at least 10% of their salary into the retirement account, because it ismatched. In essence, each dollar of personal savings receives an automatic and immediate 100%return. Alternatively, if the workers feel that they simply cannot save for retirement, then thechange to a matchingsystem may result in fewer dollars saved for retirement as the workers savevery little (say 2%) and the firm then only matches the 2%. With this example, a worker’sretirement account is receiving 4% of his or her salary each year compared to the 10% it receivedbefore the change. Clearly, the matchingsystem provides fewer funds for retirement iftheworkersare not “savers” during their worklife.2-6. Shelly’s preferences for consumption and leisure can be expressed asU(C,L) = (C100)(L40).This utility function implies that Shelly’s marginal utility of leisure isC100and hermarginal utility of consumption isL40. There are 110hours in the week available to splitbetween work and leisure. Shelly earns $10per hour after taxes. She also receives $320worth ofassistancebenefits each week regardless of how much she works.(a) Graph Shelly’s budget line.If Shelly does not work, she leisures for 110hours and consumes $320. If she does not leisure atall, she consumes $320 + $10(110) = $1,420.Shelly’s weekly budget line, therefore, is:Dollars ofConsumption$1,420$320110Hours of Leisure

Page 6

Solution Manual for Labor Economics, 8th Edition - Page 6 preview image

Loading page image...

5(b) What is Shelly’s marginal rate of substitution whenL= 100 and she is on her budgetline?If Shelly leisuresfor 100 hours, she works for 10 hours and consumes $320 + $10(10) = $420.Thus, her MRS when doing this is:33.5$603204010010042040100=====LCMUcMUMRSL.(c) What is Shelly’s reservation wage?The reservation wage is defined as the MRS when working no hours. When working no hours,Shelly leisures for 110hours and consumes $320. Thus,14.3$702204011010032040100=====LCMUcMUwLRES.(d) Find Shelly’s optimal amount of consumption and leisure.Her optimal mix of consumption and leisure is found by setting her MRS equal to her wage andsolving for hours of leisure given the budget line:C= 320 + 10(110L)..861013204001040100)110(10320104010010==+===LLLLLLCMRSwThus, Shelly will choose to leisure 86 hours, work 24 hours, and consume $320 + $10(24) = $560each week.

Page 7

Solution Manual for Labor Economics, 8th Edition - Page 7 preview image

Loading page image...

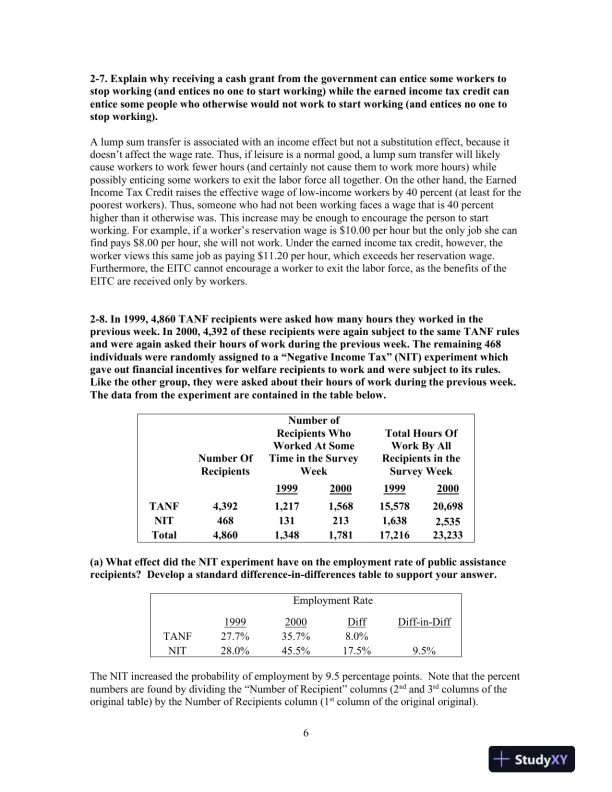
62-7. Explain whyreceiving a cash grant from thegovernment can entice some workers tostop working (and entices no one to start working) while the earned income tax credit canentice some people who otherwise would not work to start working (and entices no one tostop working).A lump sum transfer is associated with an income effect but not a substitution effect, because itdoesn’t affect the wage rate. Thus, if leisure is a normal good, a lump sum transfer will likelycause workers to work fewer hours (and certainly not cause them to work more hours) whilepossibly enticing some workers to exit the labor forceall together. On the other hand, the EarnedIncome Tax Credit raises the effectivewage of low-income workers by 40 percent (at least for thepoorest workers). Thus, someone who had not been working faces a wage that is 40 percenthigher than it otherwise was. This increase may be enough to encourage the person to startworking. For example, if a worker’s reservation wage is $10.00 per hour but the only job she canfind pays $8.00 per hour, she will not work. Under the earned income tax credit, however, theworkerviews this same job as paying $11.20 per hour, which exceeds her reservation wage.Furthermore, the EITC cannot encourage a worker to exit the labor force, as the benefits of theEITC are received only by workers.2-8. In 1999, 4,860 TANF recipients were asked how many hours they worked in theprevious week. In 2000, 4,392 of these recipients were again subject to the same TANF rulesand were again asked their hours of work during the previous week. The remaining 468individuals were randomly assigned to a “Negative Income Tax” (NIT) experiment whichgave out financial incentives for welfare recipients to work and were subject to its rules.Like the other group, they were asked about their hours of work during the previous week.The data from the experiment are contained in the table below.Number OfRecipientsNumber ofRecipients WhoWorked At SomeTime in the SurveyWeekTotal Hours OfWork By AllRecipients in theSurvey Week1999200019992000TANF4,3921,2171,56815,57820,698NIT4681312131,6382,535Total4,8601,3481,78117,21623,233(a) What effect did the NIT experiment have on the employment rate of public assistancerecipients? Develop a standard difference-in-differences table to support your answer.Employment Rate19992000DiffDiff-in-DiffTANF27.7%35.7%8.0%NIT28.0%45.5%17.5%9.5%The NIT increased the probability of employment by 9.5 percentage points.Note that the percentnumbers are found by dividing the “Number of Recipient” columns (2ndand 3rdcolumnsoftheoriginaltable) by the Number of Recipients column (1stcolumnoftheoriginaloriginal).

Page 8

Solution Manual for Labor Economics, 8th Edition - Page 8 preview image

Loading page image...

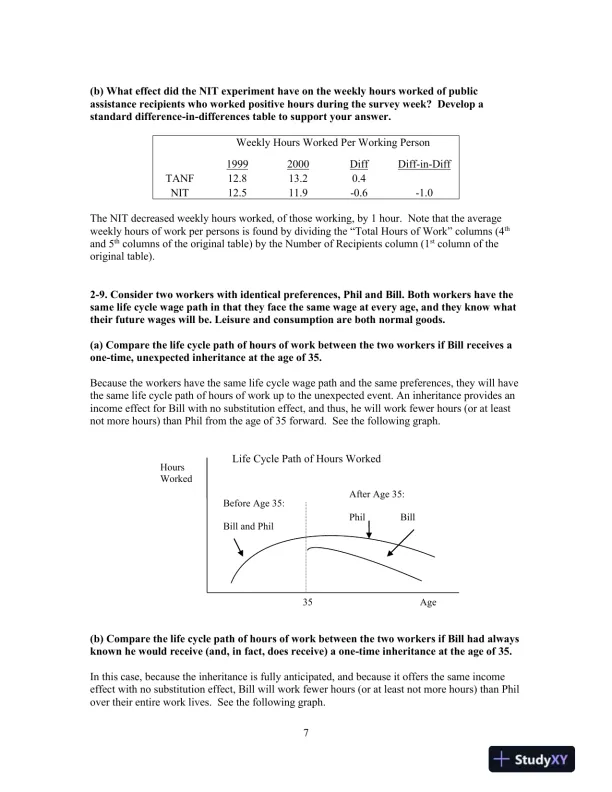
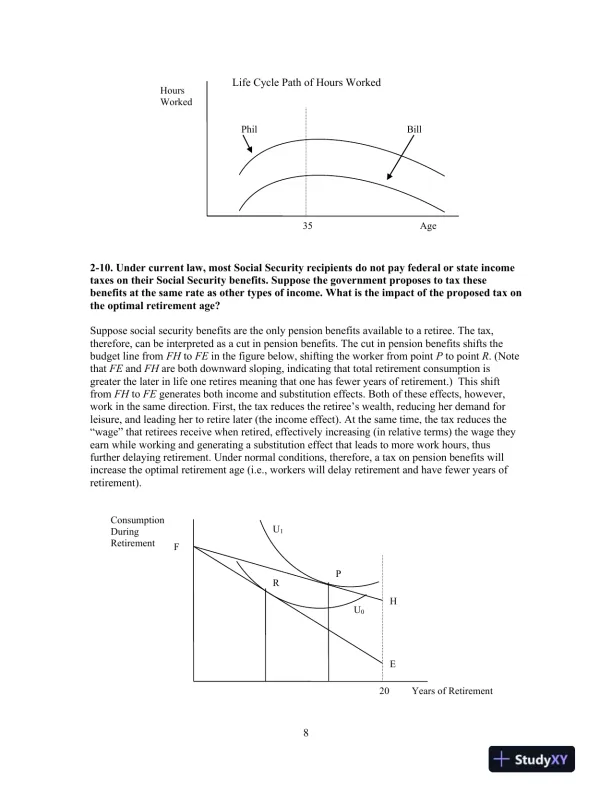
7(b) What effect did the NIT experiment have on the weekly hours worked of publicassistance recipients who worked positive hours during the survey week? Develop astandard difference-in-differences table to support your answer.Weekly Hours Worked Per Working Person19992000DiffDiff-in-DiffTANF12.813.20.4NIT12.511.9-0.6-1.0The NIT decreased weekly hours worked, of those working, by 1 hour.Note that the averageweekly hours of work per persons is found bydividingthe “Total Hours of Work” columns (4thand 5thcolumnsoftheoriginaltable) by the Number of Recipients column (1stcolumnoftheoriginaltable).2-9. Consider two workers with identical preferences, Phil and Bill. Both workers have thesame life cycle wage path in that they face the same wage at every age, and they knowwhattheir future wages will be. Leisure and consumption are both normal goods.(a)Compare the life cycle path of hours of work between the two workers if Bill receives aone-time, unexpectedinheritance at the age of 35.Because the workers have the same life cycle wage path and the same preferences, they will havethe same life cycle path of hours of work up to the unexpected event. An inheritance provides anincome effect for Bill with no substitution effect, and thus, he will work fewer hours (or at leastnot more hours) than Phil from the age of 35 forward.See the following graph.(b)Compare the life cycle path of hours of work between the two workers if Bill had alwaysknown he would receive (and, in fact, does receive) a one-time inheritance at the age of 35.In this case, because the inheritance is fully anticipated, and because it offers the same incomeeffect with no substitution effect, Bill will work fewer hours (or at least not more hours) than Philover their entire work lives.See the following graph.HoursWorked35AgeBefore Age 35:Bill and PhilAfter Age 35:PhilBillLife Cycle Path of Hours Worked

Page 9

Solution Manual for Labor Economics, 8th Edition - Page 9 preview image

Loading page image...

82-10. Under current law, most Social Security recipientsdo not pay federal or state incometaxes on their Social Security benefits. Suppose the government proposes to tax thesebenefits at the same rate as other types of income. What is the impact ofthe proposed tax onthe optimal retirement age?Suppose social security benefits are the only pension benefits available to a retiree. The tax,therefore, can be interpreted as a cut in pension benefits. The cut in pension benefits shifts thebudget line fromFHtoFEin the figure below, shifting the worker from pointPto pointR. (NotethatFEandFHare both downward sloping, indicating that total retirement consumption isgreater the later in life one retiresmeaning that one has fewer years of retirement.) This shiftfromFHtoFEgenerates both income and substitution effects. Both of these effects, however,work in the same direction. First, the tax reduces the retiree’s wealth, reducing her demand forleisure, and leading her to retire later(the income effect). At the same time, the tax reduces the“wage” that retirees receive when retired, effectively increasing (in relative terms) the wage theyearn while working and generating a substitution effect that leads to more work hours, thusfurther delaying retirement.Under normal conditions, therefore, atax on pension benefitswillincreasethe optimal retirement age (i.e., workers will delay retirementand have fewer years ofretirement).HoursWorked35AgePhilBillLife Cycle Path of Hours WorkedConsumptionDuringRetirementU1PRHEFU020Years of Retirement

Page 10

Solution Manual for Labor Economics, 8th Edition - Page 10 preview image

Loading page image...

92-11. Aworker plans to retire at the age of 65, at which time he will start collecting hisretirement benefits. Then there is a sudden change in the forecast of inflation when theworker is 63 years old. In particular, inflation is now predicted to be higher than it hadbeen expected so that the average price level of market goods and wages is now expected tobe higher. What effect does this announcement have on the person’s preferred retirementage:(a) if retirement benefits are fully adjusted for inflation?There will be no effect on the person’s retirement decision if retirement benefits are fully adjustedfor inflation as nothing changes in the person’s calculations in real terms: the relative magnitudesof prices, wages and retirement benefits are the same with or without inflation. The person facesthe same choiceset, so his decision does not change.(b) if retirement benefits are not fully adjusted for inflation?If retirement benefits are not adjusted for inflation, the purchasing power of retirement benefitsfalls. If the person does not retire, he can enjoy the same consumption as he would withoutinflation as wages are assumed to fully adjust for inflation. If he retires at 65, his benefits areworth less in real terms (they can buy him less consumption) with inflation than without, so hecannot afford the same consumption path as before. Hence, his choice set over the years ofretirement and consumption lies below the original (pre-inflation) choice set except at onepointwhere he does not retire at all. Thus, as long as leisure (i.e., years of retirement) andconsumption are normal goods, the income and substitution effects both lead to the individualretiring later in life.2-12. Presently, there is a minimum and maximum social security benefit paid to retirees.Between these two bounds, a retiree’s benefit level depends on how much she contributed tothe system over her work life. Suppose Social Security was changed so that everyone aged65 or older was paid $12,000 per year regardless of how much she earned over her workinglife or whether she continued to work after the age of 65. How would this likely affectthenumber ofhours workedbyretirees?Labor force participation is likely greatest for those retirees whose social security income is low(below $12,000 per year). Thus, the change in benefits offers these retirees a pure (positive)income effect. These retirees should reduce their hours worked if not leave the labor force alltogether after the age of 65.In contrast, the policy change offers all retirees who would have earned more than $12,000 permonth a pure (negative) income effect. These retirees will become more likely to work, or, ifalready working, more likely to work more hours after the age of 65.

Page 11

Solution Manual for Labor Economics, 8th Edition - Page 11 preview image

Loading page image...

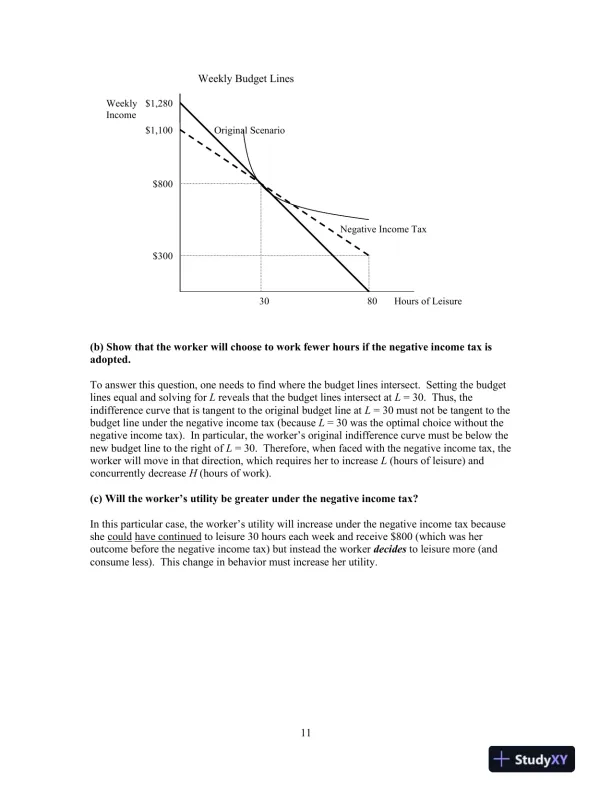
102-13. Over the last 100 years, real household income and standards of living have increasedsubstantially in the United States. At the same time, the total fertility rate, the averagenumber of children born to a woman during her lifetime, has fallen in the United Statesfrom about three children per woman in the early twentieth century to about two childrenper woman in the early twenty-first century. Does this suggest that children are inferiorgoods?The conventional wisdom (and empirical evidence) suggests that children are normal goods.Economically, children are a lot more expensive today than they were 100 years ago (considereducation, housing, clothing, entertainment expenses, etc.). Children also produce less for thehouseholdin the 21stcenturythan they did 100 years ago.There is also abiology/evolution argument is that infant mortality rates have fallen dramaticallyover the last 100 years, so a woman needs to have fewer children to be more confident that someof her children will reach adulthood.This argues against children being an inferior good as the“good” in question can be thought of as the number of offspring who live long enough toprocreate.2-14. Consider a person who can work up to 80 hours each week at a pre-tax wage of $20per hour but faces a constant 20% payroll tax. Under these conditions, the workermaximizes her utility by choosing to work 50 hours each week. The government proposes anegative income tax whereby everyone is given $300 each week and anyone can supplementher income further by working. To pay for the negative income tax, the payroll tax rate willbe increased to 50%.(a)On a single graph, draw the worker’s original budget line and her budget line under thenegative income tax.Under the original scenario, letIbe total weekly income,Lbe hours of leisure, andHbe hoursworked. The worker’s after-tax wage rate is 80% of $20 which equals $16 per hour. Thus, whenthe worker works all 80 hours inthe week, she earns $16 x 80 = $1,280 and her budget line isdescribed byI= 128016L. Notice that whenL= 80, the worker earns $0. And whenL= 30,the worker earns $16 ×50 = $800.Under the negative income tax, the worker is given $300 each week, but now her after-tax wagerate is 50% of $20 which equals $10 per hour. In this case, when the worker works all 80 hoursin the week, she earns $10 ×80 + $300 = $1,100 and her budget line is properly described byI= 110010L. Notice that whenL= 80, the workerreceives$300.And whenL= 30, the workerreceives $300 + $10 x 50 = $800.The two budget lines for both scenarios are graphed on the next page.

Page 12

Solution Manual for Labor Economics, 8th Edition - Page 12 preview image

Loading page image...

11Weekly Budget Lines(b)Show that the worker will choose to work fewer hours if the negative income tax isadopted.To answer this question, one needs to find where the budget lines intersect. Setting the budgetlines equal and solving forLreveals that the budget lines intersect atL= 30. Thus, theindifference curve that is tangent to the original budget line atL= 30 must not be tangent to thebudget line under the negative income tax(becauseL= 30 was the optimal choice without thenegative income tax).In particular, the worker’s original indifference curve must be below thenew budget line to the right ofL= 30. Therefore, when faced with the negative income tax, theworker will move in that direction, which requires her to increaseL(hours of leisure) andconcurrently decreaseH(hours of work).(c)Will the worker’s utility be greater under the negative income tax?In this particular case, the worker’s utility will increase under the negative income tax becauseshecouldhavecontinuedto leisure 30 hours each week and receive $800 (which was heroutcome before the negative income tax) but instead the workerdecidesto leisure more (andconsume less). This change in behavior must increase her utility.WeeklyIncome$1,280Original Scenario80Hours of Leisure$1,100$300Negative Income Tax30$800

Page 13

Solution Manual for Labor Economics, 8th Edition - Page 13 preview image

Loading page image...

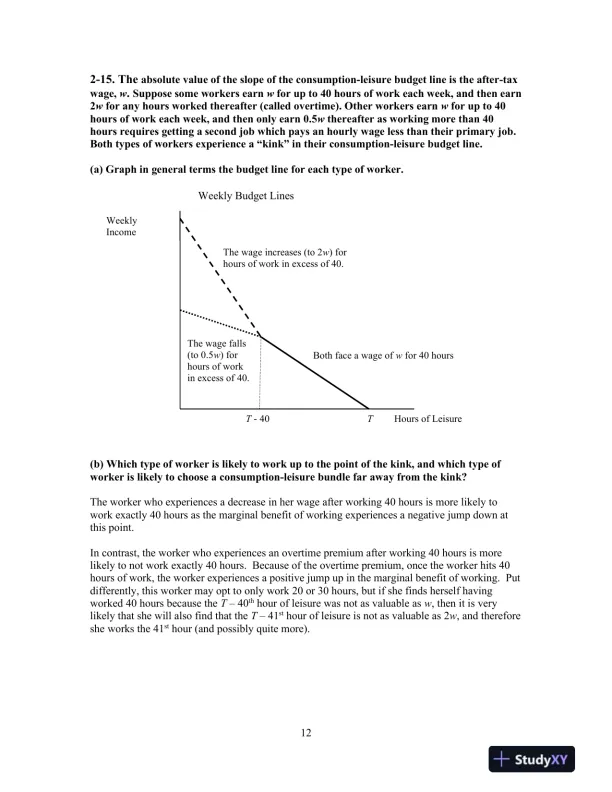
122-15. Theabsolute value of the slope of the consumption-leisure budget line is the after-taxwage,w.Suppose some workers earnwfor up to 40 hours of work each week, and then earn2wfor any hours worked thereafter (called overtime). Other workers earnwfor up to 40hours of work each week, and then only earn 0.5wthereafter as working more than 40hours requires getting a second job which pays an hourly wage less than their primary job.Both types of workers experience a “kink” in their consumption-leisure budget line.(a) Graph in general terms the budget line for each type of worker.Weekly Budget Lines(b) Which type of worker is likely to work up to the point of the kink, and which type ofworker is likely to choose a consumption-leisure bundle far away from the kink?The worker who experiences a decrease in her wage after working 40 hours is more likely towork exactly 40 hours as the marginal benefit of working experiences a negative jump down atthis point.In contrast, the worker who experiences an overtime premium after working 40 hours is morelikely to not work exactly 40 hours. Because of the overtime premium, once the worker hits 40hours of work, the worker experiences a positive jump up in the marginal benefit of working. Putdifferently, this worker may opt to only work 20 or 30 hours,but if she finds herself havingworked 40 hours because theT40thhour of leisure was not as valuable asw, then it is verylikely that she will also find that theT41sthour of leisure is not as valuable as 2w, and thereforeshe works the 41sthour (and possibly quite more).WeeklyIncomeThe wage increases (to 2w) forhours of work in excess of 40.THours of LeisureBoth face a wage ofwfor 40 hoursT-40The wage falls(to 0.5w) forhours of workin excess of 40.

Page 14

Solution Manual for Labor Economics, 8th Edition - Page 14 preview image

Loading page image...

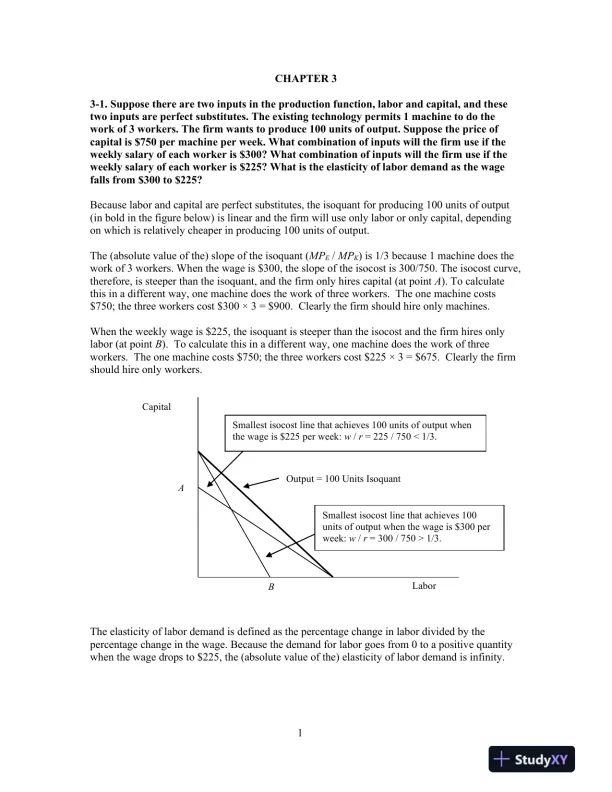
1CHAPTER 33-1. Suppose there are two inputs in the production function, labor and capital, and thesetwo inputs are perfect substitutes. The existing technology permits 1 machine to do thework of 3 workers. The firm wants to produce 100 units of output. Suppose the price ofcapital is $750 per machine per week. What combination of inputs will the firm use if theweekly salary of each worker is $300? What combination of inputs will the firm use if theweekly salary of each worker is $225? What is the elasticity of labor demand as the wagefalls from $300 to $225?Because labor and capital are perfect substitutes, the isoquantfor producing 100 unitsof output(in boldin the figure below)islinear and the firm will use only labor or only capital, dependingon which isrelativelycheaper in producing 100 units of output.The (absolute value of the) slope of the isoquant (MPE/MPK) is 1/3 because 1 machine does thework of 3 workers. When the wage is $300, the slope of the isocost is 300/750. The isocost curve,therefore, is steeper than the isoquant, and the firm only hires capital (at pointA).To calculatethis in a different way, one machine does the work of three workers. The one machine costs$750; the three workers cost $300 × 3 = $900. Clearly the firm should hire only machines.When the weekly wage is $225, the isoquant is steeper than the isocost and the firm hires onlylabor (at pointB).To calculate this in a different way, one machine does the work of threeworkers. The one machine costs $750; the three workers cost $225 × 3 = $675. Clearly the firmshould hire only workers.The elasticity of labor demand is defined as the percentage change in labor divided by thepercentage change in the wage. Because the demand for labor goes from 0 to a positive quantitywhen the wage dropsto $225, the (absolute value of the) elasticity of labor demand is infinity.LaborCapitalOutput = 100 Units IsoquantSmallestisocostline that achieves 100 units of output whenthe wage is $225 per week:w/r= 225 / 750<1/3.Smallest isocost line that achieves 100units of output when the wage is $300 perweek:w/r= 300 / 750 > 1/3.BA

Page 15

Solution Manual for Labor Economics, 8th Edition - Page 15 preview image

Loading page image...

23-2. Figure 3-18 in the text shows the ratio of the federal minimum wage to the averagehourly manufacturing wage.(a) Describe how this ratio has changed from the 1950s to the 1990s. What might havecaused this apparent shift in fundamental economic behavior in the United States?The ratio of the federal minimum wage to the average hourly manufacturing wage averaged about0.5from1950 to 1968. That is, a manufacturing job paid about2times as much as a minimumwage job. Since 1968, however, the ratio has steadily fallen. In the last quarter of the 20thcentury, the ratio approached 0.3, meaning that a manufacturing job paid about 3 times as muchas a minimum wage job.Consider three (of the many possible) explanationsfor this behavior. First, although the nominalminimum wage has risen over time, the real minimum wage fell quit a bit from 1968 to 1990.Second, the U.S. economy has lost a lot of manufacturing jobs recently, ostensibly due toglobalization. Economic theory suggests that the jobs most likely to be lost are those with theleast productive workers (relative to foreign workers), which likely correlates to the lowest paidmanufacturing jobs. Thus, when the lowest paid manufacturing jobs are lost, the averagemanufacturing wage will increase, which in turn increases the ratio presented in Figure 3-18.Third, one might point toward the return to skills. Most low-wage, minimum wage jobs requirevery little skill (and some of these jobs are becoming more and more automated). Manufacturingjobs, however, still require skillin terms of using high-tech equipment and machines.(b) This ratio fell steadily from 1968 to 1974 and again from 1980 to 1990, but theunderlying dynamics of the minimum wage and the average manufacturing wage weredifferent during the two time periods. Explain.First, notice that over both of these periods that the federal minimum wagewas unchanged.The earlier period (1968-1974) was a time of stagflation, war, and an oil price shock. High levelsof inflation led to highernominalwages (for those who had jobs), thus lowering the ratio of theminimum wage to the average manufacturing wage. That is, the decreasing ratio was largely aproduct of an eroding real minimum wage during an inflationary period.The later period (1980-1990) is generally characterized as a time of economic growth andprosperity. Thus, while inflation was largely in check, wages were increasing substantially as aresult of productivity growth. This productivity growth (and in turn wage growth) resulted inalower ratio.(c) What has been happening to the ratio of the federal minimum wage (nominal) to theaverage hourly manufacturing wage from 1990 to today?More or less, it has been holding steady between 0.3 and 0.4, depending on the timing oflegislative increases in the minimum wage.

Page 16

Solution Manual for Labor Economics, 8th Edition - Page 16 preview image

Loading page image...

33-3.Firmwould hire 20,000 workers if the wage rate is $12but willhire 10,000 workers ifthe wage rate is $15.FirmBwillhire 30,000 workers if the wage is $20but willhire 33,000workers if the wage is $15.The workers in which firm aremorelikely to organizeand forma union?The union will be more likely to attract the workers’ support when the elasticity of labor demand(in absolute value) is small. The elasticity of labor demand facingfirmA is given by:212)1512(000,20)000,10000,20(%%===wEA.The elasticity of labor demand facingfirmB is given by:45.015)2015(000,33)000,30000,33(%%==wEBWorkers at FirmB, therefore,aremore likely to organize as|-0.45|<|-2|.3-4. Consider a firm for which production depends on two normal inputs, labor and capital,with priceswandr,respectively. Initially the firm faces market prices ofw= 6 andr= 4.These prices then shift tow= 4 andr= 2.(a) In which direction will the substitution effect change the firm’s employment and capitalstock?Prior to the price shift, the absolute value of the slope of the isocost line (w/r) was 1.5. After theprice shift, the slope is 2. In other words, labor has become relatively more expensive thancapital. As a result, there will be a substitution away from labor and towards capital (thesubstitution effect).(b) In which direction will the scale effect change the firm’s employment and capital stock?Because both prices fall, the marginal cost of production falls, and the firm will want to expand.The scale effect, therefore, increases the demand for both labor and capital as both are normalinputs.(c) Can we say conclusively whether the firm will use more or less labor? More or lesscapital?The firm will certainly use more capital as the substitution and scale effects reinforce each otherin the direction of using more capital. The change in labor hired, however, will depend onwhether the substitution or the scale effectdominatesfor labor.
Preview Mode

This document has 133 pages. Sign in to access the full document!

Study Now!

XY-Copilot AI
Unlimited Access
Secure Payment
Instant Access
24/7 Support
Document Chat

Document Details

Subject
Economics

Related Documents

View all