Solution Manual for Macroeconomics: Principles and Policy, 14th Edition

Solution Manual for Macroeconomics: Principles and Policy, 14th Edition gives you the clarity you need to excel in your studies.

Charlotte Kelly
Contributor
4.7
58
5 months ago
Preview (16 of 113 Pages)
100%
Purchase to unlock

Page 1

Solution Manual for Macroeconomics: Principles and Policy, 14th Edition - Page 1 preview image

Loading page image...

Part II/SolutionsPARTIISOLUTIONS

Page 2

Solution Manual for Macroeconomics: Principles and Policy, 14th Edition - Page 2 preview image

Loading page image...

Page 3

Solution Manual for Macroeconomics: Principles and Policy, 14th Edition - Page 3 preview image

Loading page image...

Chapter 1/What is Economics?CHAPTER1WHATISECONOMICS?DISCUSSIONQUESTIONS1.Think about a way you would construct a model of how your college is governed. Whichofficers and administrators would you include and exclude from your model if theobjective were one of the following:a.To explain how decisions on financial aid are madeb.To explain the quality of the facultyRelate this to the map example in the chapter.This question is designed to make students construct their own version of the mapexample. A good answer is one in which (i) the people who are principally involved inthe decision are identified, (ii) the flow of information and persuasion between thosepeople is outlined and (iii) extraneous detail is eliminated. The “model” is likely to bequite different for part (a) and part (b). Thus decisions on financial aid may depend uponthe trustees, who set overall policy and attempt to raise funds; the president, whoallocates the college budget; the admissions office, which determines what portion ofeach class is financially needy; and the counselors in the financial aid office, who makedecisions about individual cases. Information about policy flows from the top of thebureaucratic hierarchy, and information about need from the bottom. In part (b), facultyquality may be determined by the trustees, who may be responsible for setting salarylevels; the president or dean, who must agree to each faculty appointment and promotion;and the faculty committees in each department and division, that search for potentialappointees. Instructors who assign this question may be amazed at the image of theirinstitution’s structure held by the students.2. Relate the process of abstraction to the way you take notes in a lecture. Why do you nottry to transcribe every word uttered by the lecturer? Why don’t you write down just thetitle of the lecture and stop there? How do you decide, roughly speaking, on the correctamount of detail?Most students are familiar with the need to abstract from detail, and take notes only aboutthe essential points. The student will want enough detail to be able to reconstruct theinstructor’s argument, but not so much detail as to obscure the main point. It is unlikelythat simply writing down the title of the lecture will enable the student to recall the mainarguments at a later date. The choices of how much detail, and what particular detail, aresimilar to the choices an economist makes in thinking about a problem, that is to say, inconstructing a model. [This is a good opportunity to discuss note-taking with thestudents. While most understand the basic idea, few are skilled at it. Take a look at a fewstudents’ lecture notes, and ask whether you would be comfortable learning economicsfrom those notes.]

Page 4

Solution Manual for Macroeconomics: Principles and Policy, 14th Edition - Page 4 preview image

Loading page image...

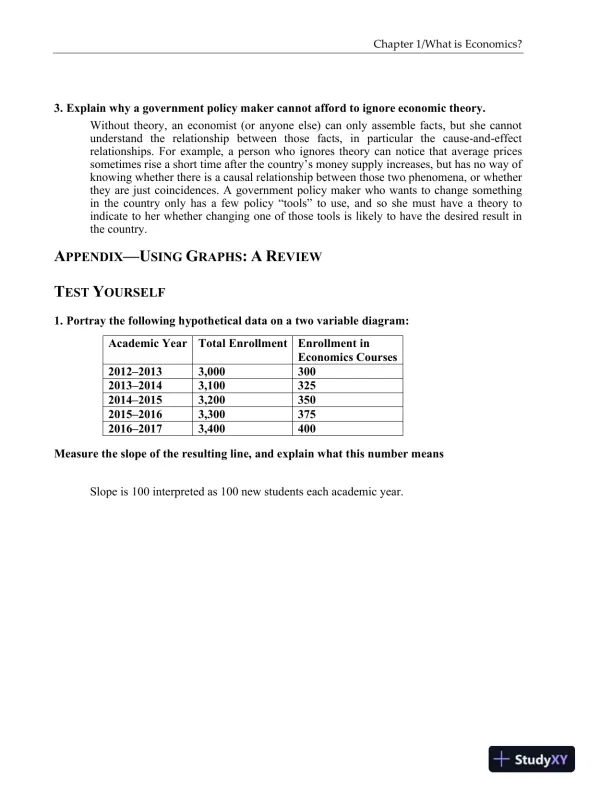
Chapter 1/What is Economics?3. Explain why a government policy maker cannot afford to ignore economic theory.Without theory, an economist (or anyone else) can only assemble facts, but she cannotunderstandtherelationshipbetweenthosefacts,inparticularthecause-and-effectrelationships.For example, a person who ignores theory can notice that average pricessometimes rise a short time after the country’s money supply increases, but has no way ofknowing whether there is a causal relationship between those two phenomena, or whetherthey are just coincidences. A government policy maker who wants to change somethingin the country only has a few policy “tools” to use, and so she must have a theory toindicate to her whether changing one of those tools is likely to have the desired result inthe country.APPENDIXUSINGGRAPHS:AREVIEWTESTYOURSELF1. Portray the following hypothetical data on a two variable diagram:Measure the slope of the resulting line, and explain what this number meansSlope is 100 interpreted as 100 new students each academic year.Academic YearTotal EnrollmentEnrollment inEconomics Courses201220133,000300201320143,100325201420153,200350201520163,300375201620173,400400

Page 5

Solution Manual for Macroeconomics: Principles and Policy, 14th Edition - Page 5 preview image

Loading page image...

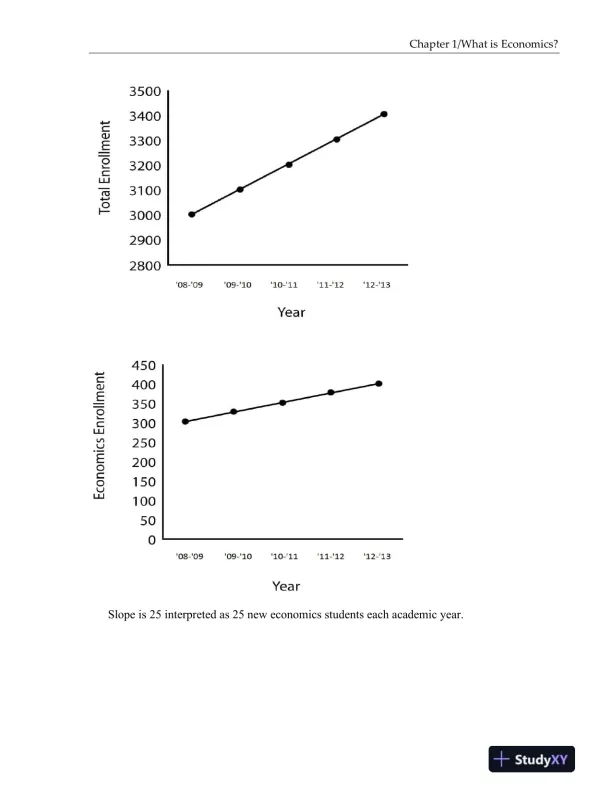
Chapter 1/What is Economics?Slope is 25 interpreted as 25 new economics students each academic year.

Page 6

Solution Manual for Macroeconomics: Principles and Policy, 14th Edition - Page 6 preview image

Loading page image...

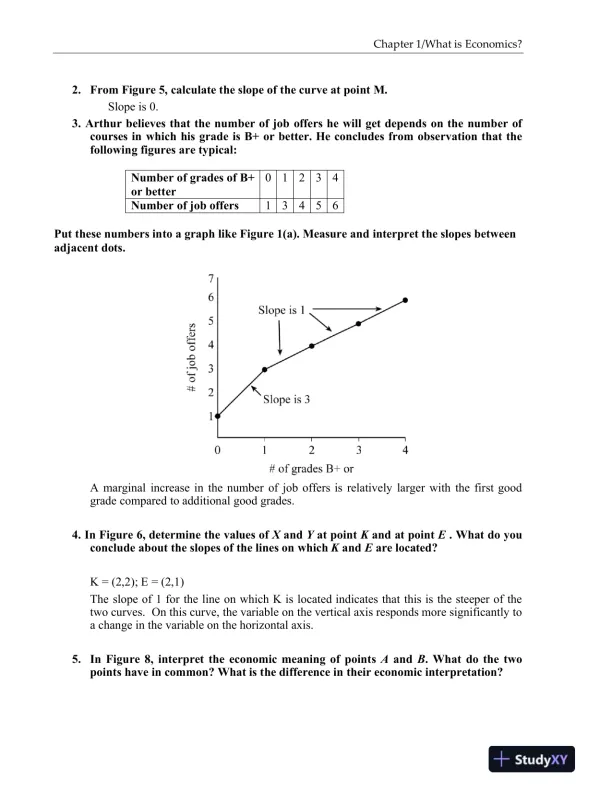
Chapter 1/What is Economics?2.From Figure 5, calculate the slope of the curve at point M.Slope is 0.3. Arthurbelieves that the number of job offers he will get depends on the number ofcourses in which his grade is B+ or better. He concludes from observation that thefollowing figures are typical:Number of grades of B+or better01234Number of job offers13456Put these numbers into a graph like Figure 1(a). Measure and interpret the slopes betweenadjacent dots.A marginal increase in the number of job offers is relatively larger with the first goodgrade compared to additional good grades.4. In Figure 6, determine the values ofXandYat pointKand at pointE. What do youconclude about the slopes of the lines on whichKandEare located?K = (2,2); E = (2,1)The slope of 1 for the line on which K is located indicates that this is the steeper of thetwo curves.On this curve, the variable on the vertical axis responds more significantly toa change in the variable on the horizontal axis.5.InFigure 8, interpret the economic meaning of pointsAandB. What do the twopoints have in common? What is the difference in their economic interpretation?

Page 7

Solution Manual for Macroeconomics: Principles and Policy, 14th Edition - Page 7 preview image

Loading page image...

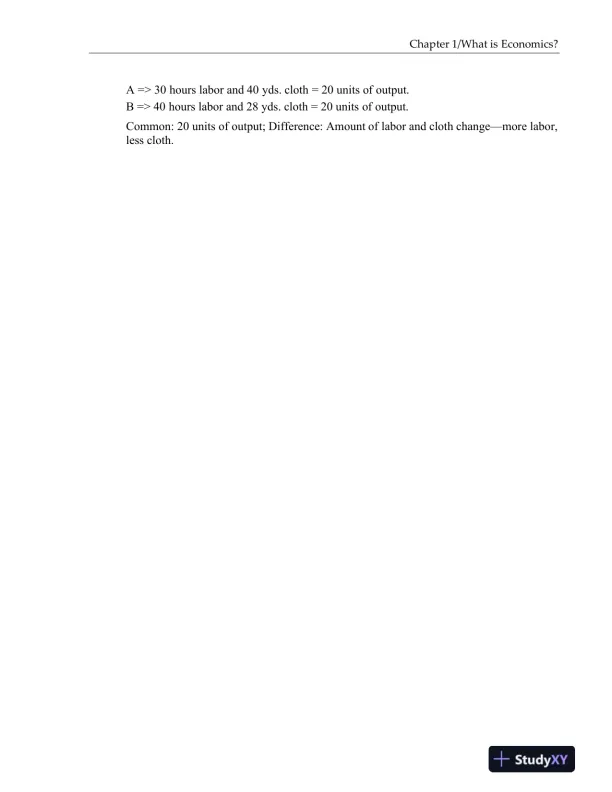
Chapter 1/What is Economics?A => 30 hours labor and 40 yds. cloth = 20 units of output.B => 40 hours labor and 28 yds. cloth = 20 units of output.Common: 20 units of output; Difference: Amount of labor and cloth changemore labor,less cloth.

Page 8

Solution Manual for Macroeconomics: Principles and Policy, 14th Edition - Page 8 preview image

Loading page image...

Chapter 2/The Economy: Myth and RealityCHAPTER2THEECONOMY:MYTH ANDREALITYDISCUSSIONQUESTIONS1.Which is the biggest national economy on earth? Why has it remained bigger thanother countries with much larger labor forces or those with higher per capitaincomes?The United States is the country with the largest economy in the world.The relativelylargepopulationin the U.S.is acontributing factor but productivity of workers andaccumulated wealth are significant reasons why the U.S. economy is so large.2.What is meant by a “factor of production”? Have you ever sold any on a market?A factor of production, or input, is something that is used to produce a finished goodknown as “output.” There are several possible answers, but probably most students havebeen employed in some capacity (babysitter, paperboy, or a campus job), so they havesold their labor in the market to produce output.3.Why do you think per capita income inMarylandis nearly double that inMississippi?There are several possible answers to this questionthe question is designed to getstudents to think about these differences before using models.One straightforwardanswer is that the factors of production inMarylandproduce output that is worth morethan what is produced inMississippi.This could be because labor is more productive inMarylandbecause of a better educated workforce.Another answer is that the cost ofliving is higher inMarylandthan it is inMississippi.4.Roughly speaking, what fraction of U.S. labor works in factories? In servicebusinesses? In government?Roughly14percent produce goods, 71percent are service workers, and approximately15percent work in federal, state, and local government.5.Most American businesses are small, but most of the output is produced by largebusinesses. That sounds paradoxical. How can it be true?While there are many small businesses in the U.S. economy, the value of what theyproduce is relatively small.For example, a local grocer cannot produce the same amountas alarge national grocery store.It would take several small grocers to match theproduction of a large store.So, while a large retailer like Wal-Mart is considered to beone business, its production exceeds that of a smaller business.6.What is the role of government in a mixed economy?The government is a refereeit enforces laws and establishes order.The government is abusinessregulatoritimposesrestrictionson businessesonsociety’sbehalf.Thegovernment provides security through national defense.The government leviestaxes to

Page 9

Solution Manual for Macroeconomics: Principles and Policy, 14th Edition - Page 9 preview image

Loading page image...

Chapter 2/The Economy: Myth and Realityfinance its spending.Finally, the government redistributes income from high incomehouseholds to lower-income ones.

Page 10

Solution Manual for Macroeconomics: Principles and Policy, 14th Edition - Page 10 preview image

Loading page image...

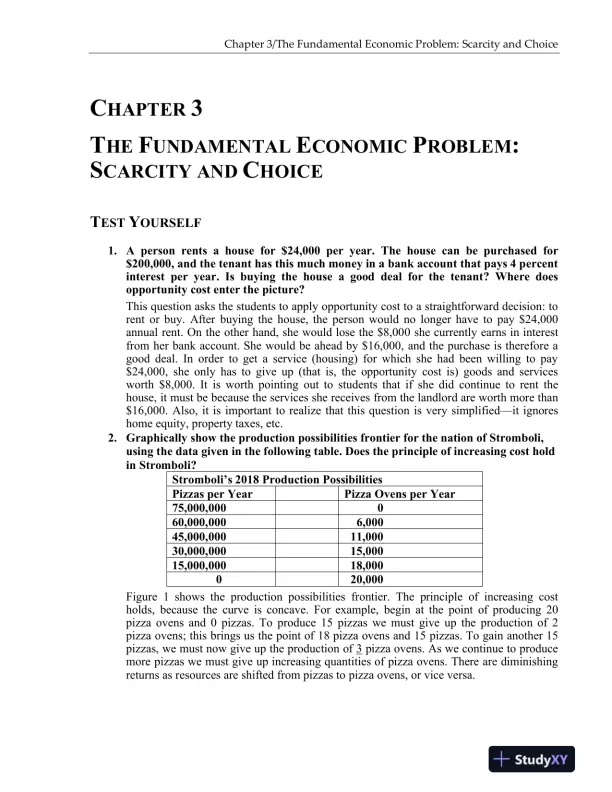
Chapter 3/The Fundamental Economic Problem: Scarcity and ChoiceCHAPTER3THEFUNDAMENTALECONOMICPROBLEM:SCARCITY ANDCHOICETESTYOURSELF1.A person rents a house for $24,000 per year. The house can be purchased for$200,000, and the tenant has this much money in a bank account that pays 4 percentinterest per year. Is buying the house a good deal for the tenant? Where doesopportunity cost enter the picture?This question asks the students to apply opportunity cost to a straightforward decision: torent or buy. After buying the house, the person would no longer have to pay $24,000annual rent. On the other hand, she would lose the $8,000 she currently earns in interestfrom her bank account. She would be ahead by $16,000, and the purchase is therefore agood deal. In order to get a service (housing) for which she had been willing to pay$24,000, she only has to give up (that is, the opportunity cost is) goods and servicesworth $8,000. It is worth pointing out to students that if she did continue to rent thehouse, it must be because the services she receives from the landlord are worth more than$16,000. Also, it is important to realize that this question is very simplifiedit ignoreshome equity, property taxes, etc.2.Graphically show the production possibilities frontier for the nation of Stromboli,using the data given in the following table. Does the principle of increasing cost holdin Stromboli?Stromboli’s 2018 Production PossibilitiesPizzas per YearPizza Ovens per Year75,000,000060,000,0006,00045,000,00011,00030,000,00015,00015,000,00018,000020,000Figure1 shows the production possibilities frontier. The principle of increasing costholds, because the curve is concave. For example, begin at the point of producing 20pizza ovens and 0 pizzas. To produce 15 pizzas we must give up the production of 2pizza ovens; this brings us the point of 18 pizza ovens and 15 pizzas. To gain another 15pizzas, we must now give up the production of3pizza ovens. As we continue to producemore pizzas we must give up increasing quantities of pizza ovens. There are diminishingreturns as resources are shifted from pizzas to pizza ovens, or vice versa.

Page 11

Solution Manual for Macroeconomics: Principles and Policy, 14th Edition - Page 11 preview image

Loading page image...

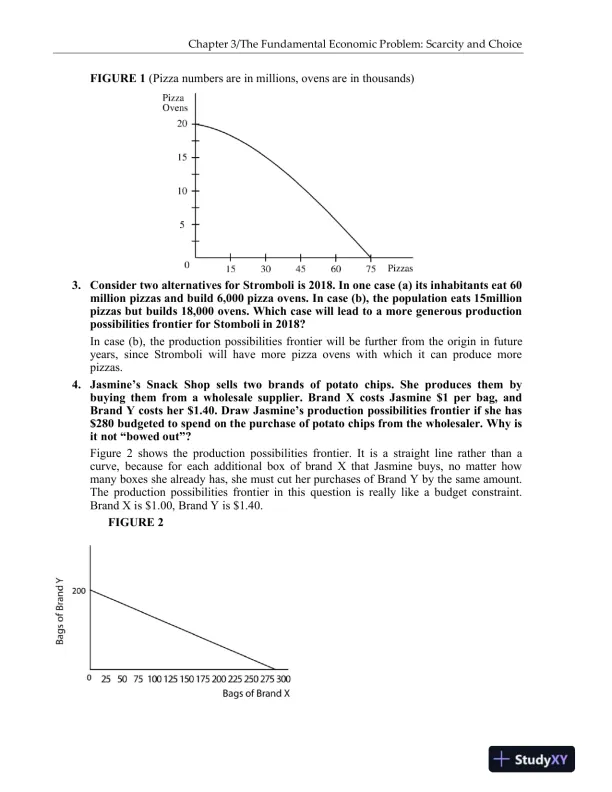
Chapter 3/The Fundamental Economic Problem: Scarcity and ChoiceFIGURE 1(Pizzanumbersare inmillions,ovensare inthousands)3.Consider two alternatives for Stromboli is 2018. In one case (a) its inhabitants eat 60million pizzas and build 6,000 pizza ovens. In case (b), the population eats 15millionpizzas but builds 18,000 ovens. Which case will lead to a more generous productionpossibilities frontier for Stomboli in 2018?In case (b), the production possibilities frontier will befurther from the origin infutureyears, since Stromboli will have more pizza ovens with which it can produce morepizzas.4.Jasmine’s Snack Shop sells two brands of potato chips. She produces them bybuying them from a wholesale supplier. Brand X costs Jasmine $1 per bag, andBrand Y costs her $1.40. Draw Jasmine’s production possibilities frontier if she has$280 budgeted to spend on the purchase of potato chips from the wholesaler. Why isit not “bowed out”?Figure2 shows the production possibilities frontier. It is a straight line rather than acurve, because for each additional box of brand X that Jasmine buys, no matter howmany boxes she already has, she must cut her purchases of Brand Yby the same amount.The production possibilities frontier in this question is really like a budget constraint.Brand X is $1.00, Brand Y is $1.40.FIGURE 2

Page 12

Solution Manual for Macroeconomics: Principles and Policy, 14th Edition - Page 12 preview image

Loading page image...

Chapter 3/The Fundamental Economic Problem: Scarcity and ChoiceDISCUSSIONQUESTIONS1.Discuss the resource limitations that affecta.the poorest person on earthb.the richest person in the United Statesc.a farmer in Kansasd.the government of Indonesia(a)The poorest person on earth has access to so few resources that she is in danger ofperishing. The opportunity cost of any additional good or service is life threatening.For example, if she takes the time to cut and sharpen a stick for hunting, she may notbe able to gather the food she needs to stay alive.(b)Even the richest person in America faces resource limitations. If he buys a shippingcompany, he will lack the resources to buy an oil company. He is constantlyapproached for philanthropic donations; he cannot support them all, and if heincreases his donations, he may lack the funds to expand into new business ventures.(c)A farmer in Kansas (or anywhere) has limited resources with which to produce goods,and therefore hard choices to make. If she produces more wheat, she will have to cutback its production of soybeans.(d)The government of Indonesia has the authority to command the use of a certainamountoflaborandotherproductiveresources.Ifitdecidestoincreasetheproduction of petroleum, it will have to shift some productive resources away fromanother use, thereby causing the output of coffee, for example, to fall.2.If you were president of your college, what would you change if your budget were cutby 10 percent? By 25 percent? By 50 percent?Thisquestion will help students begin todevelop a better understanding of theirinstitution. They may be surprised to learn that about 90 percent of the college’s budgetgoes to wages and benefitsand that therefore a reduction in the budget implies areduction in programs and the laying off of people. An important trade-off to consider isbetween the level of services per student on the one hand and the size of the student bodyon the other.3.If you were to leave college, what things would change in your life? What, then, is theopportunity cost of your education?The answer to this question obviously depends upon the student. Students should beencouraged to think broadly. A student who leaves college would not have to pay tuitionand fees, nor the college room and board expenses (on the other hand, these may be paidcurrently by her parents, so they would not represent a savings to her). She would earnmoney from a job, but she might have to pay for her own living expenses.The point tostress is that the opportunity cost of a college education includes indirect items (such asincome foregone from a job) as well as costs that the student pays directly.4.Raising chickens requires several types of feed, such as corn and soy meal. Consider afarm in the former Soviet Union. Try to describe how decisions on the number ofchickens to be raised, and the amount of each feed to use in raising them, were madeunder the old communist regime. If the farm is now privately owned, how does themarket guide the decisions that used to be made by the central planning agency?Under the former communist regime, the farmer was allocated a certain amount of eachtype of feed, at a fixed cost, and was also given a quota for the number of chickens to beproduced. The farmer did as he was told, and took few if any risks or innovations. Under

Page 13

Solution Manual for Macroeconomics: Principles and Policy, 14th Edition - Page 13 preview image

Loading page image...

Chapter 3/The Fundamental Economic Problem: Scarcity and Choiceprivate enterprise now, the farmer can get richer by producing more chickens. He is freeto buy any combination of feed grains, subject only to the limit of his budget, at the goingmarket prices. Through a process of trial and error, he will select the combination of feedgrains that maximizes his profitand if the price of soy meal rises, he will shift towardcorn. The price of soy meal will in fact rise if soy meal becomes scarcer in the economyas a whole. Thus the market system leads the farmer to economize in his use of a resourcethat is becoming increasingly scarcea task that used to be the responsibility of thecentral planning agency.5.The United States is one of the world’s wealthiest countries. Think of a recent casein which the decisions of the U.S. government were severely constrained by scarcity.Describe the trade-offs that were involved. What were the opportunity costs of thedecisions that were actually made?There are countless good answers to this question. An increase in defense purchases, forexample, may require a reduction in educational expenditures.For some students, it mayalso be important tonote that a larger deficit now may lead to a decrease in expendituresin the future.

Page 14

Solution Manual for Macroeconomics: Principles and Policy, 14th Edition - Page 14 preview image

Loading page image...

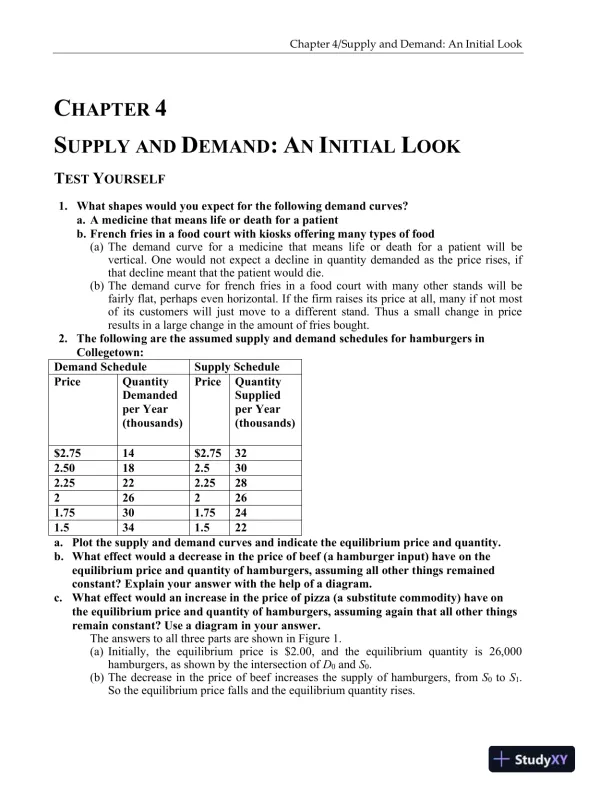
Chapter 4/Supply and Demand: An Initial LookCHAPTER4SUPPLY ANDDEMAND:ANINITIALLOOKTESTYOURSELF1.What shapes would you expect for the following demand curves?a.A medicine that means life or death for a patientb.French fries in a food court with kiosks offering many types of food(a)The demand curve for a medicine that means life or death for a patient will bevertical. One would not expect a decline in quantity demanded as the price rises, ifthat decline meant that the patient would die.(b)The demand curve for french fries in a food court with many other stands will befairly flat, perhaps even horizontal. If the firm raises its price at all, many if not mostof its customers will just move to a different stand. Thus a small change in priceresults in a large change in the amount of fries bought.2.The following are the assumed supply and demand schedules for hamburgers inCollegetown:Demand ScheduleSupply SchedulePriceQuantityDemandedper Year(thousands)PriceQuantitySuppliedper Year(thousands)$2.7514$2.75322.50182.5302.25222.25282262261.75301.75241.5341.522a.Plot the supply and demand curves and indicate the equilibrium price and quantity.b.What effect would a decrease in the price of beef (a hamburger input) have on theequilibrium price and quantity of hamburgers, assuming all other things remainedconstant? Explain your answer with the help of a diagram.c.What effect would an increase in the price of pizza (a substitute commodity) have onthe equilibrium price and quantity of hamburgers, assuming again that all other thingsremain constant? Use a diagram in your answer.The answers to all three parts are shown in Figure 1.(a)Initially, the equilibrium price is $2.00, and the equilibrium quantity is26,000hamburgers, as shown by the intersection ofD0andS0.(b)The decrease in the price of beef increases the supply of hamburgers, fromS0toS1.So the equilibrium price fallsand the equilibrium quantity rises.

Page 15

Solution Manual for Macroeconomics: Principles and Policy, 14th Edition - Page 15 preview image

Loading page image...

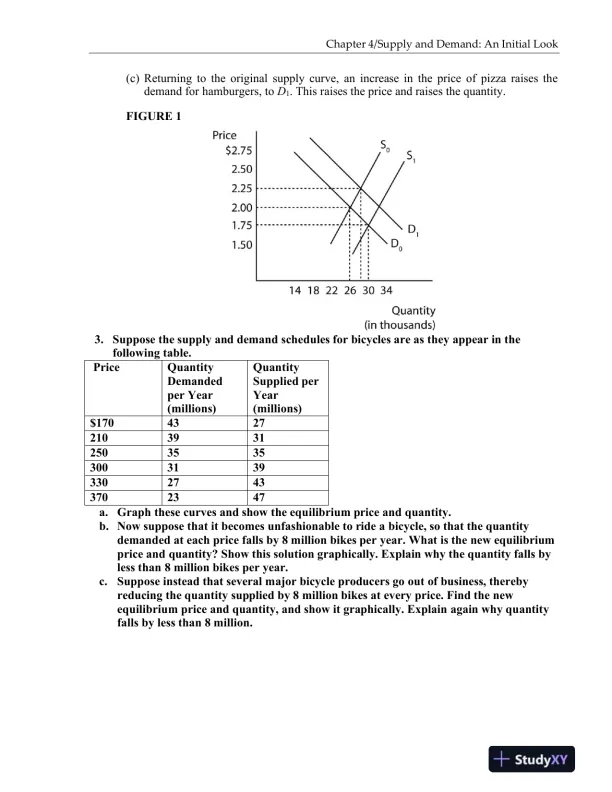
Chapter 4/Supply and Demand: An Initial Look(c)Returning to the original supply curve, an increase in the price of pizza raises thedemand for hamburgers, toD1. This raises the priceand raises the quantity.FIGURE 13.Suppose the supply and demand schedules for bicycles are as they appear in thefollowing table.PriceQuantityDemandedper Year(millions)QuantitySupplied perYear(millions)$170432721039312503535300313933027433702347a.Graph these curves and show the equilibrium price and quantity.b.Now suppose that it becomes unfashionable to ride a bicycle, so that the quantitydemanded at each price falls by 8 million bikes per year. What is the new equilibriumprice and quantity? Show this solution graphically. Explain why the quantity falls byless than 8 million bikes per year.c.Suppose instead that several major bicycle producers go out of business, therebyreducing the quantity supplied by 8 million bikes at every price. Find the newequilibrium price and quantity, and show it graphically. Explain again why quantityfalls by less than 8 million.

Page 16

Solution Manual for Macroeconomics: Principles and Policy, 14th Edition - Page 16 preview image

Loading page image...

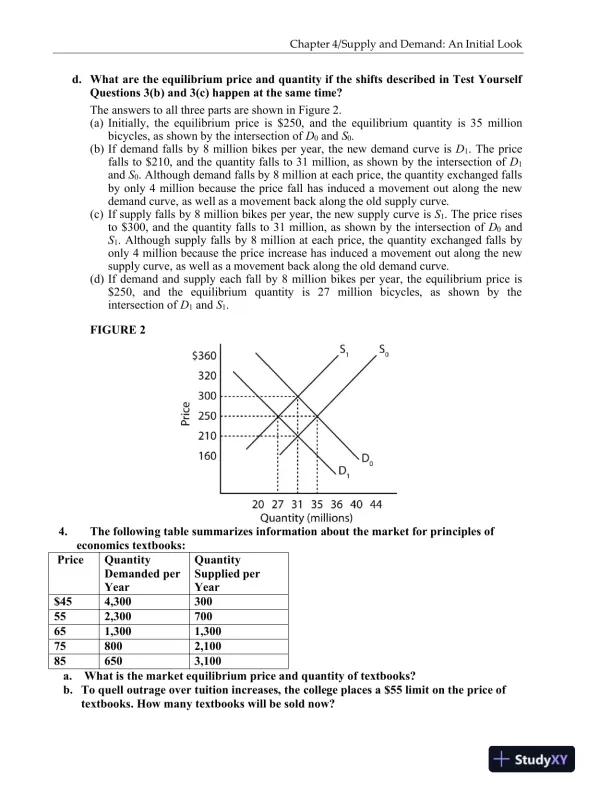
Chapter 4/Supply and Demand: An Initial Lookd.What are the equilibrium price and quantity if the shifts described in Test YourselfQuestions 3(b) and 3(c) happen at the same time?The answers to all three parts are shown in Figure 2.(a)Initially, the equilibrium price is $250, and the equilibrium quantity is 35millionbicycles, as shown by the intersection ofD0andS0.(b)If demand falls by 8 million bikes per year, the new demand curve isD1. The pricefalls to $210, and the quantity falls to 31 million, as shown by the intersection ofD1andS0. Although demand falls by 8 million at each price, the quantity exchanged fallsby only 4 million because the price fall has induced a movement out along the newdemand curve, as well asa movement back along the old supply curve.(c)If supply falls by 8 million bikes per year, the new supply curve isS1. The price risesto $300, and the quantity falls to 31 million, as shown by the intersection ofD0andS1. Although supply falls by 8 million at each price, the quantity exchanged falls byonly 4 million because the price increase has induced a movement out along the newsupply curve, as well asa movement back along the old demand curve.(d)If demand and supply each fall by 8 million bikes per year, the equilibrium price is$250,andtheequilibriumquantityis27millionbicycles,asshownbytheintersection ofD1andS1.FIGURE 24.The following table summarizes information about the market for principles ofeconomics textbooks:PriceQuantityDemanded perYearQuantitySupplied perYear$454,300300552,300700651,3001,300758002,100856503,100a.What is the market equilibrium price and quantity of textbooks?b.To quell outrage over tuition increases, the college places a $55 limit on the price oftextbooks. How many textbooks will be sold now?
Preview Mode

This document has 113 pages. Sign in to access the full document!

Study Now!

XY-Copilot AI
Unlimited Access
Secure Payment
Instant Access
24/7 Support
Document Chat

Document Details

Subject
Economics

Related Documents

View all