Solution Manual for Macroeconomics: Understanding the Global Economy, 3rd Edition

Solution Manual for Macroeconomics: Understanding the Global Economy, 3rd Edition is designed to reinforce textbook concepts through clear explanations.

Benjamin Fisher
Contributor
4.2
55
5 months ago
Preview (16 of 232 Pages)
100%
Purchase to unlock

Page 1

Solution Manual for Macroeconomics: Understanding the Global Economy, 3rd Edition - Page 1 preview image

Loading page image...

C H A P T E R 1W h a t i s M a c r o e c o n o m i c s ?2INTRODUCTIONAs might be expected, this first chapter sets the scene for the whole textbook and attempts tomotivate the study of macroeconomics. Although there is probably only enough material herefor about fifteen minutes of lecture, it obviously needs to be well delivered.Teaching TipsALTERNATIVE ROUTES THROUGH THE CHAPTERThis chapter is likely to form only the first part of a lecture and should probably be combinedwith the material in Chapter 2. The chapter can be tailored to your audience. For example, ifthe students are mainly working in business, give examples of how macroeconomics influencesbusiness decisions. Think about touching on the key macroeconomic issues in the news at thetime e.g. tax policy, the business cycle etc.CHAPTER GUIDE1.1What is Macroeconomics About?It is a good idea to contrast a recent short-termmacroeconomic issue (like the latest change in monetary policy) with the longer-term issueof growth and inequality between regions.The Background Material below gives more information on comparative world growthsince 1500.1.2But What about that Definition?Milton Friedman’s favorite description of the wonders ofthepricemechanism(theinvisiblehand)is“IPencil”byLeonardReed(seewww.econlib.org/library/Essays/rdPncl1.html). However, business students may find it alittle patronizing.1.3The Difference between Macro and Microeconomics.Like most distinctions, this one issomewhatblurredaroundtheedges.Itmaybeworthunderliningthatgoodmacroeconomics tend to have strong microfoundations (i.e. based on microeconomicanalysis and built up to macroeconomic behavior).1.4Why Should People Interested in Business Study Macroeconomics?There are many goodexamples of how macro economic analysis can help solve real world problems. The casestudy below gives a lighter example; how macroeconomics can help to predict the next U.S.president.CHAPTER 1: WHAT IS MACROECONOMICS?

Page 2

Solution Manual for Macroeconomics: Understanding the Global Economy, 3rd Edition - Page 2 preview image

Loading page image...

Page 3

Solution Manual for Macroeconomics: Understanding the Global Economy, 3rd Edition - Page 3 preview image

Loading page image...

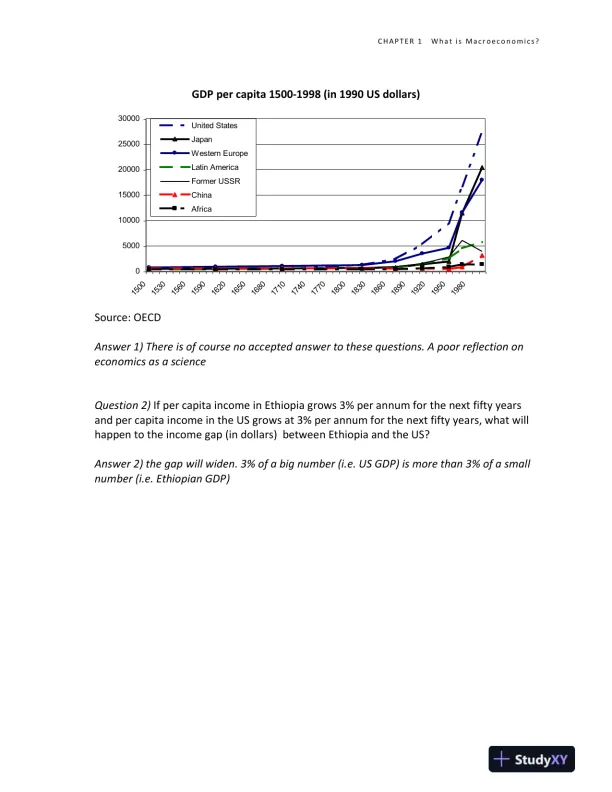
C H A P T E R 1W h a t i s M a c r o e c o n o m i c s ?3CASE STUDY: ECONOMIC EVENTS AND PRESIDENTIAL VOTINGIntroductionNot only is economic policy a key issue in presidential politics, the state of the economy is a keydeterminant of the outcome of the election. To illustrate this point, Professor Ray Fair hasdevised a simple model of presidential voting based on macroeconomic and political variables.The model correctly predicted the outcome of 20 out of 22 elections since 1916 (Nixon-Kennedy 1960 and Bush-Clinton 1992 were its two failures). Its prediction for the 2012election(made inearly 2012) wasfor an Obama victory with a marginallyreducedshare of the voteThe ModelFair’soriginalmodel considers the following questions in respect of each presidential candidateIs your party already in power and has the economy been doing well in the last threequarters?Positive impactIs your party already in power and has the economy grown 3.2% p.a. or more in the last15 quarters?Positive impact.Is your party already in power and has inflation been low over the last 15 quarters?Positive impact.Are you an incumbent?Positive impact.Is America involved in a world war?Forget the economy.It is perhaps troubling that such simple determinants seem to explain so many election results,particularly since short term factors-such as growth over the last 9 months-seem soimportant (see also “It’s the economy stupid” in the Background Material for Chapter 2).Source Fair(1998) “The Effect of Economic Events on Votes for President”http://fairmodel.econ.yale.edu/vote2012/index2.htmDiscussion Questions1)Why is voting so influenced by economics events? Can politicians really improve/worseneconomic outturns over a normal electoral cycle?2)If economics is the key to political success how come so few politicians have aneconomics training?Additional QuestionsQuestion 1)Look at the chart below of per capita GDP (1990 US dollars) for a number ofregions.1)Why did the world economy grow so slowly before the 20thCentury?2)Why was growth concentrated in a few regions? Africa and the US had the same outputper capita in 1500.3)Is increasing inequality between countries inevitable?

Page 4

Solution Manual for Macroeconomics: Understanding the Global Economy, 3rd Edition - Page 4 preview image

Loading page image...

C H A P T E R 1W h a t i s M a c r o e c o n o m i c s ?4GDP per capita 1500-1998 (in 1990 US dollars)05000100001500020000250003000015001530156015901620165016801710174017701800183018601890192019501980United StatesJapanWestern EuropeLatin AmericaFormer USSRChinaAfricaSource: OECDAnswer 1) There is of course no accepted answer to these questions. A poor reflection oneconomics as a scienceQuestion 2)If per capita income in Ethiopia grows 3% per annum for the next fifty yearsand per capita income in the US grows at 3% per annum for the next fifty years, what willhappen to the income gap (in dollars) between Ethiopia and the US?Answer 2) the gap will widen. 3% of a big number (i.e. US GDP) is more than 3% of a smallnumber (i.e. Ethiopian GDP)

Page 5

Solution Manual for Macroeconomics: Understanding the Global Economy, 3rd Edition - Page 5 preview image

Loading page image...

C H A P T E R 2T h e L a ng u a g e of M a c r o e c o n o m i c s :T h e N a t i o n a l I n c o m e A c c o u n t s5INTRODUCTIONThis chapter is more interesting than its title implies as it offers opportunities to discuss currentissues. As with several chapters, one can either give a worldwide view with lots of comparativestatistics or focus on aspects of a particular economy.Teaching TipsALTERNATIVE ROUTES THROUGH THE CHAPTERThis chapter takes the logical route of discussing how to measure output before going on to itstime series propertiesit is hard to teach any other way. Output trends and business cyclesnaturally combine with material from Chapters 4 and 14.Welfare and output can be discussed either at the beginning or end of a lecture and can beextended by discussing the Human Development Index in more detail. It is useful to point outthe two types of problem with GDP measures. First, it is simply a narrow measure of what isproduced in the economy and so would not correspond precisely to welfare even if wellmeasured.Second,itdoesnotevenmeasureoutputproperlysinceitcannotincludecomponents such as non-remunerated services and the underground economy.CHAPTER GUIDE2.1What Do Macroeconomists Measure?The discussion concerning output versus welfare(which reappears at the end of the chapter) is easy to motivate. The ecological damage ofhigher output is a current example and can be used to extend the discussion to missingmarkets (i.e. properly measured output could include pollution costs if these weretradeable).2.2 How do Macroeconomists Measure Output?URL’s for National Accounts data:USAhttp://www.bea.gov/Euro-Areahttp://sdw.ecb.europa.eu/browse.do?node=2018805Japanhttp://www.esri.cao.go.jp/index-e.htmlUKhttp://www.statistics.gov.uk/hub/economy/national-accounts/national-income--expenditure-and-output/index.htmlCanadahttp://www.statcan.ca/2.3Output as Value AddedFigure 2.2 in the main text is worthy of discussion. By showing howrich countries tend to have small agriculture sectors (i.e. only a small proportion of valueadded comes from agriculture), it illustrates why many economists have argued thatindustrialization is the key to growth. Certainly, the Asian tigers followed this route toCHAPTER 2: THE LANGUAGE OF MACROECONOMICS:THE NATIONAL INCOME ACCOUNTS

Page 6

Solution Manual for Macroeconomics: Understanding the Global Economy, 3rd Edition - Page 6 preview image

Loading page image...

C H A P T E R 2T h e L a ng u a g e of M a c r o e c o n o m i c s :T h e N a t i o n a l I n c o m e A c c o u n t s6success. Whilst in principle there is now reason why a country cannot transition from beingpoor to rich by becoming a highly efficient agricultural producerno country in the worldhas managed this transition in practice (New Zealand is a rich economy that is largelydependent on agriculture, but its development was largely due to colonization).2.4National Income AccountsFurther explanations for some of the big GNP/GDP differencesshown in figure 2.5 are given in the Chart and Table tips. Students find that a practicaldiscussion of individual countries extremely useful as a way of understanding the concepts.2.5How Large Are Modern Economies?A useful way of expanding this section is to discuss thedata on national economies published by the World Bankhttp://www.worldbank.org/poverty/wdrpoverty/report/index.htm2.6Total Output and Total Happiness.To stimulate discussion here it is worth getting hold ofsome Human Development Index (HDI) figures(http://hdr.undp.org). The tables givecomparisons between the HDI and standard GDP figures. Generally speaking, the HDI andGDP are pretty similar, with some interesting exceptions-Oil exporters: Far higher GDP than HDIUSA: Top in GDP but not in HDI.Cuba: Far higher on the HDI than on GDP.Brunei: Higher GDP than HDI since a large proportion of total GDP goes exclusively to theSultan.The Case Study “It’s the Economy, Stupid” shows how data errors and the slow dispersionof economic data influenced the 1992 US presidential election. Details on the release of USdata are given in the Case Study to Chapter 15.TABLE & CHART TIPSFigure 2.5.GDP is generally higher than GNP for recipients of foreign investment who have toremit profits (e.g. US). As we shall see in Chapter 14, recipients of substantial foreigninvestment have been amongst the fastest growing economies in the world (Chile, Ireland).Ireland in particular has benefited from huge investments by US firms (e.g. Dell).Oil exporters like Kuwait tend to be net investors in the rest of the world and therefore receivenet interest profits and dividends from overseas. Norway is now an oil exporter and is rapidlymoving towards a larger GNP than GDP as it uses oil receipts to invest overseas.A significant proportion of the population of Bangladesh work overseas and their remittancesback home substantially boost GNP. The Philippines is an even more extreme example of thisphenomenon.Figure 2.9Economists have used three main methods of measuring the underground economy.1)Statistical discrepancies. In most countries, figures for the expenditure measure of GDPare higher than the income measure even though they should in fact be the same. This

Page 7

Solution Manual for Macroeconomics: Understanding the Global Economy, 3rd Edition - Page 7 preview image

Loading page image...

C H A P T E R 2T h e L a ng u a g e of M a c r o e c o n o m i c s :T h e N a t i o n a l I n c o m e A c c o u n t s7discrepancy arises because people tend to attempt to avoid or evade income tax and soincome is under-recorded. There can be similar discrepancies between the recordedlabor force (people in employment or claiming benefit) and the actual labor force aspeople in the shadow economy withdraw from the official labor market. However,these discrepancies tend to capture only a small part of the shadow economy.2)Cash demand. As we shall see in Chapter 12, economists often analyze the relationshipbetween cash circulating in the economy and total transactions in the economy. If cashdemand is much higher than recorded output, it may be because the shadow economyprefers the anonymity of cash. In fact, a very high ratio of cash to bank depositssuggests the presence of a large shadow economy.3)Physical input. Since the shadow economy still needs to use measured inputs such aselectricity, it is possible to gauge the size of the shadow economy by looking at thedemand for such inputs. If the demand outstrips what is necessary for official output, itis a good indication that the shadow economy is important.The chart in the text shows figures for the electricity-input method only, as this gives thebroadest sample of countries.Figure 2.13Further information on environmental accounting can be found athttp://web.worldbank.org/WBSITE/EXTERNAL/TOPICS/ENVIRONMENT/EXTDATASTA/0,,contentMDK:21060933~menuPK:7333796~pagePK:64168427~piPK:64168435~theSitePK:2875751,00.htmlCASE STUDY: “IT’S THE ECONOMY, STUPID”In 1992, campaign adviser James Carville came up with the slogan that is thought to have wonBill Clinton his first presidential election-“it’s the economy, stupid”. Under President GeorgeBush (senior), the economy had suffered a mild recession (negative output growth) after theGulf War. However, by the time of the election, the economy had already begun to recoverstrongly (growth was 3.2% in 1992) and so Bill Clinton’s campaign slogan should probably nothave struck home as strongly as it did. Why didn’t Bush get the credit for the recovery?1)Slowly changing expectations. Even after you come out of a recession you don’t feelbetter off. This makes sense because if output has fallen, it may take a year or more toget income back up to its pre-recession level.2)Data collection lags. Although US GDP data are amongst the most rapidly compiled inthe world, it still takes several months for the final data to be reported. So in 1992,although the preliminary Q3 GDP figures were available in late October, the finalnumbers were not reported until much later.3)Preliminary data errors. When the preliminary Q3 GDP figures arrived, they were apleasant surprise for Mr. Bush-the economy had supposedly grown by 2.7% (at anannualized rate). However, many commentators dismissed them as incorrect. Forexample, CBS reporter Susan Spencer filed from the Bush campaign: "He crowed today

Page 8

Solution Manual for Macroeconomics: Understanding the Global Economy, 3rd Edition - Page 8 preview image

Loading page image...

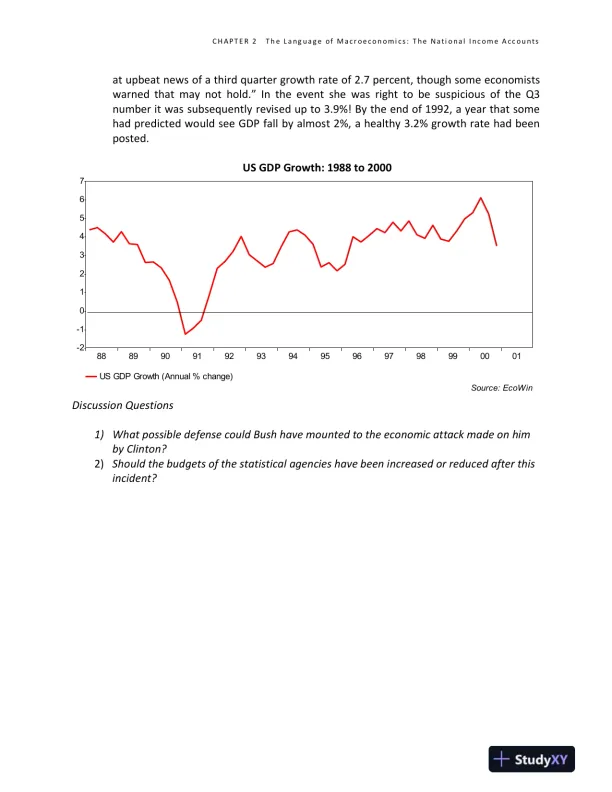
C H A P T E R 2T h e L a ng u a g e of M a c r o e c o n o m i c s :T h e N a t i o n a l I n c o m e A c c o u n t s8at upbeat news of a third quarter growth rate of 2.7 percent, though some economistswarned that may not hold.” In the event she was right to be suspicious of the Q3number it was subsequently revised up to 3.9%! By the end of 1992, a year that somehad predicted would see GDP fall by almost 2%, a healthy 3.2% growth rate had beenposted.US GDP Growth: 1988 to 2000US GDP Growth (Annual % change)Source: EcoWin8889909192939495969798990001-2-101234567Discussion Questions1)What possible defense could Bush have mounted to the economic attack made on himby Clinton?2)Should the budgets of the statistical agencies have been increased or reduced after thisincident?

Page 9

Solution Manual for Macroeconomics: Understanding the Global Economy, 3rd Edition - Page 9 preview image

Loading page image...

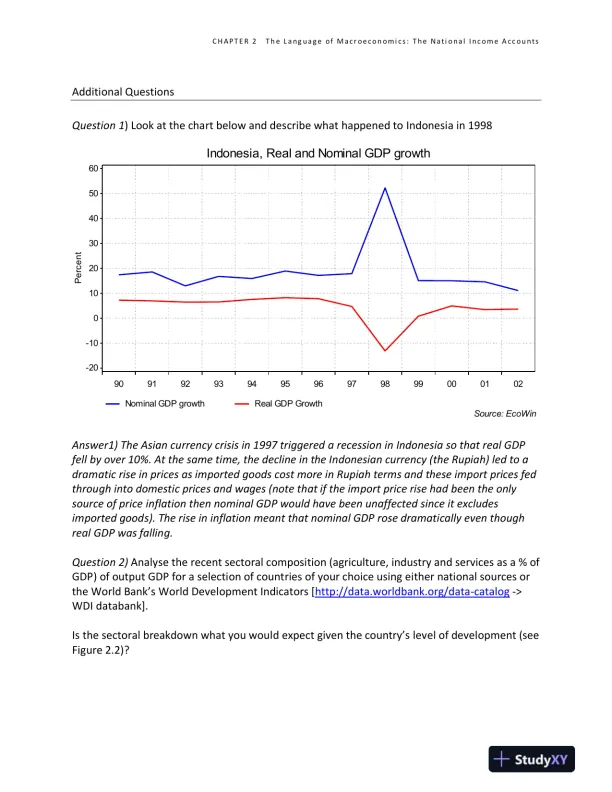
C H A P T E R 2T h e L a ng u a g e of M a c r o e c o n o m i c s :T h e N a t i o n a l I n c o m e A c c o u n t s9Additional QuestionsQuestion 1) Look at the chart below and describe what happened to Indonesia in 1998Indonesia, Real and Nominal GDP growthNominal GDP growthReal GDP GrowthSource: EcoWin90919293949596979899000102Percent-20-100102030405060Answer1) The Asian currency crisis in 1997 triggered a recession in Indonesia so that real GDPfell by over 10%. At the same time, the decline in the Indonesian currency (the Rupiah) led to adramatic rise in prices as imported goods cost moreinRupiah terms and these import prices fedthrough into domestic prices and wages (note that if the import price rise had been the onlysource of price inflation then nominal GDP would have been unaffected since it excludesimported goods). The rise in inflation meant that nominal GDP rose dramatically even thoughreal GDP was falling.Question 2)Analyse the recent sectoral composition (agriculture, industry and services as a % ofGDP) of output GDP for a selection of countries of your choice using either national sources orthe World Bank’s World Development Indicators [http://data.worldbank.org/data-catalog->WDI databank].Is the sectoral breakdown what you would expect given the country’s level of development (seeFigure 2.2)?

Page 10

Solution Manual for Macroeconomics: Understanding the Global Economy, 3rd Edition - Page 10 preview image

Loading page image...

C H A P T E R 3 T h e W ea l t h o f N a t i o n s10INTRODUCTIONThis chapter is excellent for motivating the study of economics and so is a key chapter inthe book. By looking at growth from a historical and international perspective it offersstudents new insights and shows how important economics can be. Given that manystudents are impatient to focus on monetary policy and the business cycle (i.e. the stuffthey read in the newspapers), it is important to motivate this topic well.Teaching TipsALTERNATIVE ROUTES THROUGH THE CHAPTERThe first three sections of this chapter give an entertaining account of the history ofeconomic growth and could therefore be included in a separate opening lecture. Thefollowing sections introduce material that is analyzed in more detail in Chapters 4,5,6 and 7and could be combined with lectures on those chapters. However, since these sectionsoffer an overview of those later chapters, it would be natural to start with them or use thischapter as pre-lecture reading..CHAPTER GUIDE3.1The Importance of Economic Growth.It is worth motivating this section by looking ateconomic reports in newspapers. Most of them will be concerned with cyclical rather thanlong run issues (e.g. the next move in interest rates).Although most students will not haveheard of Thomas Malthus, they may have heard of economics described as “The DismalScience”. Malthus’s theory of population was the inspiration for that description. It mayalso be worth noting that many of Marx’s dismal prophecies were predicated on theconsequences of limited economic growth.3.2The Impact of Long-Run Growth.The relationship between growth and poverty reductionis a key one to those who are skeptical about the importance of economic growth. It isinteresting to contrast the fact that global poverty reduction has been largely due topoverty reduction in China, despite the fact that China has actually experienced increasedinequality (section 4.8)3.3Explaining Cross-Country Income Differences. In developing countries, thephenomenonofunderemployment is relatively common. This is where people who are notionally employedwork fewer hours than they would wish. Often this occurs when a large extended familyworks on a small farm. As a result, drawing labour out of the agricultural sector (oftenduring the process of industrialization can raise measured productivity in the agriculturalsector.3.4.The Production Function and Factor InputsThis, and the following sections, introducematerial that will be covered in detail in the following four chapters. It also introduces thekey supply side concept of the production function.CHAPTER 3: THE WEALTH OF NATIONSTHESUPPLY SIDE

Page 11

Solution Manual for Macroeconomics: Understanding the Global Economy, 3rd Edition - Page 11 preview image

Loading page image...

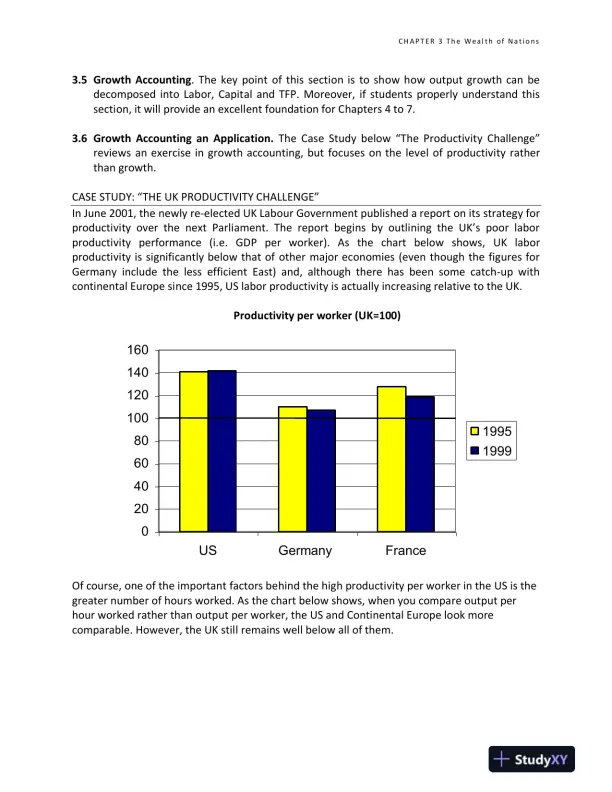
C H A P T E R 3 T h e W ea l t h o f N a t i o n s113.5Growth Accounting. The key point of this section is to show how output growth can bedecomposed into Labor, Capital and TFP. Moreover, if students properly understand thissection, it will provide an excellent foundation for Chapters 4 to 7.3.6Growth Accounting an Application.The Case Study below “The Productivity Challenge”reviews an exercise in growth accounting, but focuses on the level of productivity ratherthan growth.CASE STUDY: “THE UK PRODUCTIVITY CHALLENGE”In June 2001, the newly re-elected UK Labour Government published a report on its strategy forproductivity over the next Parliament. The report begins by outlining the UK’s poor laborproductivityperformance(i.e.GDPperworker).Asthechartbelowshows,UKlaborproductivity is significantly below that of other major economies (even though the figures forGermany include the less efficient East) and, although there has been some catch-up withcontinental Europe since 1995, US labor productivity is actually increasing relative to the UK.Productivity per worker (UK=100)020406080100120140160USGermanyFrance19951999Of course, one of the important factors behind the high productivity per worker in the US is thegreater number of hours worked. As the chart below shows, when you compare output perhour worked rather than output per worker, the US and Continental Europe look morecomparable. However, the UK still remains well below all of them.

Page 12

Solution Manual for Macroeconomics: Understanding the Global Economy, 3rd Edition - Page 12 preview image

Loading page image...

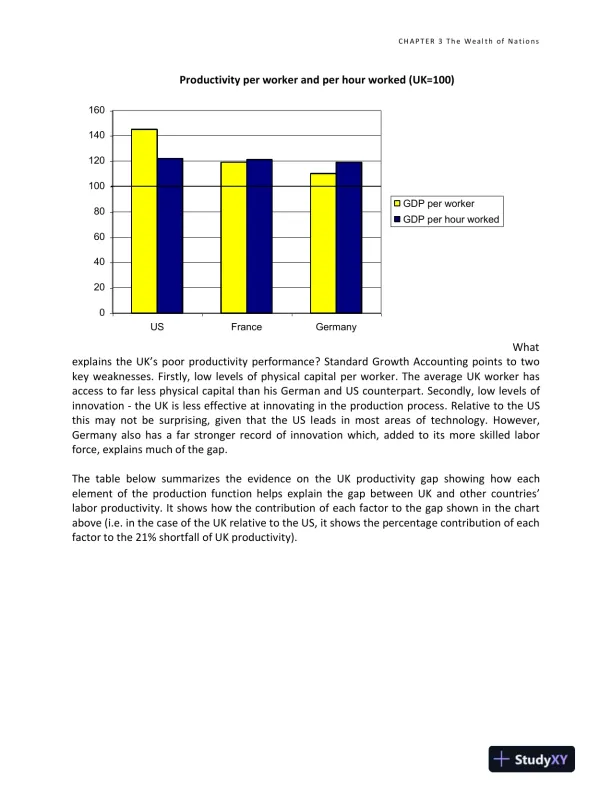
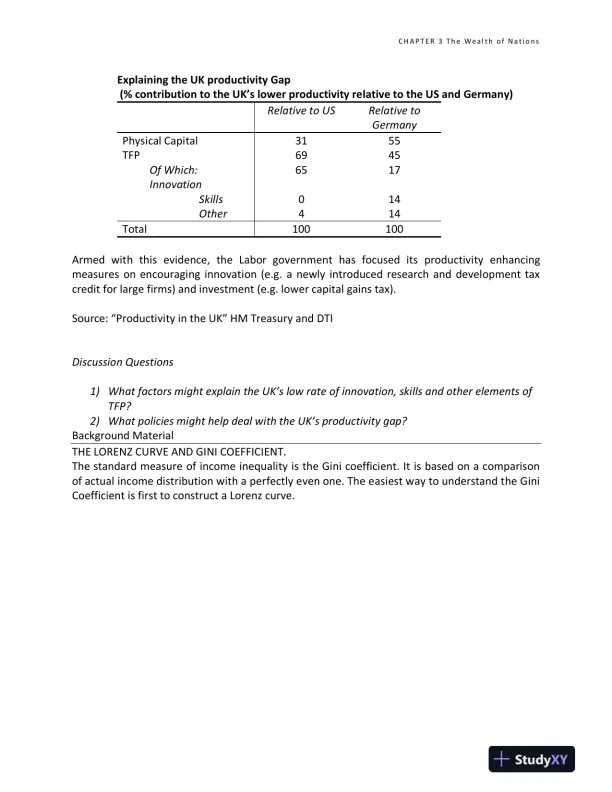
C H A P T E R 3 T h e W ea l t h o f N a t i o n s12Productivity per worker and per hour worked (UK=100)020406080100120140160USFranceGermanyGDP per workerGDP per hour workedWhatexplains the UK’s poor productivity performance? Standard Growth Accounting points to twokey weaknesses. Firstly, low levels of physical capital per worker. The average UK worker hasaccess to far less physical capital than his German and US counterpart. Secondly, low levels ofinnovation-the UK is less effective at innovating in the production process. Relative to the USthis may not be surprising, given that the US leads in most areas of technology. However,Germany also has a far stronger record of innovation which, added to its more skilled laborforce, explains much of the gap.The table below summarizes the evidence on the UK productivity gap showing how eachelement of the production function helps explain the gap between UK and other countries’labor productivity. It shows how the contribution of each factor to the gap shown in the chartabove (i.e. in the case of the UK relative to the US, it shows the percentage contribution of eachfactor to the 21% shortfall of UK productivity).

Page 13

Solution Manual for Macroeconomics: Understanding the Global Economy, 3rd Edition - Page 13 preview image

Loading page image...

C H A P T E R 3 T h e W ea l t h o f N a t i o n s13Explaining the UK productivity Gap(% contribution to the UK’s lower productivity relative to the US and Germany)Relative to USRelative toGermanyPhysical Capital3155TFP6945Of Which:Innovation6517Skills014Other414Total100100Armed with this evidence, the Labor government has focused its productivity enhancingmeasures on encouraging innovation (e.g. a newly introduced research and development taxcredit for large firms) and investment (e.g. lower capital gains tax).Source: “Productivity in the UK” HM Treasury and DTIDiscussion Questions1)What factors might explain the UK’s low rate of innovation, skills and other elements ofTFP?2)What policies might help deal with the UK’s productivity gap?Background MaterialTHE LORENZ CURVE AND GINI COEFFICIENT.The standard measure of income inequality is the Gini coefficient. It is based on a comparisonof actual income distribution with a perfectly even one. The easiest way to understand the GiniCoefficient is first to construct a Lorenz curve.

Page 14

Solution Manual for Macroeconomics: Understanding the Global Economy, 3rd Edition - Page 14 preview image

Loading page image...

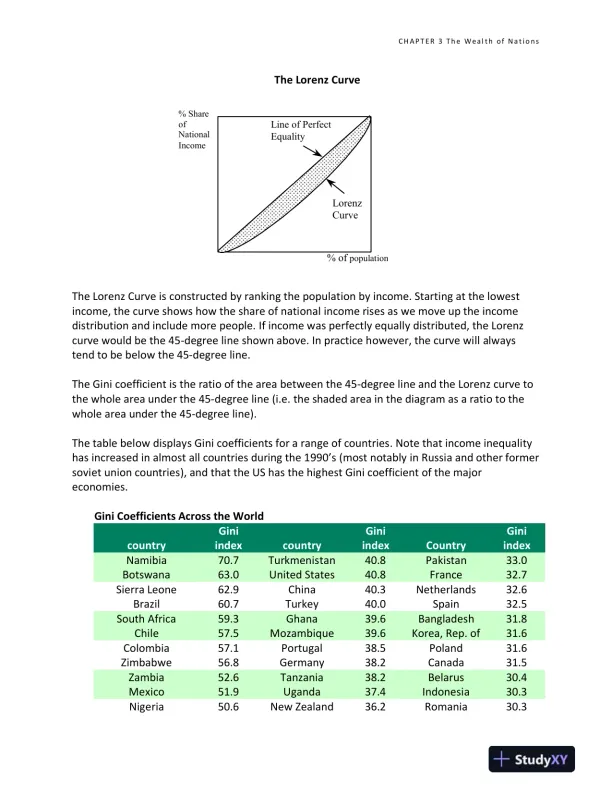
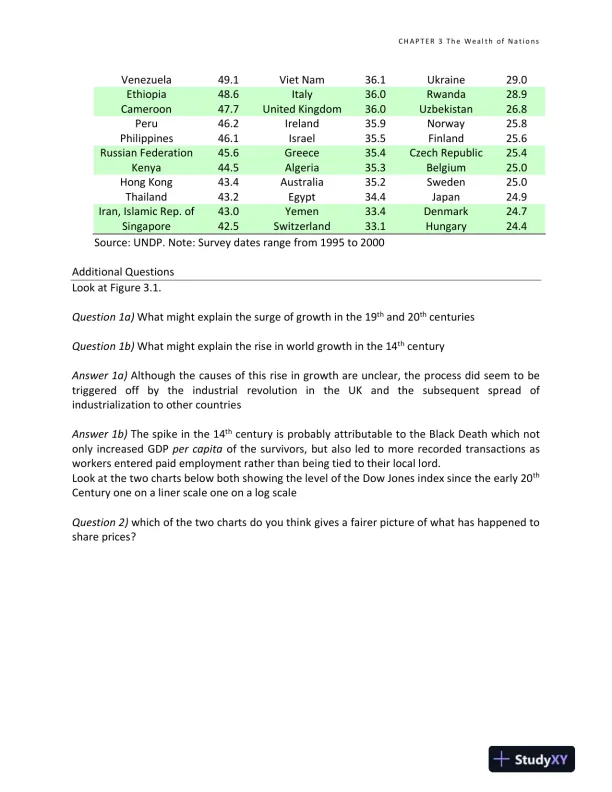
C H A P T E R 3 T h e W ea l t h o f N a t i o n s14The Lorenz Curve% ShareofNationalIncome% ofpopulationLine of PerfectEqualityLorenzCurveThe Lorenz Curve is constructed by ranking the population by income. Starting at the lowestincome, the curve shows how the share of national income rises as we move up the incomedistribution and include more people. If income was perfectly equally distributed, the Lorenzcurve would be the 45-degree line shown above. In practice however, the curve will alwaystend to be below the 45-degree line.The Gini coefficient is the ratio of the area between the 45-degree line and the Lorenz curve tothe whole area under the 45-degree line (i.e. the shaded area in the diagram as a ratio to thewhole area under the 45-degree line).The table below displays Gini coefficients for a range of countries. Note that income inequalityhas increased in almost all countries during the 1990’s (most notably in Russia and other formersoviet union countries), and that the US has the highest Gini coefficient of the majoreconomies.Gini Coefficients Across the WorldcountryGiniindexcountryGiniindexCountryGiniindexNamibia70.7Turkmenistan40.8Pakistan33.0Botswana63.0United States40.8France32.7Sierra Leone62.9China40.3Netherlands32.6Brazil60.7Turkey40.0Spain32.5South Africa59.3Ghana39.6Bangladesh31.8Chile57.5Mozambique39.6Korea, Rep. of31.6Colombia57.1Portugal38.5Poland31.6Zimbabwe56.8Germany38.2Canada31.5Zambia52.6Tanzania38.2Belarus30.4Mexico51.9Uganda37.4Indonesia30.3Nigeria50.6New Zealand36.2Romania30.3

Page 15

Solution Manual for Macroeconomics: Understanding the Global Economy, 3rd Edition - Page 15 preview image

Loading page image...

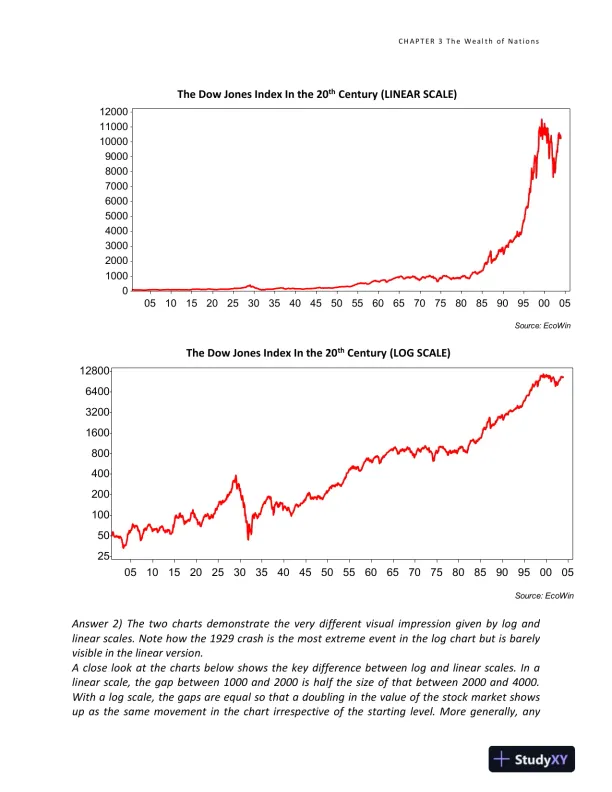
C H A P T E R 3 T h e W ea l t h o f N a t i o n s15Venezuela49.1Viet Nam36.1Ukraine29.0Ethiopia48.6Italy36.0Rwanda28.9Cameroon47.7United Kingdom36.0Uzbekistan26.8Peru46.2Ireland35.9Norway25.8Philippines46.1Israel35.5Finland25.6Russian Federation45.6Greece35.4Czech Republic25.4Kenya44.5Algeria35.3Belgium25.0Hong Kong43.4Australia35.2Sweden25.0Thailand43.2Egypt34.4Japan24.9Iran, Islamic Rep. of43.0Yemen33.4Denmark24.7Singapore42.5Switzerland33.1Hungary24.4Source: UNDP. Note: Survey dates range from 1995 to 2000Additional QuestionsLook atFigure 3.1.Question 1a)What might explain the surge of growth in the 19thand 20thcenturiesQuestion 1b)What might explain the rise in world growth in the 14thcenturyAnswer 1a)Although the causes of this rise in growth are unclear, the process did seem to betriggeredoffbytheindustrialrevolutionintheUKandthesubsequentspreadofindustrialization to other countriesAnswer 1b)The spike in the 14thcentury is probably attributable to the Black Death which notonly increased GDPper capitaof the survivors, but also led to more recorded transactions asworkers entered paid employment rather than being tied to their local lord.Look at the two charts below both showing the level of the Dow Jones index since the early 20thCentury one on a liner scale one on a log scaleQuestion 2)which of the two charts do you think gives a fairer picture of what has happened toshare prices?

Page 16

Solution Manual for Macroeconomics: Understanding the Global Economy, 3rd Edition - Page 16 preview image

Loading page image...

C H A P T E R 3 T h e W ea l t h o f N a t i o n s16The Dow Jones Index In the 20thCentury (LINEAR SCALE)Source: EcoWin0510152025303540455055606570758085909500050100020003000400050006000700080009000100001100012000The Dow Jones Index In the 20thCentury (LOG SCALE)Source: EcoWin051015202530354045505560657075808590950005255010020040080016003200640012800Answer 2) The two charts demonstrate the very different visual impression given by log andlinear scales. Note how the 1929 crash is the most extreme event in the log chart but is barelyvisible in the linear version.A close look at the charts below shows the key difference between log and linear scales. In alinear scale, the gap between 1000 and 2000 is half the size of that between 2000 and 4000.With a log scale, the gaps are equal so that a doubling in the value of the stock market showsup as the same movement in the chart irrespective of the starting level. More generally, any
Preview Mode

This document has 232 pages. Sign in to access the full document!

Study Now!

XY-Copilot AI
Unlimited Access
Secure Payment
Instant Access
24/7 Support
Document Chat

Document Details

Subject
Economics

Related Documents

View all