Solution Manual for Microeconomics, 8th edition

Learn faster with Solution Manual for Microeconomics, 8th edition, a comprehensive solution manual for effective studying.

Ethan Brown
Contributor
4.2
57
9 months ago
Preview (31 of 479 Pages)
100%
Purchase to unlock

Page 1

Solution Manual for Microeconomics, 8th edition - Page 1 preview image

Loading page image...

MicroeconomicsEighthEditionR.Glenn HubbardAnthony Patrick O’BrienInstructor’s Resource ManualforMicroeconomicsEdward Scahill

Page 2

Solution Manual for Microeconomics, 8th edition - Page 2 preview image

Loading page image...

Page 3

Solution Manual for Microeconomics, 8th edition - Page 3 preview image

Loading page image...

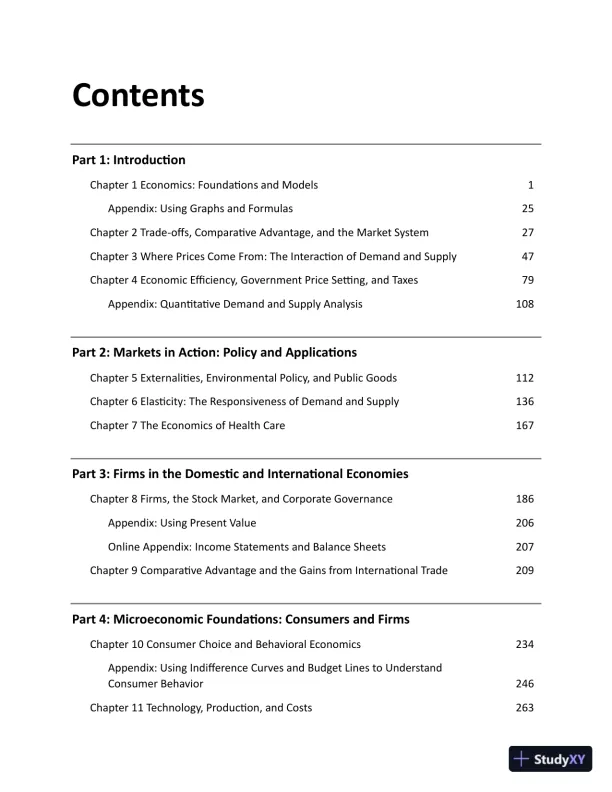
ContentsPart 1: IntroductionChapter 1 Economics: Foundations and Models1Appendix: Using Graphs and Formulas25Chapter 2 Trade-offs, Comparative Advantage, and the Market System27Chapter 3 Where Prices Come From: The Interaction of Demand and Supply47Chapter 4 Economic Efficiency, Government Price Setting, and Taxes79Appendix:Quantitative Demand and Supply Analysis108Part 2: Markets in Action: Policy and ApplicationsChapter 5 Externalities, Environmental Policy, and Public Goods112Chapter 6 Elasticity: The Responsiveness of Demand and Supply136Chapter 7 The Economics of Health Care167Part 3: Firms in the Domestic and International EconomiesChapter 8 Firms, the Stock Market, and Corporate Governance186Appendix:Using Present Value206OnlineAppendix:Income Statements and Balance Sheets207Chapter 9 Comparative Advantage and the Gains from International Trade209Part 4: Microeconomic Foundations: Consumers and FirmsChapter 10 Consumer Choice and Behavioral Economics234Appendix: Using Indifference Curves and Budget Lines to UnderstandConsumer Behavior246Chapter 11 Technology, Production, and Costs263

Page 4

Solution Manual for Microeconomics, 8th edition - Page 4 preview image

Loading page image...

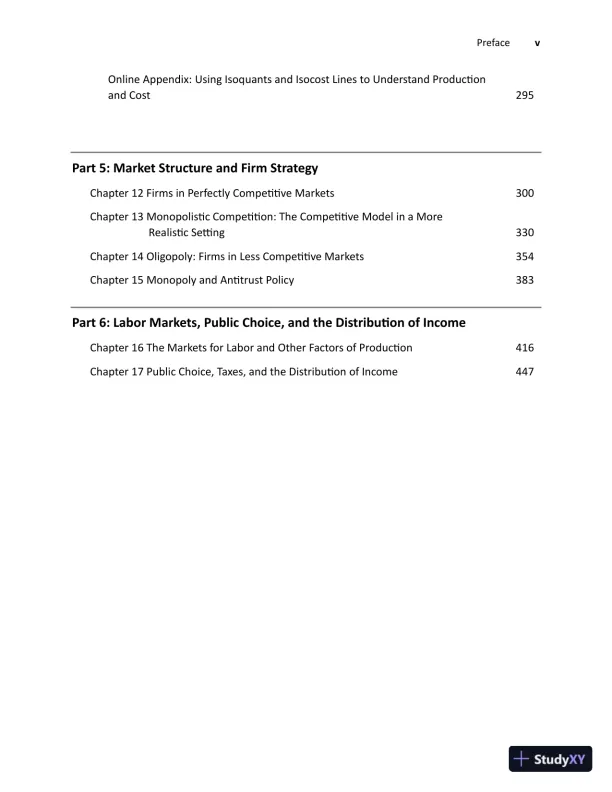
PrefacevOnlineAppendix:Using Isoquants and Isocost Lines to Understand Productionand Cost295Part 5: Market Structure and Firm StrategyChapter 12 Firms in Perfectly Competitive Markets300Chapter 13 Monopolistic Competition: The Competitive Model in a MoreRealistic Setting330Chapter 14 Oligopoly: Firms in Less Competitive Markets354Chapter 15 Monopoly and Antitrust Policy383Part 6: Labor Markets, Public Choice, and the Distribution of IncomeChapter 16The Markets for Labor and Other Factors of Production416Chapter 17Public Choice, Taxes, and the Distribution of Income447

Page 5

Solution Manual for Microeconomics, 8th edition - Page 5 preview image

Loading page image...

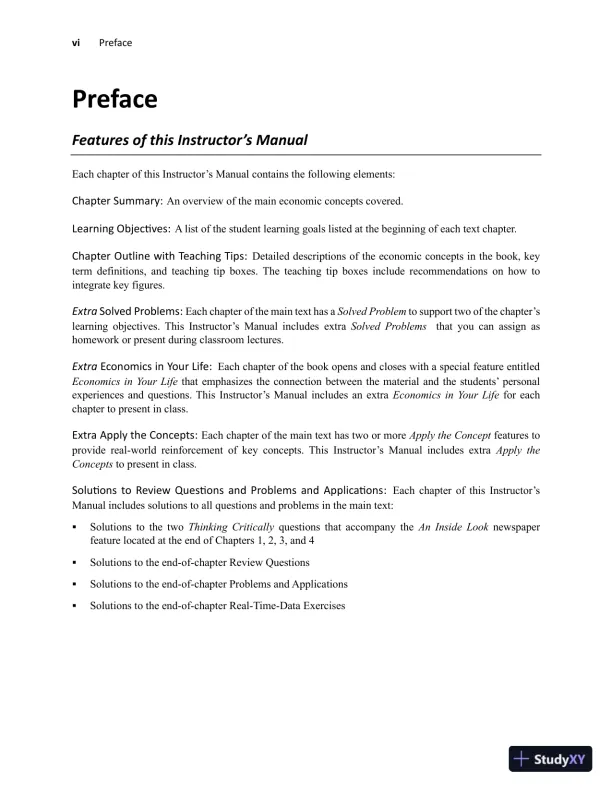
viPrefacePrefaceFeatures of this Instructor’s ManualEach chapter of this Instructor’s Manual contains thefollowing elements:Chapter Summary:An overview of the main economic concepts covered.Learning Objectives:A list of the student learning goals listed at the beginning of each text chapter.Chapter Outline with Teaching Tips:Detailed descriptions of the economic concepts in the book, keyterm definitions, and teaching tip boxes.The teaching tip boxes include recommendationson how tointegrate key figures.ExtraSolved Problems:Each chapter of the main text has aSolved Problemto support two of the chapter’slearning objectives. This Instructor’s Manual includesextraSolved Problemsthat youcan assign ashomework or present during classroom lectures.ExtraEconomics inYour Life:Each chapter of the book opens and closes with a special feature entitledEconomics inYour Lifethatemphasizes the connection between the material and the students’ personalexperiences and questions. This Instructor’s Manual includes an extraEconomics in Your Lifefor eachchapter to present in class.ExtraApply the Concepts:Each chapter of the main text has two or moreApply the Conceptfeatures toprovide real-world reinforcement of key concepts. This Instructor’s Manual includes extraApply theConceptsto present in class.Solutions to Review Questions and Problems and Applications:Each chapter of this Instructor’sManual includes solutions to all questions and problems in the main text:Solutions to the twoThinking Criticallyquestions that accompany theAn Inside Looknewspaperfeature located at the end ofChapters 1, 2, 3, and 4Solutions to the end-of-chapter Review QuestionsSolutions to the end-of-chapter Problems and ApplicationsSolutions to the end-of-chapterReal-Time-Data Exercises

Page 6

Solution Manual for Microeconomics, 8th edition - Page 6 preview image

Loading page image...

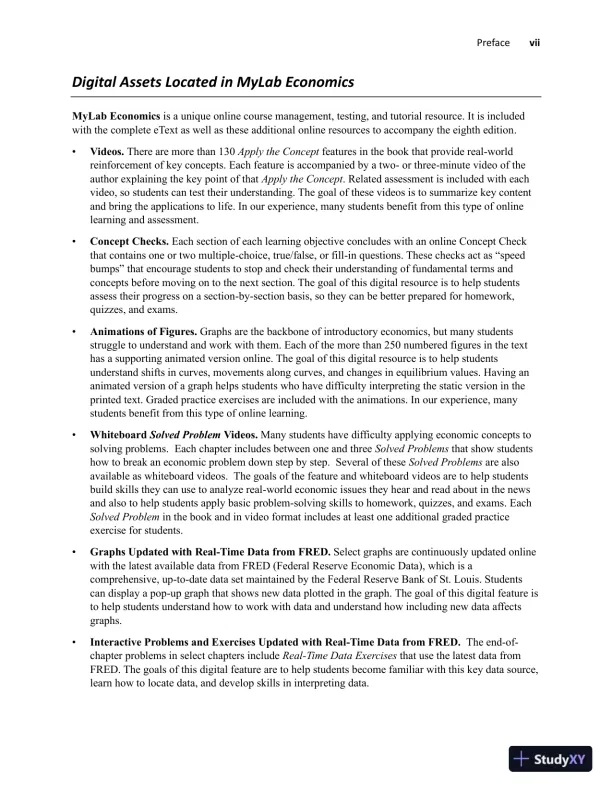
PrefaceviiDigitalAssetsLocated in MyLabEconomicsMyLabEconomicsis a unique online course management, testing, and tutorial resource. It is includedwith thecompleteeTextas well as these additional online resources to accompany the eighth edition.Videos.There are more than 130Apply the Conceptfeatures inthe book that provide real-worldreinforcement of key concepts. Each feature is accompanied by a two-or three-minute video of theauthor explaining the key point of thatApply the Concept. Related assessment is included with eachvideo, sostudents can test their understanding. The goal of these videos is to summarize key contentand bring the applications to life. In our experience, many students benefit from this type of onlinelearning and assessment.Concept Checks.Each section of each learning objective concludes with an online Concept Checkthat contains one or two multiple-choice, true/false, or fill-in questions. These checks act as “speedbumps” that encourage students to stop and check their understanding of fundamental terms andconcepts before moving on to the next section. The goal of this digital resource is to help studentsassess their progress on a section-by-section basis, so they can be better prepared for homework,quizzes, and exams.Animationsof Figures.Graphs are the backbone of introductory economics, but many studentsstruggle to understand and work with them. Each of themore than 250numbered figures in the texthas a supporting animated version online. The goal of this digital resource is to help studentsunderstand shifts in curves, movements along curves, and changes in equilibrium values. Having ananimated version of a graph helps students who have difficulty interpreting the static version in theprinted text. Graded practice exercises are included with the animations. In our experience, manystudents benefit from this type of online learning.WhiteboardSolved ProblemVideos.Many students have difficulty applying economic concepts tosolving problems.Each chapter includes between one and threeSolved Problemsthat show studentshow to break an economicproblem down step by step. Several of theseSolved Problemsare alsoavailable as whiteboard videos.The goalsof thefeatureand whiteboard videosare tohelpstudentsbuild skills they can use to analyze real-world economic issuesthey hear and read about in the newsand also to help students apply basic problem-solving skills to homework, quizzes, and exams. EachSolved Problemin the book and in video formatincludes at least one additional graded practiceexercise for students.Graphs Updated with Real-Time Data from FRED.Selectgraphs are continuously updated onlinewith the latest available data from FRED (Federal Reserve Economic Data), which is acomprehensive, up-to-date data set maintained by the Federal Reserve Bank of St. Louis. Studentscan display a pop-up graph that shows new data plotted in the graph. The goal of this digital feature isto help students understand how to work with data and understand how including new data affectsgraphs.Interactive Problems and Exercises Updated with Real-Time Data from FRED.The end-of-chapter problems in select chapters includeReal-Time Data Exercisesthat use the latest data fromFRED. The goals of this digital feature are to help students become familiar with this key data source,learn how to locate data, and develop skills in interpreting data.

Page 7

Solution Manual for Microeconomics, 8th edition - Page 7 preview image

Loading page image...

viiiPrefaceOrganizing Your SyllabusThe Instructor’s Manual can be a valuable resource for both experienced and first-time instructors. Boththe textbook and Instructor’s Manual provide comprehensive coverage of economic theory, monetarypolicy, fiscal policy, and real-world applications.The microeconomics chapters cover relatively new developments in the field, such as the economics ofinformation (Chapter 7, “The Economics of Health Care”) and personnel economics (Chapter 16, “TheMarkets for Labor and Other Factors of Production”). The authors include business applications in eachchapter and have a dedicated chapter on firms, the stock market, and corporate governance (Chapter 8,“Firms, the Stock Market, and Corporate Governance”). The comprehensive coverage of microeconomicsand business topics allows instructors to select chapters for diverse groups of students.Most instructors will not want to cover indifference curve analysis, but those who wish to will find thistopic covered in the appendixto Chapter 10, “Consumer Choice and Behavioral Economics.An onlineappendix is available for instructors who wish to cover isoquant and isocost curves to accompanyChapter11, “Technology,Production, and Costs.”Chapter 14 of this instructor’s manual, “Oligopoly: Firms in LessCompetitive Markets,” includes coverage of the kinked demand curve thatdoes notappear in themainbook.First-time users of the textbook should be aware that some topics introduced in one chapter are applied ina later chapter. Chapter 4, “Economic Efficiency, Government Price Setting, and Taxes,” introducesconsumer, producer,and economic surplus to describe the impact of government-imposed price controls.The appendix toChapter 4, “Quantitative Demand and Supply Analysis,” explains in detail how consumerand producer surplus are calculated using linear demand and supply curves. Chapter 9, “ComparativeAdvantage and the Gains from International Trade,” uses the same tools to measure theeffectof tariffs andquotas on international trade.

Page 8

Solution Manual for Microeconomics, 8th edition - Page 8 preview image

Loading page image...

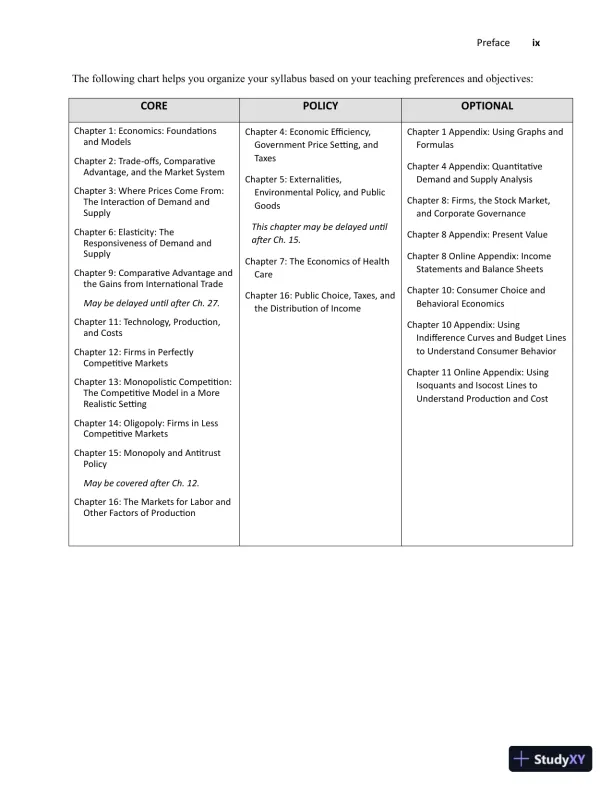
PrefaceixThe following chart helps you organize your syllabus based on your teaching preferences and objectives:COREPOLICYOPTIONALChapter 1: Economics: Foundationsand ModelsChapter 2: Trade-offs,ComparativeAdvantage, and the Market SystemChapter 3: Where Prices Come From:The Interaction of Demand andSupplyChapter 6: Elasticity: TheResponsiveness of Demand andSupplyChapter 9: Comparative Advantage andthe Gains from International TradeMay be delayed until afterCh.27.Chapter 11: Technology, Production,and CostsChapter 12: Firms in PerfectlyCompetitive MarketsChapter 13: Monopolistic Competition:The Competitive Model in a MoreRealistic SettingChapter 14: Oligopoly: Firms in LessCompetitive MarketsChapter 15: Monopoly and AntitrustPolicyMay be covered afterCh.12.Chapter 16: The Markets for Labor andOther Factors of ProductionChapter 4: Economic Efficiency,Government Price Setting, andTaxesChapter 5: Externalities,Environmental Policy, and PublicGoodsThis chapter may be delayed untilafterCh.15.Chapter 7:The Economics of HealthCareChapter 16: Public Choice,Taxes, andthe Distribution of IncomeChapter 1 Appendix: Using Graphs andFormulasChapter 4 Appendix: QuantitativeDemand and Supply AnalysisChapter 8: Firms, the Stock Market,and Corporate GovernanceChapter 8Appendix:Present ValueChapter 8 Online Appendix: IncomeStatements and Balance SheetsChapter 10: ConsumerChoiceandBehavioral EconomicsChapter 10Appendix: UsingIndifference Curves and Budget Linesto Understand Consumer BehaviorChapter 11 OnlineAppendix: UsingIsoquants and IsocostLines toUnderstand Production and Cost

Page 9

Solution Manual for Microeconomics, 8th edition - Page 9 preview image

Loading page image...

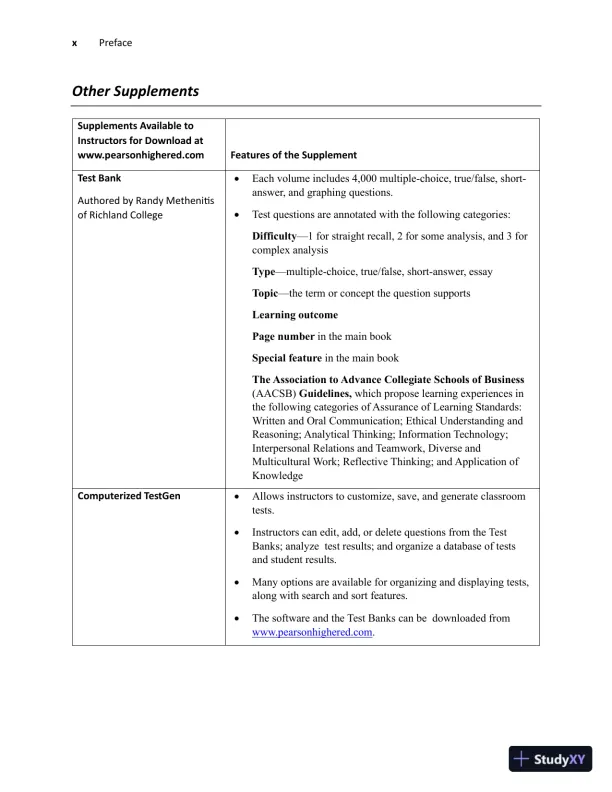
xPrefaceOtherSupplementsSupplements Available toInstructors for Download atwww.pearsonhighered.comFeatures of the SupplementTest BankAuthored by Randy Methenitisof Richland CollegeEach volume includes4,000 multiple-choice, true/false, short-answer, and graphing questions.Test questions are annotated with the following categories:Difficulty1 for straight recall, 2 for some analysis, and 3 forcomplexanalysisTypemultiple-choice,true/false, short-answer, essayTopicthe term or concept the question supportsLearning outcomePage numberin the main bookSpecial featurein the main bookThe Association to Advance Collegiate Schools of Business(AACSB)Guidelines,which propose learning experiences inthe following categories of Assurance of Learning Standards:Written and Oral Communication;Ethical Understanding andReasoning; AnalyticalThinking; Information Technology;Interpersonal Relations and Teamwork, Diverse andMulticulturalWork; Reflective Thinking; andApplication ofKnowledgeComputerized TestGenAllows instructors to customize, save, and generate classroomtests.Instructors can edit, add, or delete questions from the TestBanks; analyze test results; and organize a database of testsand student results.Many options are available for organizing and displaying tests,along with search and sort features.The software and the Test Banks can be downloaded fromwww.pearsonhighered.com.

Page 10

Solution Manual for Microeconomics, 8th edition - Page 10 preview image

Loading page image...

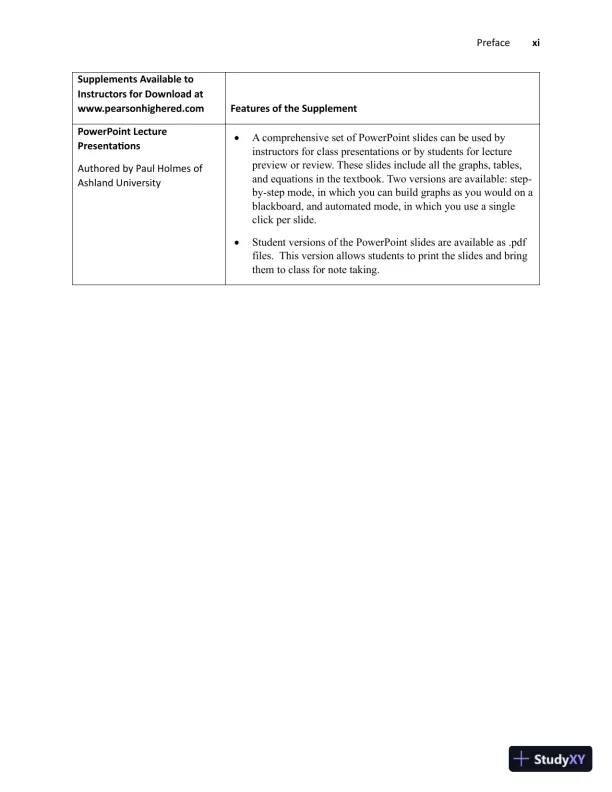
PrefacexiSupplements Available toInstructors for Download atwww.pearsonhighered.comFeatures of the SupplementPowerPoint LecturePresentationsAuthored by Paul Holmes ofAshland UniversityA comprehensive set of PowerPoint slides can be used byinstructors for class presentations or by students for lecturepreview or review. Theseslides include all the graphs, tables,and equations in the textbook. Two versions are available: step-by-step mode, in which you can buildgraphsas you would on ablackboard, and automated mode, in which you use a singleclick per slide.Student versions of the PowerPoint slides are available as .pdffiles. This version allows students to print the slides and bringthem to class for note taking.

Page 11

Solution Manual for Microeconomics, 8th edition - Page 11 preview image

Loading page image...

CHAPTER1|Economics: Foundationsand ModelsBrief Chapter Summary and Learning Objectives1.1Three Key Economic Ideas(pages 47)Explain these three keyeconomic ideas:People are rational, people respond to economicincentives, and optimal decisions are made at the margin.Because resources are scarce, people must make choices to attain their goals.1.2The Economic Problem That Every Society Must Solve(pages 811)Discuss how an economy answers these questions: What goods and services will be produced?Howwill the goods and services be produced? Who will receive the goods and servicesproduced?Because of scarcity, producing more of one good or service means that less of some other goodor service will be produced.1.3Economic Models(pages 1115)Explain how economists use models to analyze economic events and government policies.Economists use modelssimplified versions of realityto analyze real-world issues.1.4Microeconomics and Macroeconomics(page 15-16)Distinguish between microeconomics and macroeconomics.1.5Economic Skills and Economics as a Career(pages 1617)Describe economics as a career and the key skills you can gain from studying economics.1.6A Preview of Important economic Terms(pages 1719)Define important economic terms.Appendix: Using Graphs and Formulas(pages 2739)Use graphs and formulas to analyze economic situations.Key TermsAllocative efficiency, p. 10. A state of theeconomy in which production is in accordancewith consumer preferences; in particular, everygood or service is produced up to the pointwhere the last unit provides a marginal benefit toconsumers equal to the marginal cost ofproducing it.

Page 12

Solution Manual for Microeconomics, 8th edition - Page 12 preview image

Loading page image...

2CHAPTER 1|Economics: Foundations and ModelsCentrally planned economy, p. 9. An economyin which the government decides how economicresources will be allocated.Economic model, p. 11. A simplified versionof reality used to analyze real-world economicsituations.Economicvariable, p. 12. Somethingmeasurable that can have different values, suchas the number of people employed inmanufacturing.Economics, p. 4. The study of the choicespeople make to attain their goals, given theirscarce resources.Equity, p. 11. The fair distribution of economicbenefits.Macroeconomics, p. 15. The study of theeconomy as a whole, including topics such asinflation, unemployment, and economic growth.Marginal analysis, p. 6. Analysis that involvescomparing marginal benefits and marginal costs.Market, p. 4. A group of buyers and sellers of agood or service and the institution orarrangement by which they come together totrade.Market economy, p. 9. An economy in whichthe decisions of households and firms as theyinteract in markets determine the allocation ofeconomic resources.Microeconomics, p. 15. The study of howhouseholds and firms make choices, how theyinteract in markets, and how the governmentattempts to influence their choices.Mixed economy, p. 10. An economy in whichmost economic decisions result from theinteraction of buyers and sellers in markets butin which the government plays a significant rolein the allocation of resources.Normative analysis, p. 13. Analysis concernedwith what ought to be.Opportunity cost, p. 8. The highest-valuedalternative that must be given up to engage in anactivity.Positive analysis, p. 13. Analysis concernedwith what is.Productive efficiency, p. 10. A situation inwhich a good or service is produced at thelowest possible cost.Scarcity, p. 4. A situation in which unlimitedwants exceed the limited resources available tofulfill those wants.Trade-off, p. 8. The idea that, because ofscarcity, producing more of one good or servicemeans producing less of another good or service.Voluntary exchange, p. 10. A situation thatoccurs in markets when both the buyer and theseller of a product are made better off by thetransaction.Chapter OutlineDoes Apple Manufacture the iPhone in the United States?Although Apple designs the iPhone at its headquarters in Cupertino, California, most iPhones are assembledin China. Many products that were once manufactured in the United States are now manufactured overseas.The Trump administration imposed tariffs onChinese imports in 2019.Tariffs lead to higher prices forimported goods, making it more likely that U.S. and foreign companies will manufacture goods in theUnited States.The Trump administration also hoped that the tariffs would convince other countries toreduce restrictions on U. S. imports. In a market system, firms respond to economic incentives. In in caseof Apple, lower wages earned by Chinese workers reduce the costs of assembling iPhones. Technological

Page 13

Solution Manual for Microeconomics, 8th edition - Page 13 preview image

Loading page image...

CHAPTER 1|Economics: Foundations and Models3progress often creates incentives for firms to change how they produce goods and services.Firms alsorespond to changes in consumer tastes and to changes in government policy. In 2019, many firms awaitedthe outcome of trade negotiations between China and the United Stated before deciding in which countryto expand their operations.Teaching TipsThere are special features in the textbook:1.The introduction, or chapter opener, uses a real-world business example to preview the economic issuesdiscussed in the chapter.2.At the end of each of the first four textbook chapters is a feature titled An Inside Look that consists ofa recent news article plus analysis and questions. The article links back to a topic discussed in thechapter opener. VisitMyLabEconomicsfor additional current An Inside Look news articles.3.A boxed feature titled Economics in Your Life & Career complements the business example that opensthe chapter. Economics in Your Life and Career poses questions that help students make a personalconnection with the chapter theme. At the end of the chapter, the authors use the concepts described inthe chapter to answer these questions.ExtraEconomics in Your Life& Careerfeaturesare included inthe Instructor’s Manual.4.Don’t Let This Happen to You is a box feature that alerts students to common pitfalls covered in thatchapter.5.There are between two and four Analyze the Concept features in each chapter that provide real worldreinforcement of key concepts by citing news stories that focus on business and policy issues.ExtraAnalyze the Concept features appear in the Instructor’s Manual.6.Solved Problems use a step-by-step process for solving economic problems related to a chapter’slearning objectives.ExtraSolved Problems are included in the Instructor’s Manual.7.Real-Time Data Exercises (RTDA) are included with problems at the end of macroeconomics chapters.These problems refer to data and graphs that students will find at the web site of the Federal ReserveBank of St. Louis (FRED). Many RTDA require more elaborate calculations than other problems andthe use of Excel spreadsheets.You can use these features as the basis for classroom discussion, homework assignments, and examinationquestions.People must make choices as they try to attain their goals. The choices people make represent the trade-offs made necessary by scarcity.Scarcityis a situation in which unlimited wants exceed the limitedresources available to fulfill those wants.Economicsis the study of the choices people make to attain theirgoals, given their scarce resources.Teaching TipsStudents will better understand what scarcity means if given examples of things that arenotscarce. Suggestexamples of “free” resourcessand on a beach, fresh air, etc.and ask your students to contribute theirown examples; they will soon realize that the list of free resources is much shorter than the list of scarceresources.

Page 14

Solution Manual for Microeconomics, 8th edition - Page 14 preview image

Loading page image...

4CHAPTER 1|Economics: Foundations and Models1.1Three Key Economic Ideas (pages 47)Learning Objective: Explain these three key economic ideas: People are rational, peoplerespond to economic incentives, andoptimal decisions are made at the margin.Amarketis a group of buyers and sellers of a good or service and the institution or arrangement by whichthey come together to trade.A.People Are RationalRational consumers and firms use all available information as they act to achieve their goals. Although noteveryone behaves rationally all the time, the assumption of rational behavior is useful in explaining mostof the choices people make.B.People Respond to Economic IncentivesEconomists emphasize that individuals and firms consistently respond to economic incentives.C.Optimal Decisions Are Made at the MarginEconomists use the word marginal to mean an extra or additional benefit or cost from making a decision.The optimal decision is to continue any activity to the point where the marginal benefit equals the marginalcost.Marginal analysisis analysis that involves comparing marginal benefits and marginal costs.ExtraSolved Problem 1.1A Doctor Makes a Decision at the MarginA doctor receives complaints from patients that her office isn’t open enough hours. In response, the doctorasks her officemanager to analyze the effect of keeping her office open 9 hours per day rather than 8 hours.The doctor’s office manager tells her: “Keeping the office open an extra hour is a good idea because therevenue from your practice will increase by $300,000 peryear when the office is open 9 hours per day.”Do you agree with the office manager’s reasoning? What, if any, additional information would you need todecide whether the doctor should keep her office open an additional hour per day?Solving the ProblemStep 1:Review the chapter material.This problem is about making decisions, so you may want to review the section “OptimalDecisions Are Made at the Margin” in the textbook.Step 2:Explain whether you agree with the office manager’s reasoning.We have seen that any activity should be continued to the point where the marginal benefit isequal to the marginal cost. In this case, the doctor should keep her office open up to the pointwhere the additional revenue she receives from seeing more patients is equal to the marginalcost of keeping her office open an additional hour. The office manager has providedinformation on marginal revenue but not on marginal cost. The office manager has not providedenough information to make a decision, and you should not agree with the office manager’sreasoning.

Page 15

Solution Manual for Microeconomics, 8th edition - Page 15 preview image

Loading page image...

CHAPTER 1|Economics: Foundations and Models5Step 3:Explain what additional information you need.To make a correct decision, you would need information on the marginal cost of remainingopen an extra hour per day. The marginal cost would include the additional salary to be paid tothe office staff, any additional medical supplies that would be used, as well as any additionalelectricity or other utilities. The doctor would also need to take into account the nonmonetarycost of spending another hour working rather than spending time with her family and friendsor in other leisure activities. The marginal revenue would depend on how many more patientsthe doctor can see in the extra hour. The doctor should keep her office open an additional hourif the marginal revenue of doing so is greater than the marginal cost. If the marginal cost isgreater than themarginal revenue, then the doctor should continue to keep her office open for8 hours.ExtraAnalyzethe ConceptDoes Health Insurance Give People an Incentive to BecomeObese?Obesity is a factor in a variety of diseases, including heart disease, stroke, diabetes,and hypertension,making it a significant health problem in theUnited States. Bodymass index (BMI) is a measurement of aperson’s weight relative to the person’s height.According to the U.S. Centers for Disease Control andPrevention (CDC), an adult witha body mass index (BMI) of 30 or greater is consideredobese. Forexample, a 5'6" adultwith a BMI of 30 is 40 pounds overweight.The following two maps show the dramatic increase in obesity between 1994 and2015. In 1994, in amajority of statesonly between 10 percent and 14 percent of theadult population was obese, and in no statewas more than 20 percent of the adult population obese.By 2015, in every state, at least 20 percent of the adult population was obese, and in 44 states, at least 25percent of the adult population was obese. Many people who suffer from obesity have underlying medicalconditions. For these people, obesity is amedical problem that they cannot control. The fact that obesityhas increased, though, indicates that for some people, obesity is the result of diet and lifestyle choices.Potential explanations for the increase in obesity include greater intake of high-calorie fast foods,insufficient exercise, and a decline in the physicalactivity associated with many jobs. The CDCrecommends that teenagers get a minimum of 60 minutes of aerobic exercise per day, a standard that only15 percent of high school students meet. In 1960, 50 percent of jobs in the United States required at least

Page 16

Solution Manual for Microeconomics, 8th edition - Page 16 preview image

Loading page image...

6CHAPTER 1|Economics: Foundations and Modelsmoderate physical activity. Today, only 20 percent of jobs do. As a result, a typical worker today who maywork at a computer is burning off about 130fewercalories per workday than a worker in the 1960s whowas more likely to have worked in a manufacturing plant.In addition to eating too much and not exercising enough, could having health insurance be a cause ofobesity? Obese people tend to suffer more medical problems and so incur higher medical costs. Obesepeople with health insurance that will reimburse themfor only part of their medical bills, or who have nohealth insurance, must pay some or all of these higher medical bills themselves. People with healthinsurance that covers most of their medical bills will not suffer as large a monetary cost from beingobese.In other words, by reducing some of the costs of obesity, health insurance may givepeople an economicincentive to gain weight.At first glance, this argument may seem implausible. Some people suffer from medical conditions that canmake physical activity difficult or that can cause weight gain even with moderate eating, so they maybecome obese, regardless of which type of healthinsurance they have. The people who are obese becauseof poor eating habits or lack of exercise probably don’t consider health insurance when deciding whetherto have a slice of chocolate cake or to watch Netflix instead of going to the gym. But if economists arecorrect about the importance of economic incentives, then we would expect that if we hold all other personalcharacteristicssuch as age, gender, and incomeconstant, people with health insurance will be morelikely to be overweight than people without health insurance.Jay Bhattacharya and Kate Bundorf of Stanford University, Noemi Pace of the University of Venice, andNeeraj Sood of the University of Southern California, have analyzed the effects of health insurance onweight. Using a sample that followed nearly 80,000people from 1989 to 2004, they found that aftercontrolling for factors including age, gender, income, education, and race, people with health insurancewere significantly more likely to be overweight than people without health insurance. Having private healthinsurance increased BMI by 1.3 points. Having public health insurance, such as Medicaid, which is aprogram under which the government provides health care to low-income people, increased BMI by 2.3points. These findings suggest that people respond to economic incentives even when making decisionsabout what they eat and how much they exercise.Note:The exact formula for the body mass index is BMI = (Weight in pounds/Height in inches2) x 703.Sources:Centers for Disease Control and Prevention, “Prevalence of Self-Reported Obesity among U.S. Adults,”www.cdc. gov;Katherine M. Flegal, Margaret D. Carroll, Cynthia L. Ogden, and Lester R. Curtin, “Prevalence and Trends in Obesity among U.S.Adults, 19992008,”Journal of the American Medical Association, Vol. 303, No. 3, January 20, 2010, pp. 235241; JayBhattacharya, Kate Bundorf, Noemi Pace, and Neeraj Sood, “Does Health Insurance Make You Fat?” in Michael Grossman andNaci H. Mocan, eds.,Economic Aspects of Obesity, Chicago: University of Chicago Press, 2011; and Tara Parker-Pope, “LessActive at Work, Americans Have Packed on Pounds,”New York Times, May 25, 2011.Teaching TipsYou don’t need to spend a lot of class time explaining the material in this section; subsequent chapters willreinforce students’ understanding of markets and the “three key economic ideas.”1.2The Economic Problem That Every Society Must Solve(pages 811)Learning Objective: Discuss how an economy answers these questions: What goods andservices will be produced? How will the goods and services be produced? Who will receivethe goods and services produced?Every society faces the economic problem that it has only a limited amount of economic resources, so itcan produce only a limited amount of goods and services. Every society faces trade-offs. Atrade-offis the

Page 17

Solution Manual for Microeconomics, 8th edition - Page 17 preview image

Loading page image...

CHAPTER 1|Economics: Foundations and Models7idea that, because of scarcity, producing more of one good or service means producing less of another goodor service. Every activity has anopportunity cost: The highest-valued alternative that must be given up toengage in an activity. Trade-offs force society to answer three fundamental questions:1.Whatgoods and services will be produced?2.Howwill the goods and services be produced?3.Whowill receive the goods and services produced?A.What Goods and Services Will Be Produced?The answer to this question is determined by the choices consumers, managers of firms, and governmentpolicymakers make. Each choice made has an opportunity cost.B.How Will the Goods and Services Be Produced?Firms choose how to produce the goods and services they sell. For example, firms often face trade-offsbetween using more workers or more machines.C.Who Will Receive the Goods and Services Produced?In the United States, who receives the goods and services produced depends largely on how income isdistributed. An important policy question is whether the government should intervene to make thedistribution of income more equal.D.Centrally Planned Economies versus Market EconomiesSocieties organize their economies in two main ways. Acentrally planned economyis an economy inwhich the government decides how economic resources will be allocated. Amarket economyis aneconomy in which the decisions of households and firms interacting in markets determine the allocation ofeconomic resources. Today, only North Korea has a completely centrally planned economy. In a marketeconomy, the income of an individual is determined by the payments he or she receives for what he or shesells. Generally, the more extensive the training a person has received and the longer the hours the personworks, the higher his income will be.E.The Modern “Mixed” EconomyThe high rates of unemployment and business bankruptcies during the Great Depression of the 1930s causeda dramatic increase in government intervention in the economy in the United States and other marketeconomies. Some government intervention is designedto raise the incomes of the elderly, the sick, andpeople with limited skills. In recent years, government intervention has expanded to meet goals such asprotection of the environment, promotion of civil rights, and increased access to medical care.Some economists argue that the extent of government intervention makes it more accurate to refer to theeconomies of the United States, Canada, Japan and Western Europe as mixed economies rather than puremarket economies. Amixed economyis an economy in which most economic decisions result from theinteraction of buyers and sellers in markets but in which the government plays a significant role in theallocation of resources.F.Efficiency and EquityMarket economies tend to be more efficient than centrally planned economies. There are two types ofefficiency.Productive efficiencyis a situation in which a good or service is produced at the lowest possiblecost.Allocative efficiencyis a state of the economy in which production is in accordance with consumerpreferences; in particular, every good or service is produced up to the point where the last unit provides amarginal benefit to consumers equal to the marginal cost of producingit.Voluntary exchangeis a situationthat occurs in markets when both the buyer and the seller of a product are made better off by the transaction.

Page 18

Solution Manual for Microeconomics, 8th edition - Page 18 preview image

Loading page image...

8CHAPTER 1|Economics: Foundations and ModelsInefficiency arises from various sources. Sometimes governments reduce efficiency by interfering withvoluntary exchange in markets. The production of some goods damages the environment when firms ignorethe costs of environmental damage. In this case, government intervention can increase efficiency.Society may not find an efficient economic outcome to be desirable. Many people prefer economicoutcomes they consider fair or equitable even if these outcomes are less efficient.Equityis the fairdistribution of economic benefits. There is often a trade-off between efficiency and equity.Teaching TipsAsk students for examples of government regulation of private markets in the United States. Responsesmay include: making the sale of cocaine and other addictive drugs illegal; minimum age requirements forthe purchase of alcoholic beverages and cigarettes; the prohibition of the sale of new drugs before theireffectiveness is demonstrated through government supervised tests. Ask students whether one of theseexamples of government regulation promotes equity or fairness. The difficulty in defining equity will beapparent.To show how students may value equity less than they claim, an economics teacher at a college inWestern New York once told herstudents at the beginning of her course that their grades would beauctioned to the highest bidders. Because grades are usually normally distributed, she offered to sell a fewA grades, a few more B grades, and so on. Although the announcement produced shock and grumbling, theauction proceeded, with frenzied bidding for A grades. As prices for A grades rose, bidding switched to Bgrades. Because few students bothered to bid for C grades, one enterprising student bid on several suchgrades in the belief that those who lost out on getting an A or B would have to buy their C grades fromhimfor a higher price than he paid! After about a week, the instructor informed the class the auction wasintended only as an economics lesson; they would have to earn their grades the old-fashioned way.ExtraSolved Problem 1.2Advising New Government LeadersSuppose a country experiences a change in government leadership. Prior to this change, this country had acentrally planned economy. The new leaders are willing totry a different system if they can be convincedthat it will yield better results. They hire an economist from a country with a market economy to advisethem and will order their citizens to follow the economist’s recommendations for change. The economistsuggests that a market economy replace central planning to answer the nation’s economic questions (what,how, andwho?).What will the economist suggest the leaders order their citizens to do in order to change from a centrallyplanned economy to a market economy?Are there reasons why the leaders of this country might not accept the economist’s suggestions? Brieflyexplain.Solving the ProblemStep 1:Review the chapter material.The problem is about different types of economic systems, so you may want to review thesection “Centrally Planned Economies versus Market Economies” in the textbook.Step 2:What will the economist suggest the leaders order their citizens to do?

Page 19

Solution Manual for Microeconomics, 8th edition - Page 19 preview image

Loading page image...

CHAPTER 1|Economics: Foundations and Models9Market economies allow members of households to select occupations and purchase goods andservices based on self-interest and allow privately owned firms to produce goods and servicesbased on their self-interests. Therefore, the economist would advise theleaders of the countryto not issue any orders. Government officials should have no influence over individualdecisions made in markets.Step 3:Are there reasons why the leaders of this country might not accept the economist’ssuggestions?Even democratically elected leaders may find it difficult to accept the economist’s suggestions.They may wonder how self-interested individuals will produce and distribute goods andservices so as to promote the welfare of the entire country. This new system requires asignificant reduction in government influence in people’s lives, but history has shown that mostgovernment officials are reluctant to give up this influence. Acceptance is most likely when theleaders have some knowledge and experience withthe successful operation of a marketeconomy in other countries. Ordinary citizens are more likely to accept the economist’ssuggestions because they would have more freedom to pursue their own economic goals.ExtraAnalyzethe ConceptIt’s Saturday Afternoon: WhyAren’t You at the Game?For many students, attending college football games is an enjoyable way to spend Saturday afternoons inthe fall. However, some colleges have experienced a decline in the number of students attending theirgames. In 2016,average attendance at the 130 schools that make up the Division I Football BowlSubdivision (43,106)was the lowest since 2000 (42,631).What explains the decrease in the number of students willing to attend football games? Rising ticketprices are one reason for the decline. One student at the University of Michigan was quoted as saying:“People are looking to trim costs, and for a lot offolks, football is an easy thing to cut. It’s not essential togoing to college.”Remember that the opportunity cost of engaging in an activity is the value of the best alternative thatmust be given up to engage in that activity. The opportunity cost of attending a college football game isnotjust the price of a ticket. If the price of a ticket to a game is $50, your opportunity cost is the ticket priceplusthe value you place on what else you could do if you don’t attend the game. At one time, relativelyfew college football games were televised, but today multiple cable networks broadcast games. If you attendyour college’s games, you miss the opportunityto watch the games being broadcast at the same timeinhigh-definition with replays shown from multiple camera angles and expert commentary to clarify what ishappening. When watching games in your room or at a sports restaurant, you can also post to Facebook,Instagram, or Twitter, read e-mail, surf the Web, and take or receive phone calls. Wi-Fi and cellularreception are often poor in college stadiums, making these activities difficult.So the opportunity cost of attending college football games has increased in recent years, not justbecause ticket prices have risen but because the number of alternative activities that students value highlyhas also increased. We expect that when the opportunity cost of engaging in an activity increases, peoplewill engage in that activity less, as we’ve seen with student attendance at college football games.Colleges have responded to declining student attendance by reducing ticket prices, improving Wi-Fiand cellular service, and installing high-definition video boards that show replays as they appear on

Page 20

Solution Manual for Microeconomics, 8th edition - Page 20 preview image

Loading page image...

10CHAPTER 1|Economics: Foundations and Modelstelevision. Whether these attempts to lower the opportunity cost of attending college football games enoughto increase attendance at games remains to be seen.Sources: Jon Solomon, “College Attendance in 2016: Crowds Decline for the Sixth Straight Year,”CBSSports.com, December 16,2016; Adam Rittenberg, “Attendance Challenges Big Deal for B1G,” espn.com, February 14, 2014; and Ben Cohen, “At CollegeFootball Games, Student Sections Likely to Have Empty Seats,”Wall Street Journal, August 27, 2014.1.3Economic Models (pages 1115)Learning Objective: Explain how economists use models to analyze economic events andgovernment policies.Aneconomic modelis simplified version of reality used to analyze real-world situations. To develop amodel, economists generally follow five steps.1.Decide on the assumptions to use.2.Formulate a testable hypothesis.3.Use economic data to test the hypothesis.4.Revise the model if it fails to explain the economic data well.5.Retain the revised model to help answer similar economic questions in the future.A.The Role of Assumptions in Economic ModelsModels are based on making assumptions because models must besimplified to be useful. When usingmodels, economists make behavioral assumptions about the motives of consumers and firms. Economistsassume consumers will buy goods and services that will maximize their satisfaction and firms will act tomaximize theirprofits.B.Forming and Testing Hypotheses in Economic ModelsAneconomic variableis something measurable that can have different values, such as the number ofpeople employed in manufacturing. A hypothesis in an economic model is a statement that may be corrector incorrect about an economic variable. To test a hypothesis, we analyzestatistics on the relevant economicvariables. Economists accept and use an economic model if it leads to hypotheses that are confirmed bystatistical analysis.C.Positive and Normative AnalysisPositive analysisis analysis concerned with what is.Normative analysisis analysis concerned with whatought to be. Economics is about positive analysis, which measures the costs and benefits of different coursesof action.D.Economics as a Social ScienceBecause economics studies the actions of individuals, it is a social science. Economics considers humanbehavior in every context, not just in the context of business. Economists have played an important role informulating government policies in areas such as the environment, health care, and poverty.

Page 21

Solution Manual for Microeconomics, 8th edition - Page 21 preview image

Loading page image...

CHAPTER 1|Economics: Foundations and Models11ExtraSolved Problem 1.3Snowfalls and SkiingMarsha Shawn is a college student and downhill skier who lives near The Ski Chalet, a ski resort locatedin Vermont.For a course project Marsha and four other students are required to develop an economicmodel. Marsha suggests that their model test theimpact of snowfalls on the sale of ski equipment (skis,boots, poles) and snowboards at the six ski shops located within a ten-mile radius of The Ski Chalet.Marsha and the other students in her group agree that to have an impact on equipment sales a snowfallwould have to result in at least four inches of new snow. How would you recommend that Marsha and theother students develop their model? Suggest an alternative model for Marsha in the event that the modelfails to explain the data she uses to test her model.Solving the ProblemStep 1:Review the chapter material.The problem is about how to use models to analyze economic issues, so you may want to reviewthe section “Economic Models” in the textbook.Step 2:To develop and test amodel of the relationship between snowfall and sales of skiequipment the students in Marsha’s group should follow these steps:1.Decide on the assumptions to use in developing the model.For example:sales of skiequipment and snowboards are greater after snowfalls (four or more inches) than are salesat other times during the period that The Ski Chalet is open.2.Formulate a testable hypothesis.Sales of ski equipment and snowboards at the six skishops located near the Ski Chalet are higher (for example, by 5 percent or more) withinone week following snowfalls of four or more inches than other weeks that The Ski Chaletis open.3.Use economic data to test the hypothesis. Marsha’s group must obtain sales data from thesix Vermont ski shops and agree on the number of observations (including the number oftimes a snowfall of at least four inches is observed) required to test the hypothesis.4.Revise the model if it fails to explain the economic data well.Suggest an alternative model.The model could fail if large numbers of skiers and snowboard owners buy their equipmentprior to the months that The Ski Chalet is open, or if large numbers rent, rather thanpurchase, their equipment. One alternative model would compare the sales of lift ticketsor rental equipment in weeks following snowfalls of four or more inches and other weeksduring the time The Ski Chalet is open.5.Retain the revised model to help answer similar economic questions in the future. If thedata support the model, one can assume that there is a relationship between snowfalls andequipment sales. Tests of the model with data from different time periods or in differentlocations could either support or refute these results. Acceptanceof a model is alwaystentative pending the acquisition of new data or additional statistical analysis.1.4Microeconomics and Macroeconomics (page 15-16)Learning Objective: Distinguish between microeconomics and macroeconomics.Microeconomicsis the study of how households and firms make choices, how they interact in markets,and how the government attempts to influence their choices.

Page 22

Solution Manual for Microeconomics, 8th edition - Page 22 preview image

Loading page image...

12CHAPTER 1|Economics: Foundations and ModelsMacroeconomicsis the study of the economy as a whole, including topics such as inflation, unemployment,and economic growth.ExtraSolved Problem 1.4Microeconomic and Macroeconomic ViewsSports fans are used to watching events on television from different camera angles. For popular events suchas the Olympics, the World Series, and the Super Bowl, network coverage captures action from groundlevel as well as higher locations. Blimps are frequently flown above the stadiums and ballparks where theevents take place. The aerial view of the blimp’s camera is visually appealing but is never broadcast forvery long because the athletes are barely visible. Coverage of games includes a view from amobile or“sideline” camera that can zoom in on individual players or fans sitting in the stands, a degree of detailmuch greater than that provided by the aerial view.How do the different camera angles help to explain the difference between microeconomics andmacroeconomics?Solving the ProblemStep 1:Review the chapter material.The problem concerns the differences between microeconomics and macroeconomics, so youmay want to review the section “Microeconomics and Macroeconomics” in thetextbook.Step 2:Compare the focus of microeconomics with television coverage of a sports event.Microeconomics focuses on how individual households and firms make choices, how theyinteract in markets, and how the government attempts to influence their choices. This focus issimilar to that of a sideline camera at a football game.Step 3:Compare the focus of macroeconomics with the television coverage of a sports event.Macroeconomics is the study of the economy as a whole, including topics such as inflation,unemployment, and economic growth. Macroeconomics does not study the decisions made byindividuals but the consequences of actions taken by all decision makers in aneconomy. Thisis similar to the blimp’s aerial view of the venue where a sports event occurs. One can see theentire venue, but the blimp’s point of view is too far away to see any individual player or fan.ExtraAnalyzethe ConceptMacroeconomic and Microeconomic AnalysisEconomists separate the study of how households andfirms make choices and interact in markets(microeconomics) from the study of the economy as a whole (macroeconomics). But some issues can beviewed from both perspectives. Labor productivity is one such issue.Labor productivitythe quantity of goods and services that can be produced by one worker or by one hourof workis a microeconomic topic. Labor productivity increases when a firm invests in capital orexperiences an improvement in technology. Increased labor productivity allows a firm to earn higher profits

Page 23

Solution Manual for Microeconomics, 8th edition - Page 23 preview image

Loading page image...

CHAPTER 1|Economics: Foundations and Models13and pay its workers higher wages. But macroeconomists also study labor productivity because it determinesthe standard of living a country can achieve for its citizens. An increase in productivity is beneficial in thelong run, but it can slow the growth of jobs in the short run. Following the recessions of 2001 and 20072009, many economists were concerned that the unemployment rate did not decrease as quickly as it didfollowing previous recessions. One reason for this was an increase in productivity. TheBureau of LaborStatistics reported that output per hour worked of all persons rose by over 3 percent in both 2009 and 2010.Because workers were more productive, firms did not have to hire new workers to produce the same amountof goods and services. Productivity growth slowed to about 1 percent or less from 2011 to 2014.Some economists attribute the slowdown in productivity growth to a decline in investments in research byU.S. firms from the high levels reached after 1995, which resulted in advancements in computer-relatedapplications. Other economists claim that many recent improvements in productivity escape measurement.Google Inc.’s chief economist Hal Varian has argued that many innovationssuch as apps that can be usedvia cell phones to track locations or hailing taxislead to improvements in productivity “But I doubt thatgets measured anywhere.”Sources: Department of Labor (Bureau of Labor Statistics); andTimothy Aeppel, “Silicon Valley Doesn’t Believe U.S. ProductivityIs Down,”Wall Street Journal, July 16, 2015.1.5Economic Skills and Economics as a Career (pages 1617)Learning Objective: Describe economics as a career and the key skills you can gain fromstudying economics.Economists describe how individuals, businesses and governments make choices and analyze the results ofthese choices.Many businesses, government agencies and non-profit organizations hire economists.Students who consider whether to pursue a career ineconomics may seek an internship with a firm oragency that employs economists.1.6A Preview of Important Economic Terms (pages 1719)Learning Objective: Define important economic terms.This section provides a brief definition and preview of terms students will see throughout the book: firm(company, or business), entrepreneur, innovation, technology, goods, services, revenue, profit, household,factors of production (economic resources or inputs), capital, and human capital.ExtraEconomics in Your Life and Career:Is Cheating a Rational Decision?In their best-selling bookFreakonomics, Steven D. Levitt and Stephen J. Dubner stated: “Who cheats?Well, just about anyone, if the stakes are right…Cheating…is a prominent feature in just about every humanendeavor.” Evidence thatsomepeople cheat surfaced in the summer of 2011 when the superintendent ofthe board of the Atlanta school district resigned after a report documented widespread cheating onstandardized tests that implicated officials from about 80 percent of Atlanta’s elementary and middleschools. In 2015, an Atlanta jury convicted 11 teachers as a result of the cheating scandal.Steven Levitt and other economists assume that decision-makersstudents and non-students alikearerational. They compare the benefits and costs of their options and make choices for which the expectedbenefits exceed the expected costs. The benefits of (successful) cheating may be monetary; for example,

Page 24

Solution Manual for Microeconomics, 8th edition - Page 24 preview image

Loading page image...

14CHAPTER 1|Economics: Foundations and ModelsK-12 teachers in some states are eligible for bonus payments of up to $25,000 if their students perform wellon standardized tests. New technology has made it easier for high school and college students to cheat. Thewidespread use of cell phones and Internet access makes it easier (less costly) to share exam answers andbuy term papers.Sources: Steven D. Levitt and Stephen J. Dubner,FreakonomicsNew York: HarperCollins 2005, pages 2425; Patrik Jonsson,“America’s biggest teacher and principal cheating scandal unfolds in Atlanta,”Christian Science Monitor, July 5, 2011; Mary BethMcCauley, “Atlanta school cheating: When teachers cheat, what do you tell the kids?”Christian Science Monitor, September 5,2013; and Valerie Strauss, “How and Why Convicted Teachers Cheated on Standardized Tests,”Washington Post, April 1, 2015.Question:For the sake of argument, let’s assume that you would never cheat. Under what circumstancesare students in general more or less likely to cheat on an economics examination?Answer:Your economics instructor will be pleased if you would never cheat under any circumstances. Butcheating is more likely when: (a) the positive consequences of receiving a high grade are significant (forexample, a high grade is necessary to maintain a scholarship, gain admittance to medical school, or get agood job offer), and/or (b) the probability of getting caught is low (the instructor gives the same multiple-choice exam to all students in a large classroom with no supervision). Reducing the benefit and increasingthe cost of getting caught will reduce the incidence of cheating. If appeals to personal integrity are notenough to convince students not to cheat, a more effective deterrent may be for potential employers to letstudents know that they firedishonest employees.AppendixUsing Graphs and Formulas (pages 2739)Learning Objective: Use graphs and formulas to analyze economic situations.Graphs simplify economic ideas and make the ideas more concrete so they can be applied to real-worldproblems.Graphs of One VariableFigure 1A.1 in the textbook displaysexamples of two common types of graphs: bar graphs and pie charts.The height of the bars in the bar graph represents the market shares of automobile firms. The pie chartshows the same information with the market shares of each group of firms representedby the size of itsslice of the pie. Information on economic variables can also be displayed in time-series graphs. These graphsare displayed on a coordinate grid. The vertical axis (y-axis) of a coordinate grid measures the value of onevariable. The point where the vertical axis intersects the horizontal axis is the origin. The horizontal axis ofa coordinate grid measures the value of another variable. The points in a coordinate gridrepresent the valuesof the two variables. Figure 1A.2 illustrates examples of time-series graphs.Graphs of Two VariablesWe often use graphs to show the relationship between two variables. Figure 1A.3 illustrates the graph of alinear or straight-line demand curve where price is measured along the vertical axis and quantity is measuredalong the horizontal axis.A.Slopes of LinesThe slope of a straight line indicates how much the variable measured along they-axis changes as thevariable measured along thex-axis changes. Slope can be measured between any two points on the linebecause the slope of a straight line has a constant value. The slope can be expressed as the change in the

Page 25

Solution Manual for Microeconomics, 8th edition - Page 25 preview image

Loading page image...

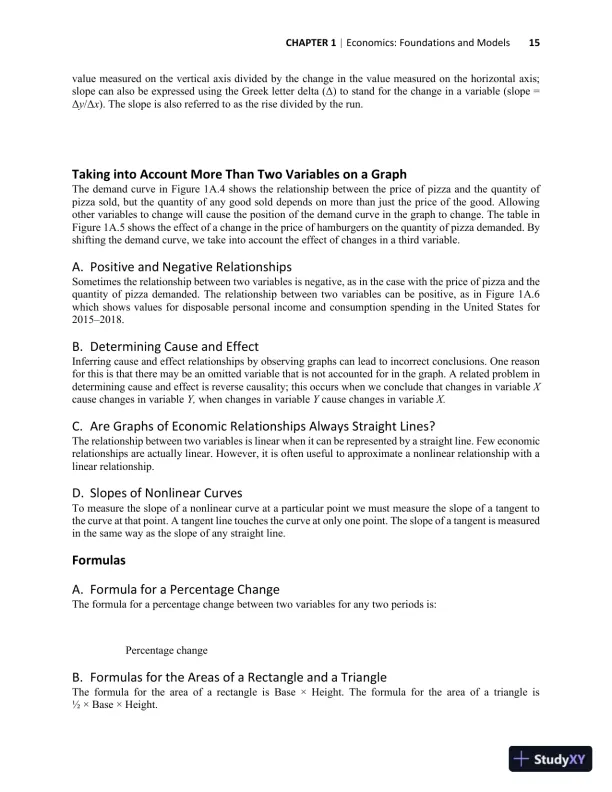
CHAPTER 1|Economics: Foundations and Models15value measured on the vertical axis divided by the change in the value measured on the horizontal axis;slope can also be expressed using the Greek letter delta (Δ) to stand for the change in a variable (slope =Δyx). The slope is also referred to as the rise divided by the run.Taking into Account More Than Two Variables on a GraphThe demand curve in Figure 1A.4 shows the relationship between the price of pizza and the quantity ofpizza sold, but the quantity of any good sold depends on more than just the price of the good. Allowingother variables to change will cause the positionof the demand curve in the graph to change. The table inFigure 1A.5 shows the effect of a change in the price of hamburgers on the quantity of pizza demanded. Byshifting the demand curve, we take into account the effect of changes in a third variable.A.Positive and Negative RelationshipsSometimes the relationship between two variables is negative, as in the case with the price of pizza and thequantity of pizza demanded. The relationship between two variables can be positive, as in Figure 1A.6which shows values for disposable personal income and consumption spending in the United States for20152018.B.Determining Cause and EffectInferring cause and effect relationships by observing graphs can lead to incorrect conclusions. One reasonfor this is that there may be an omitted variable that is not accounted for in the graph. A related problem indetermining cause and effect is reverse causality; this occurs when we conclude that changes in variableXcause changes in variableY,when changes in variableYcause changes in variableX.C.Are Graphs of Economic Relationships Always Straight Lines?The relationship between two variables is linear when it can be represented by a straight line. Few economicrelationships are actually linear. However, it is often useful to approximate a nonlinear relationship with alinear relationship.D.Slopes of Nonlinear CurvesTo measure the slope of a nonlinear curve at a particular point we must measure the slope of a tangent tothe curve at that point. A tangent line touches the curve at only one point. The slope of a tangent is measuredin the same way as the slope of any straight line.FormulasA.Formula for a Percentage ChangeThe formula for a percentage change between two variables for any two periods is:Percentage changeB.Formulas for the Areas of a Rectangle and a TriangleThe formula for the area of a rectangle is Base × Height. The formula for the area of a triangle is½ × Base × Height.

Page 26

Solution Manual for Microeconomics, 8th edition - Page 26 preview image

Loading page image...

16CHAPTER 1|Economics: Foundations and ModelsC.Summary of Using FormulasFollow these steps when using a formula:1.Make sure you understand the economic concept theformula represents.2.Make sure you are using the correct formula for the problem you are solving.3.Make sure the number you calculate using the formula is economically reasonable.Teaching TipsYou can assign the appendix as “on your own”reading. But don’t assume students will understand theformulas for computing a slope or a percentage change. Reviewing these formulas in class will be time wellspent, either at this point in the course or when these formulas are first applied. In particular, students willneed to use graphs of two variables and percentage changes often throughout the remainder of the text.Solutions to End-of-Chapter ExercisesAnswers toThinking CriticallyQuestions1.A tariff is a tax on imports. When a 25 percent tariff is imposed on imports from China, U.S. firms thatimport goods from China must pay the U.S. government an amount equal to 25 percent of the price ofthe imported goods. These U.S. firms will likely have to increase the price they sell the importedChinese-made goods for, which will reduce the sales of the goods in the United States. If these productswere manufactured in the United States, then, of course there would be no tariff. The imposition of thetariff would therefore become an economic incentive for U.S. companies to return manufacturing jobsfrom China to the United States. For some firms, the incentive might not be enough to offset other costadvantages from producing goods in China.2.Positive analysis is concerned withwhat is, while normative analysis is concerned withwhat ought tobe. Positive economic analysis of the statement could show (1) whether the tariffs are actuallyincreasing the number of manufacturing jobs in the United States or whether other factors are alsoresponsible for some of the job creation, and (2) whether increasing the tariffs would likely continue toincrease the number of manufacturing jobs and whether those increases would cause other job losses(for example, if the tariffs resulted in a company like Apple having to charge higher prices forsmartphones and therefore hire fewer workers in the United States). In other words, the tariffs couldresult in both winners and losers in terms of domestic employment.Should the gains to the winners from increasing tariffs be valued more than the losses to the losers?The answer to this question involves normative analysis. Positive analysis can show the consequencesof a particular policy such as implementing tariffs,but positive analysis cannot determine whether sucha policy is a “good” or “bad” idea. Whether you agree or disagree with the statement, you are makinga value judgment or a normative statement rather than drawing a conclusion from positive analysis.

Page 27

Solution Manual for Microeconomics, 8th edition - Page 27 preview image

Loading page image...

CHAPTER 1|Economics: Foundations and Models171.1Three Key Economic IdeasLearning Objective: Explain these three key economic ideas: People are rational, peoplerespond to economic incentives, and optimal decisions are made at the margin.Review Questions1.1“People are rational” is the assumption that decision makers explicitly or implicitly weigh thebenefits and costs of each action and then choose an action only if the benefits are expected tooutweigh the costs. “People respond to economic incentives” bychanging their behavior inresponse to an economic incentive. For example, if the federal government begins to tax firms anamount equal to government benefits their low-wage employees receive, firms are likely to hirefewer low-wage workers. “Optimal decisions are made at the margin” means that most decisionsare not “all or nothing,” but involve doing a little more or a little less of an activity. Therefore, theoptimal decision is to continue any activity up to the point where the marginal benefit equalsthemarginal cost.1.2Scarcity is the situation in which unlimited wants exceed the limited resources available to fulfillthose wants. Economics is the study of the choices consumers, business managers, and governmentofficials make to attain their goals. Scarcity is centralto economics because scarcity requires peopleto make choices about how to use their resources to best fulfill their wants. In making choices, wemust give up other opportunities that we value. What we give up (our second-best choice) is calledthe opportunity cost of our choice.Problems and Applications1.3Economists assume that people are rational in the sense that they use all available information asthey act to achieve their goals. Rational individuals weigh the benefits and costs of each action, andthey choose an action only if the benefits outweigh the costs. Economists do not assume everyoneis a genius or always makes the “right” decision in every circumstance; rather, economists assumethat the actions of consumers and businesses reflect their attempts to achieve their goals.1.4We need information on the losses the typical bank suffers from a robbery and the cost of installinga bandit barrier or taking other actions, such as hiring a guard, to deter a robbery. The cost ofinstalling a bandit barrier would include the cost of potentially losing customers who find banditbarriers off-putting. The fact that not many banks install bandit barriers indicates that these bankshave found that the marginal cost of adding the additional security is greater than the expectedmarginal benefit from reducing the expected number of robberies.1.5a.Students face a scarcity of time, like everyone else, and respond to the incentives of theteacher’s grading system. Students have more incentive to put their efforts into the parts of thecourse that have the most weight in the grading system.b.If teachers put too little weight in the grading scale on outside readings, or similar assignments,students will have little incentive to read and master the material. Students will put less effortinto the parts of the course that have little effect on their grades.c.Quizzes on assigned readings would give students an incentive to come to class having readthe upcoming material. Some teachers give preparation assignments where students have toread and answer questions about the upcoming material, and over the course of the semesterstudents have to successfully complete a certain percentage of the preparation assignments toqualify for an A, B, or other grade in the course.

Page 28

Solution Manual for Microeconomics, 8th edition - Page 28 preview image

Loading page image...

18CHAPTER 1|Economics: Foundations and Models1.6a.As a result of changes in the federal student loan programs the total amount students borrowshould increase. The changes increase the incentive students have to borrow money under theprograms because they limit the amount of the loans that must be repaid.b.If in 2016 President Obama was recommending further changes to the student loan program,then it’s likely that the 2011 changes to the program had results that were not expected. Themost likely unexpected result is that because the 2011 changes requiredstudents to pay backless, students were borrowing more money than the president and his advisers had anticipated.So, in 2016, it’s likely that President Obama recommended changes that would increase theloan repayments borrowers would have to make.c.President Obama and his advisers may have failed to take into account that the 2011 changesto the program changed the incentives students faced. Because the incentive to increase theamount borrowed increased, President Obama and his advisers underestimated the increase inthe amount the federal government would have to pay in loan subsidies.1.7a.Employees who have health problems incur higher medical costs than healthier employees.The higher medical costs increase the health insurance premiums that firms must payfor employer-provided health insurance, which raises the firms’ costs. These highercostsprovide an incentive for universities and corporations to encourage employees to improve andmaintain their health.b.Health insurance decreases the incentive of employees to improve or maintain their health,because employees with health insurance do not pay the full cost of their medical bills.c.A wellness program, if successful, would decrease the premiums that an insurance companywould charge. Healthier employees would have fewer health problems that would be coveredby a university’s or a corporation’s insurance plan.1.8a.As stated inthe text, under the act, firms whose employees received assistance fromgovernment benefits, including Medicaid and the Supplemental Nutrition Assistance Program(SNAP), would be required to pay a tax equal to cost of the assistance.b.Firms that might otherwise have hired a low-wage worker may now be reluctant to do sobecause the firms could be liable for paying the tax. In effect, the act would raise the cost ofemploying low-income workers who receive government benefits.c.The sponsors of the legislation may have hoped that firms would raise the wages of low-incomeworkers, which would make it unnecessary for these workers to apply for government benefits.The sponsors may also have intended to call attention to the low wages being paid to someworkers and may not have expected that the act would actually become law.1.9By “incremental revenue” and “incremental cost,” the author means marginal revenue and marginalcost.“Incremental” means the same thing as “marginal.”The USPS’s total cost includes suchthings as the cost of purchasing delivery trucks and the cost of maintaining post office buildingsand warehouses that are not affected by the number of packages that the USPS delivers. Indetermining whether delivering packages for Amazon will increase its overall profit or reduce itsoverall loss, the USPS should lookonly at the marginal (or incremental or additional) revenue andmarginal cost of delivering packages for Amazon. If the marginal revenue exceeds the marginalcost, the USPS’s profit will increase (or its loss will decrease). If the marginal cost exceeds themarginal revenue, the USPS’s profit will decrease (or its loss will increase).1.10Your friend is failing to think at the margin. It doesn’t matter how much time your friend hasalready spent studying psychology. What matters is the marginal benefit to be received from

Page 29

Solution Manual for Microeconomics, 8th edition - Page 29 preview image

Loading page image...

CHAPTER 1|Economics: Foundations and Models19studying psychology relative to the marginal cost, where cost is the opportunity cost of lower gradesin other subjects. If the course is required, that may raise the marginal benefit.1.11A complete explanation for the connection between majoring in economics and success in businesswould involve many factors. But we can say that economics teaches us how to look at the trade-offs involved in every decision we make. Those who do not make decisions by weighing the costsof an action against its benefits are unlikely to make good decisions. Climbing the corporate orgovernmental ladder requires making a wider and wider array of decisions.1.2The Economic Problem That Every Society Must SolveLearning Objective: Discuss how an economy answers these questions: What goods andservices will be produced? How will the goods and services be produced? Who will receivethe goods and services produced?Review Questions2.1Scarcity implies thatevery society and every individual faces trade-offs because wants areunlimited but the ability to satisfy those wants is limited. Societies and individuals cannot haveeverything they want, so they have to make choices of what to have and what not to have.2.2The three economic questions that every society must answer are (1) What goods and services willbe produced? (2) How will the goods and services be produced? (3) Who will receive the goodsand services produced? In a centrally plannedeconomy, the government makes most of thesedecisions. In a pure market economy, almost all of these decisions are made by the decentralizedinteraction of households and firms in markets. In a mixed economy, most economic decisionsresult from the interaction of buyers and sellers in markets, but government may play a significantrole in the allocation of resources.2.3Productive efficiency occurs when a good or service is produced at the lowest possible cost.Allocative efficiency means that what is produced reflects consumer preferencesevery good orservice is produced up to the point at which the last unit providesa marginal benefit to consumersequal to the marginal cost of producing it.2.4Efficiency is concerned with producing the goods and services that people want at the lowest cost.Equity is “fairness,” a concept that can differ from person to person. Government policymakersoften want to make economic outcomes“fairer,” but doing so usuallyinvolves redistributingincome from one group to another. Redistributing income often (but not always) hampers efficiencybecause it reduces incentives to produce and drives up production costs.Problems and Applications2.5Yes, even Jeff Bezos faces scarcity because his wants exceed his resources. Bezos has establisheda foundation to help homeless families and to establish pre-schools in low-income areas. There arean unlimited number of other worthy causes that Bezos could fund, so even he faces scarcity.Further, even Bezos has only 24 hours in a day, so he must make choices about how to spend hisscarce time. Everyone faces scarcity because human desires are virtually unlimited. Your resourcesare limited, so the only way not to face scarcity would be to reduce your wants to be no greaterthan your resourcesnot something that most people are capable of doing!2.6Spending resources in a way that helps only one poor person is likely to be an ineffective way ofhelping poor people. How many poor people could be helped by using another method of helping

Page 30

Solution Manual for Microeconomics, 8th edition - Page 30 preview image

Loading page image...

20CHAPTER 1|Economics: Foundations and Modelsthe poor? The opportunity cost of using one method is the number of poor people that could behelped by using the best available alternative method.2.7Although many factors that affect the opportunity cost of attending college football games havechanged over time, some of the most significant changes during the past decade involve technology.For example, more games are televised, games can be viewedonline with enhanced features, andalternative sources of entertainment, such as streaming television shows and movies or interactingwith friends on social media, have also become available. These changes increase the opportunitycost of watching football games in person and help to explain the decline in attendance over time.2.8Allocative efficiency occurs when production is in accordance with consumer preferences.Productive efficiencyoccurs when a good or service is produced at the lowest possible cost. Profitisthe incentive for a firm in a market economy to be allocatively efficient and productivelyefficient. If a firm is not allocatively efficient and productively efficient, then it will eventuallysuffer losses and go out of business.2.9Productive efficiency refers to a situation in which a good or service is produced at the lowestpossible cost. Allocative efficiency is a state in which production is in accordance with consumerpreferences: Every good or service is produced up to the point where the last unit provides amarginal benefit to society equal to the marginal cost of producing it. The test that Alberto Chongand his colleagues carried out was not designed to measure how much it would cost to send andreturn letters in various countries, but how oftenand how quicklythe letters sent were returned.Each envelope mailed contained one page to limit the possibility that curious postal employeeswould be tempted to open the envelope to steal the contents. Written on each envelope wasa requestto “please return to sender if undeliverable.” Therefore, it was likely that the letter would either bereturned or discarded. Because the experiment was testing which postal services were best atproperly handling consumers’ letters, it is better viewed as an evaluation of allocative efficiencyrather than productive efficiency.2.10Although the federal government’s Food and Drug Administration (FDA) must approve a drug ormedical device before it is offered for sale, privately owned firms produce and sell these products.It would be more accurate to view markets for drugs and medicaldevices as characteristic of amixed economy: an economy in which most economic decisions result from the interaction ofbuyers and sellers in markets but one in which the government plays a significant role in theallocation of resources.2.11As discussed in the chapter, equity, or the fair distribution of benefits, can be difficult to define.For some people, equity means a moreequaldistribution of income than would result from anemphasis on efficiency alone. Raising taxes on people with higher incomes to provide the fundsfor programs that aid the poor might increase equity, but may reduce the economic incentive towork hard, startnew businesses, and save. Reducing these activities will reduce economicefficiency, which illustrates the trade-off between equality and efficiency. An economist can writean entire book on the subject because equality can be difficult to define and because it can bedifficult to measure the extent to which efforts to promote equality can reduce efficiency. The trade-off involves complicated normative and positive issues.2.12If all of an economic system’s resources were devoted to providing health care, there would beother important goods and services, such as food, housing, clothing, and education that theeconomy could notprovide. An economic system that provided its citizens with state-of-the-arthealth care but so little food that most were on the verge of starvation, no housing so that manywere sleeping in streets and fields, and no schooling so most people were illiterate, would generallybe regarded as inefficientand treating the population unfairly by depriving them of such importantgoods and services. A market economy restricts access to health care, just as it restricts access to

Page 31

Solution Manual for Microeconomics, 8th edition - Page 31 preview image

Loading page image...

CHAPTER 1|Economics: Foundations and Models21all goods and services, by charging a price at which less than an unlimited quantity of health careis demanded.2.13a.The groups of students most likely to get the tickets will be those for whom the expectedmarginal benefit of going to the athletic department office on Monday morning is greater thanthe expected marginal cost. These would include students who have a relatively lowopportunity cost of their time, such as those who have no Monday morning classes. Otherstudents who are likely to stand in line are those who would have a large benefit from havingthe tickets: Those who love football and those who hope to sell their tickets (“scalpers”).b.The major opportunity cost of distributing the tickets this way is the cost to those students whoattempt to get the tickets, such as: The activities the students can’t do while standing in line,andthe costs to students who stand in line but find that all the tickets are sold before their turncomes. There’s also the cost of the lost revenue to the college from giving away the ticketsinstead of selling them.c.This isn’t an efficient way todistribute the tickets because of the high cost in wasted time. Itwould be more efficient to sell the tickets to those willing to pay the highest pricesd.Equity is hard to define. Some people will see this way of distributing tickets as equitablebecause students with low incomes can still get tickets, provided they are willing to pay theopportunity cost of waiting in line. Some people will see this way of distributing the tickets asequitable because only those with the greatest desire to watch the game in person will put upwith the hassle of getting the tickets. Some people might argue that this system is equitablebecause students are more deserving than nonstudent recipients of the tickets. Others maydisagree, saying that students with a strong desire to obtain the tickets, but who are unable tobe at the athletic department office at the designated time, would have no chance to get thetickets. Stillothers could argue that the system was not equitable because this way ofdistributing tickets generates no revenue for the athletic department, which could use therevenue to cover some of the costs of administering the college’s athletic programs.1.3Economic ModelsLearning Objective: Explain how economists use models to analyze economicevents andgovernment policies.Review Questions3.1Economists use models for the same reason that other scientists doto make a complicated worldsimple enough that problems can be understood and analyzed and questions can be accuratelyanswered. Useful models will generate testable predictions. If these predictions are consistent witheconomic data, the model isn’t rejected and can be used to understand the economy. Testing modelswith data can be very difficult, however, because the economy is always changing, and it is difficultto conduct controlled economic experiments.3.2Economists can create a useful model by following these five steps: (1) decide the assumptions tobe used; (2) formulate a testable hypothesis; (3) use economic data to test the hypothesis;(4) revise the model if it fails to explain the economic data well; and (5) retain the revised modelto help answer similar economic questions in the future.3.3Positive economic analysis is concerned with whatis; that is, it deals with how the economyactually behaves. Normative economic analysis is concerned with whatought to be. Economics is
Preview Mode

This document has 479 pages. Sign in to access the full document!

Study Now!

XY-Copilot AI
Unlimited Access
Secure Payment
Instant Access
24/7 Support
Document Chat

Related Documents

View all