Statistical Techniques in Business and Economics, 17th Edition Solution Manual

Statistical Techniques in Business and Economics, 17th Edition Solution Manual provides expertly crafted summaries and insights to boost retention.

Sophia Johnson
Contributor
4.7
55
5 months ago
Preview (16 of 307 Pages)
100%
Purchase to unlock

Page 1

Statistical Techniques in Business and Economics, 17th Edition Solution Manual - Page 1 preview image

Loading page image...

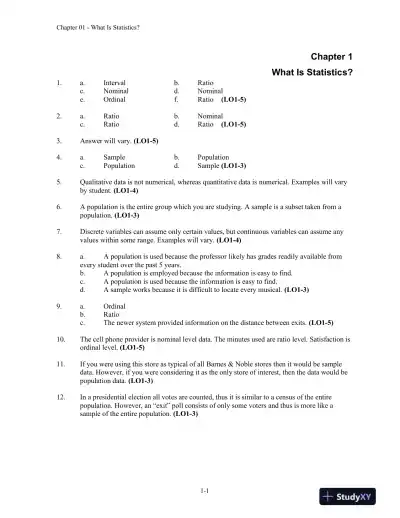
Chapter 01-What Is Statistics?1-1Chapter 1WhatIs Statistics?1.a.Intervalb.Ratioc.Nominald.Nominale.Ordinalf.Ratio(LO1-5)2.a.Ratiob.Nominalc.Ratiod.Ratio(LO1-5)3.Answer will vary.(LO1-5)4.a.Sampleb.Populationc.Populationd.Sample(LO1-3)5.Qualitative data is not numerical, whereas quantitative data is numerical. Examples will varyby student.(LO1-4)6.A population is the entire group which you are studying. A sample is a subset taken from apopulation.(LO1-3)7.Discrete variables can assume only certain values, but continuous variables can assume anyvalues within some range. Examples will vary.(LO1-4)8.a.Apopulation is used because the professor likely has grades readily available fromevery student over the past 5 years.b.A population is employed because the information is easy to find.c.A population is used because the information is easy to find.d.A sample works because it is difficult to locate every musical.(LO1-3)9.a.Ordinalb.Ratioc.The newer system provided information on the distance between exits.(LO1-5)10.The cell phone provider is nominal level data. The minutes used are ratio level. Satisfaction isordinal level.(LO1-5)11.If you were using this store as typical of all Barnes & Noble stores then it would be sampledata.However, if you were considering it as the only store of interest, then the data would bepopulation data.(LO1-3)12.In a presidential election all votes are counted, thus it is similar to a census of the entirepopulation.However, an “exit” poll consists of only some voters and thus is more like asample of the entire population.(LO1-3)

Page 2

Statistical Techniques in Business and Economics, 17th Edition Solution Manual - Page 2 preview image

Loading page image...

Page 3

Statistical Techniques in Business and Economics, 17th Edition Solution Manual - Page 3 preview image

Loading page image...

Chapter 01-What Is Statistics?1-213.DiscreteContinuousQualitativeb. Genderd. Soft drink preferenceg. Student rank in classh. Rating of a finance professorQuantitativec. Sales volume of MP3 playersf. SAT scoresi. Number of home computersa. Salarye. TemperatureDiscreteContinuousNominalb. GenderOrdinald. Soft drink preferenceg. Student rank in classh. Rating of a finance professorIntervalf. SAT scorese. TemperatureRatioc. Sales volume of MP3 playersi. Number of home computersa. Salary(LO1-4 and LO1-5)14.Answers will vary.(LO1-5)15.As a result of these sample findings, we can conclude that 120/300 or 40% of the white-collarworkers would transfer outside the U.S.(LO1-3)16.The obvious majority of consumers (400/500, or 80%) believe the policy is fair. On thestrength of thesefindings, we can anticipate a similar proportion of all customers to feel thesame.(LO1-3)

Page 4

Statistical Techniques in Business and Economics, 17th Edition Solution Manual - Page 4 preview image

Loading page image...

Chapter 01-What Is Statistics?1-317.a.ManufacturerDifferenceGeneral Motors Corp.128,133Chrysler126,955Ford Motor Company112,975Toyota Motor Sales USA Inc.96,078Nissan North America Inc.72,146Subaru of America Inc.61,834American Honda Motor Co Inc.38,440Kia Motors America Inc.36,313Hyundai Motor America30,656Mercedes-Benz20,187Audi of America Inc.18,970Mitsubishi Motors N A, Inc.16,119Land Rover13,535BMW of North America Inc.12,202Mazda Motor of America Inc.7,407Volvo5,980Mini4573Porsche Cars NA Inc.4,337Tesla1,850Lamborghini372Ferrari164Rolls Royce19Bentley-351Jaguar-633Maserati-783Smart-2,512Fiat-3,650Volkswagen of America Inc.-6,585

Page 5

Statistical Techniques in Business and Economics, 17th Edition Solution Manual - Page 5 preview image

Loading page image...

Chapter 01-What Is Statistics?1-4b.Percentage differences with top five and bottom five.Manufacturer% change from2014Lamborghini75%Land Rover32%Mitsubishi Motors N A, Inc.25%Subaru of America Inc.15%Audi of America Inc.13%Volvo13%Tesla12%Porsche Cars NA Inc.11%Mini10%Ferrari9%Chrysler8%Kia Motors America Inc.7%Mercedes-Benz7%Nissan North America Inc.6%Ford Motor Company5%General Motors Corp.5%Hyundai Motor America5%Toyota Motor Sales USA Inc.5%BMW of North America Inc.5%American Honda Motor Co Inc.3%Mazda Motor of America Inc.3%Rolls Royce3%Volkswagen of America Inc.-2%Jaguar-5%Maserati-8%Fiat-9%Bentley-15%Smart-29%

Page 6

Statistical Techniques in Business and Economics, 17th Edition Solution Manual - Page 6 preview image

Loading page image...

Chapter 01-What Is Statistics?1-5c.(LO1-2)18.The total amount spent is $603.86.The percents by group are: 75, 14, 4, and 7, respectively.(LO1-2)

Page 7

Statistical Techniques in Business and Economics, 17th Edition Solution Manual - Page 7 preview image

Loading page image...

Chapter 01-What Is Statistics?1-619.Earnings increase about $3 billion per year over the period. However 2008 sees a very largeincrease and 2009 sees a large decrease.Perhaps the earnings were affected by the financial “collapse” during the years 2008-2010.Perhaps $15 billion of 2008 earnings were somehow “advanced” from the next year or two?(LO1-2)20.a. Qualitative variables: Pool, Garage, Township, Mortgage type, DefaultQuantitative variables: Price, Bedrooms, Size, Baths, FICO Years(LO1-4)b. Price measured in dollars: Continuous, Ratio scaleAgent: NominalBedrooms are counted: Discrete, Ordinal??? Ratio scaleSize measured in area of square feet: Contiguous, Ratio scalePool measured as present or not: nominalGarage measured as present or not: nominalBaths are counted: Discrete, Ordinal?? Ratio scaleTownship is labeled: nominalMortgage type measures as adjustable or fixed: nominalFICO is an index of a person’s ability to pay their bills: ratioYears are counted: ordinalDefault: measured as yes or no: nominal(LO1-5)21.a.League is a qualitative variable; the others are quantitative.(LO1-4)b.League is a nominal level variable; the others are ratio level variables.(LO1-5)22.a.Bus Number,Manufacturer, and engine typeare qualitative variables, the others arequantitative.(LO1-4)b.Bus Number,Manufacturer, and EngineType nominal level variables; the others areratio level variables.(LO1-5)

Page 8

Statistical Techniques in Business and Economics, 17th Edition Solution Manual - Page 8 preview image

Loading page image...

Chapter 02-Describing Data: FrequencyTables,FrequencyDistributions, and Graphic Presentation2-1Chapter 2Describing Data:FrequencyTables, FrequencyDistributions,andGraphic Presentation1.Pepsi-Cola has a 25% market share, found by 90/360.(LO2-2)2.Three classes are needed, one for each player.(LO2-1)3.SeasonFrequencyRelative FrequencyWinter1000.1Spring3000.3Summer4000.4Fall2000.2Total10001.0(LO2-1)4.CityFrequencyRelative FrequencyIndianapolis1000.05St. Louis4500.225Chicago13000.65Milwaukee1500.075(LO2-1)5.a. A frequency table.ColorFrequencyRelative FrequencyBright White1300.10Metallic Black1040.08Magnetic lime3250.25Tangerine Orange4550.35Fusion Red2860.22Total13001.00b.

Page 9

Statistical Techniques in Business and Economics, 17th Edition Solution Manual - Page 9 preview image

Loading page image...

Chapter 02-Describing Data: FrequencyTables,FrequencyDistributions, and Graphic Presentation2-2

Page 10

Statistical Techniques in Business and Economics, 17th Edition Solution Manual - Page 10 preview image

Loading page image...

Chapter 02-Describing Data: FrequencyTables,FrequencyDistributions, and Graphic Presentation2-3c.d.Wellstone Inc. should produce350,000 orange; 250,000 lime; 220,000 red; 100,000 white,and 80,000 black. These numbers arefound by multiplyingtherelative frequencyof eachcolorbythe1,000,000 productionlevel.(LO2-2)6.Maxwell Heating & Air Conditioning far exceeds the other corporations in sales. Mancellelectric & Plumbing and Mizelle Roofing & Sheet Metal are the two corporations with theleast amount of fourth quarter sales.(LO2-2)MizelleMaxwellMancellLong BayJ & RHoden2500020000150001000050000CorporationSalesChart of Sales7.25= 32 < 38 < 64 = 26therefore6 classes(LO2-3)8.25= 32< 45 < 64 = 26suggests 6 classes.$29$04.476iUse interval of 5.(LO2-3)9.27= 128< 230 < 256 =28suggests 8 classes56723541.58iUse interval of 45.(LO2-3)

Page 11

Statistical Techniques in Business and Economics, 17th Edition Solution Manual - Page 11 preview image

Loading page image...

Chapter 02-Describing Data: FrequencyTables,FrequencyDistributions, and Graphic Presentation2-410.a.25= 32< 53 < 64 = 26suggests6 classes.b.1294214.56iUse interval of 15 and start first class at 40.(LO2-3)

Page 12

Statistical Techniques in Business and Economics, 17th Edition Solution Manual - Page 12 preview image

Loading page image...

Chapter 02-Describing Data: FrequencyTables,FrequencyDistributions, and Graphic Presentation2-511.a.24=16 suggests 5 classesb.31251.25iUse interval of 1.5c.24d.fRelative frequency24 up to 25.520.12525.5 up to 2740.25027 up to 28.580.50028.5 up to 3000.00030 up to 31.520.125Total161.000e.The number of units produced in the past 16 days range between 24 and 31 units.The largest concentration is in the 27 up to 28.5 class (8).(LO2-3)12.a.24= 16< 20 < 32 =25suggest 5 classesb.98519.45iUse interval of 10.c.50d.fRelative frequency50 up to 6040.2060 up to 7050.2570 up to 8060.3080 up to 9020.1090 up to 10030.15Total201.00e.The fewest number is about 50, the highest about 100. The greatest concentration is inclasses 60 up to 70 and 70 up to 80.(LO2-3)Visitsf13.a.0 up to 393 up to 6216 up to 9139 up to 12412 up to 15315 up to 181Total51b.The largest group of shoppers (21) shop at BiLo 3, 4 or 5 times during a month period.Some customers visit the store only 1 time during the month, but others shop as manyas 15 times.c.Number ofPercent ofVisitsTotal0 up to 317.653 up to 641.186 up to 925.499 up to 127.8412 up to 155.8815 up to 181.96Total100.00(LO2-3)

Page 13

Statistical Techniques in Business and Economics, 17th Edition Solution Manual - Page 13 preview image

Loading page image...

Chapter 02-Describing Data: FrequencyTables,FrequencyDistributions, and Graphic Presentation2-614.a.The 2krule would suggest 6 classes as 25= 32 < 40 < 64 = 26. With six classes theinterval would be larger than (8418) / 6 = 11, but as we are summarizing moneyobservations a classinterval of 10 is more convenient to work with.Thefrequencydistribution using 10 is:f15 up to 25125 up to 35235 up to 45545 up to 551055 up to 651565 up to 75475 up to 853Total40b.Data tends to cluster in classes 45 up to 55 and 55 up to 65.c.Based on the distribution, the youngest person taking the Caribbean cruise is 15 years(actually 18 from the raw data). The oldest person was less than 85 years(actually 84from the raw data). The largest concentration of ages is between 45 up to 65 years.d.AgesPercent ofTotal15 up to 252.525 up to 355.035 up to 4512.545 up to 5525.055 up to 6537.565 up to 7510.075 up to 857.5Total100.0(LO2-3)15.a.Histogramb.100c.5d.28e.0.28f.12.5g.13(LO2-4)16.a.3b.about 26c.2d.frequency polygon(LO2-4)

Page 14

Statistical Techniques in Business and Economics, 17th Edition Solution Manual - Page 14 preview image

Loading page image...

Chapter 02-Describing Data: FrequencyTables,FrequencyDistributions, and Graphic Presentation2-717.a.50b.1.5 thousandfrequent fliermilesc.d.X = 1.5, Y = 5e.f.For the 50 employees about half earn between 6 and9thousand frequent flier miles.Five earn less than 3 thousand frequent flier miles, and two earn more than 12thousand frequent flier miles.(LO2-4)18.a.40b.2.5daysc.2.5,6d.

Page 15

Statistical Techniques in Business and Economics, 17th Edition Solution Manual - Page 15 preview image

Loading page image...

Chapter 02-Describing Data: FrequencyTables,FrequencyDistributions, and Graphic Presentation2-8d.e.e.f.Based on the charts, the shortest lead time is 0 days, the longest 25 days.The concentration of lead times is 10-15 days.(LO2-4)19.a.40b.5c.11 or 12d.about $18 per houre.about $9 per hourf.about 78%(LO2-4)20.a.200b.50 or $50,000c.about $180,000d.about $240,000e.about 60 homesf.about145homes(LO2-4)21.a.5b.MilesCF

Page 16

Statistical Techniques in Business and Economics, 17th Edition Solution Manual - Page 16 preview image

Loading page image...

Chapter 02-Describing Data: FrequencyTables,FrequencyDistributions, and Graphic Presentation2-9Less than 35Less than 617Less than 940Less than 1248Less than 1550c.d.about 8.7thousandfrequent fliermiles(LO2-4)
Preview Mode

This document has 307 pages. Sign in to access the full document!

Study Now!

XY-Copilot AI
Unlimited Access
Secure Payment
Instant Access
24/7 Support
Document Chat

Document Details

Subject
Statistics

Related Documents

View all