Statistics For The Behavioral Sciences, 10th Edition Solution Manual

Get a deeper understanding of your subject with Statistics For The Behavioral Sciences, 10th Edition Solution Manual, a well-organized textbook guide.

Chloe Martinez
Contributor
4.7
32
5 months ago
Preview (16 of 94 Pages)
100%
Purchase to unlock

Page 1

Statistics For The Behavioral Sciences, 10th Edition Solution Manual - Page 1 preview image

Loading page image...

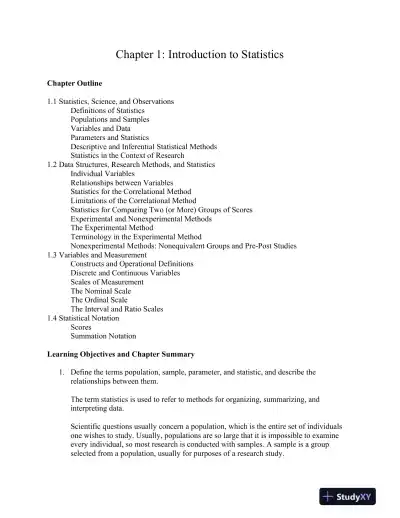
Chapter 1:Introduction to StatisticsChapter Outline1.1 Statistics, Science, and ObservationsDefinitions of StatisticsPopulations and SamplesVariables and DataParameters and StatisticsDescriptive and InferentialStatistical MethodsStatistics in the Context of Research1.2 Data Structures, Research Methods, and StatisticsIndividual VariablesRelationships between VariablesStatistics for the Correlational MethodLimitations of the Correlational MethodStatistics for Comparing Two (or More) Groups of ScoresExperimental and Nonexperimental MethodsThe Experimental MethodTerminology in the Experimental MethodNonexperimental Methods: Nonequivalent Groups and Pre-Post Studies1.3 Variables and MeasurementConstructs and Operational DefinitionsDiscrete and Continuous VariablesScales of MeasurementThe Nominal ScaleThe Ordinal ScaleThe Interval and Ratio Scales1.4 Statistical NotationScoresSummation NotationLearning Objectives and Chapter Summary1.Define the terms population, sample, parameter, and statistic, and describe therelationshipsbetween them.The term statistics is used to refer to methods for organizing, summarizing, andinterpreting data.Scientific questions usuallyconcern a population, which is the entire set of individualsone wishes to study. Usually, populations are so large that it is impossible to examineevery individual, so most research is conducted with samples. A sample is a groupselected from a population, usually for purposes of a research study.

Page 2

Statistics For The Behavioral Sciences, 10th Edition Solution Manual - Page 2 preview image

Loading page image...

Page 3

Statistics For The Behavioral Sciences, 10th Edition Solution Manual - Page 3 preview image

Loading page image...

A characteristic that describes a sample is called a statistic, and a characteristic thatdescribes a population is called a parameter. Although sample statistics are usuallyrepresentative of corresponding population parameters, there is typically somediscrepancy between a statistic and a parameter.2.Define descriptive and inferential statistics and describe how these two general categoriesof statistics are used in a typical research study.Statistical methods can be classified into two broad categories: descriptive statistics,which organize and summarize data, and inferential statistics, which use sample data todraw inferences about populations.3.Describe the concept of sampling error and explain how this concept creates thefundamental problem that inferential statistics must address.The naturally occurring difference between a statistic and a parameter is called samplingerror.4.Differentiate correlational, experimental, andnonexperimental research and describe thedata structures associated with each.5.Define independent, dependent, and quasi-independent variables and recognize examplesof each.6.Explain why operational definitions are developed for constructs and identify the twocomponents of an operational definition.The correlational method examines relationships between variables by measuring twodifferent variables for each individual. This method allows researchers to measure anddescribe relationships, butcannot produce a cause-and-effect explanation fortherelationship.The experimental method examines relationships between variables by manipulating anindependent variable to create different treatment conditions and then measuring adependent variable to obtain a group of scores in each condition. The groups of scores arethen compared. A systematic difference between groups provides evidence that changingthe independent variable from one condition to another also caused a change in thedependent variable. All other variables are controlled to prevent them from influencingthe relationship. The intent of the experimental method is to demonstrate a cause-and-effect relationship between variables. The experimental method examines relationshipsbetween variables by manipulating an independent variable to create different treatmentconditions and then measuring a dependent variable to obtain a group of scores in eachcondition. The groups of scores are then compared. A systematicdifference betweengroups provides evidence that changing the independent variable from one condition toanother also caused a change in the dependent variable. All other variables are controlled

Page 4

Statistics For The Behavioral Sciences, 10th Edition Solution Manual - Page 4 preview image

Loading page image...

to prevent them from influencing the relationship. The intent of the experimental methodis to demonstrate a cause-and-effect relationship between variables.Nonexperimental studies also examine relationships between variables by comparinggroups of scores, but they do not have the rigor of true experiments and cannot producecause-and-effect explanations. Instead of manipulating a variable to create differentgroups, a nonexperimental study uses a preexisting participant characteristic (such asmale/female) or the passage of time (before/after) to create the groups being compared.7.Describe discrete and continuous variables and identify examples of each.8.Differentiate nominal, ordinal, interval, and ratio scales of measurement.A discrete variable consists of indivisible categories, often whole numbers that vary incountable steps. A continuous variable consists of categories that are infinitely divisibleand each score corresponds to an interval on the scale. The boundaries that separateintervals are called real limits and are located exactly halfway between adjacent scores.A measurement scale consists of a set of categories that are used to classify individuals.A nominal scale consists of categories that differ only in name and are not differentiatedin terms of magnitude or direction. In an ordinal scale, the categories are differentiated interms of direction, forming an ordered series. An interval scale consists of an orderedseries of categories that are all equal-sized intervals. With an interval scale, it is possibleto differentiate direction and magnitude (or distance) between categories. Finally, a ratioscale is an interval scale for which the zero point indicates none of the variable beingmeasured. With a ratio scale, ratios of measurements reflect ratios of magnitude.9.Identify what is represented by each of the following symbols:X,Y,N,nand ∑.10.Perform calculations using summation notation and other mathematical operationsfollowing the correct order of operations.The letterXis used to represent scores for a variable. If a second variable is used,Yrepresents its scores. The letterNis used as the symbol for the number of scores in apopulation;nis the symbol for a number of scores in a sample.The Greek letter sigma (Σ) is used to stand for summation. Therefore, the expression ΣXis read “the sum of the scores.” Summation is a mathematical operation (like addition ormultiplication) and must be performed in its proper place in the order of operations;summation occurs after parentheses, exponents, and multiplying/dividing have beencompleted.

Page 5

Statistics For The Behavioral Sciences, 10th Edition Solution Manual - Page 5 preview image

Loading page image...

Other Lecture Suggestions1.Early in the first class, acknowledge that:Most students are not there by choice. (No one pickedstatisticsas an elective becauseit looked like a fun class.)Many students have some anxiety about the course.However, try to reassure them that the class will probably be easier and more enjoyable(less painful) than they would predict,providedthey follow a few simple rules:Keep Up. In statistics, each bit of new material builds on the previous material.Aslong as you have mastered the old material, then the new stuff is just one small stepforward.On the other hand, if you do not know the old material, then the new stuff istotally incomprehensible.(For example, try reading Chapter 10 on the first day ofclass.It will make no sense at all.However, by the time we get to Chapter 10, you willhave enough background to understand it.)Keeping up means coming to class, askingquestions, and doing homework on a regular basis.If you are getting lost, then get helpimmediately.Test Yourself.It is very easy to sit in class and watch an instructor work throughexamples.Also, it is very easy to complete homework assignments if you can lookback at example problems in the book.Neither activity means that you really know thematerial.For each chapter, try one or two of the end-of-chapter problems withoutlooking back at the examples in the book or checking your notes.Can you really dothe problems on your own?If not, pay attention to where you get stuck in the problem,so you will know exactly what you still need to learn.2.Give students a list of variables, for example items from a survey (age, gender, educationlevel, income, occupation) and ask students to identify the scale of measurement most likelyto be used and whether the variable is discrete or continuous.3.Describe anon-experimental or correlational study and have students identify reasons thatyou cannot make a cause-and-effect conclusion from the results.For example, a researcherfinds that children in the local school who regularly eat a nutritious breakfast have highergrades than students who do not eat a nutritious breakfast.Does this mean that a nutritiousbreakfastcauseshighergrades?For example, a researcher finds that employees whoregularly use the company’s new fitness center have fewer sick days than employees who donot use the center.Does this mean that using the fitness centercausespeople to be healthier?In either case, describe how the study could be made into an experiment by:a.beginning with equivalent groups (random assignment).b.manipulating the independent variable (this introduces the ethical question offorcing people to eat a nutritious breakfast).c.controlling other variables (the rest of the children’s diet).4.After introducing some basic applications of summation notation, present a simple list ofscores (1, 3, 5, 4) and a relatively complex expression containing summation notation, for

Page 6

Statistics For The Behavioral Sciences, 10th Edition Solution Manual - Page 6 preview image

Loading page image...

example, Σ(X1)2.Ask the students to compute the answer.You are likely to obtain severaldifferent responses.Note that this is not a democratic process-the most popular answer is not necessarilycorrect.There is only one correct answer because there is only one correct sequence forperforming the calculations.Have the class identify the step by stepsequence of operations specified by the expression.(First, subtract 1from each of the scores.Second, square the resulting values.Third,sum the squared numbers.)Then apply the steps, one by one, tocompute the answer.As a variation, present a list of steps and askstudents to write the mathematical expression corresponding to theseries of steps.Alternatively, there are frequently social media posts that testknowledge of the order of operations. Google“social media orderoperations” and click on “images” to see recent ones. Present severalto students to review the order of operations. One that claims a certain percentage of peopleget it wrong will allow an opportunity to discuss the misuse of statistics as well.5.Invite students to explore how they come into contact with statistics in their everyday lives.Use an article likeStatistics in Everyday Life(http://www.isixsigma.com/community/blogs/statistics-everyday-life/) to stimulatediscussion. Invite the students to find an article online or in a newspaper about a topic ofinterest to them and to review how that article uses (or misuses) statistics.Ask them toconsider the implications of not understanding statistics and their use.Answers to Even-Numbered Problems2.The population is the entire group of individuals (or scores) of interest for a particularresearch study. A sample is a group selected from a population that usually is used to representthe population in a research study. A parameter is a characteristic, usually a numerical value, thatdescribes a population. A statistic is a characteristic, usually numerical, that describes a sample.4. Sampling error is the naturally occurring difference between a sample and the populationfrom which the sample is obtained. Specifically, the statistics obtained for a sample will bedifferent from the corresponding parameters for the population and the statistics will differ fromone sample to another. This is a problem for inferential statistics because any difference foundbetween two treatment conditions may be explained by the treatments but it also may beexplained by sampling error.6. The goal of an experiment is to demonstrate the existence of a cause-and-effect relationshipbetween two variables. To accomplish the goal, an experiment must manipulate an independentvariable and control other, extraneous variables.8. This is not an experiment because no independent variable is manipulated. The researchersare comparing two preexisting groups ofindividuals.

Page 7

Statistics For The Behavioral Sciences, 10th Edition Solution Manual - Page 7 preview image

Loading page image...

10.a. The dependent variable is comprehension of the passage, which is measured by the testscores.b. Knowledge or comprehension is continuous.c. ratio scale (zero means no correct answers)12.a.The independent variable istaking the Tai Chi course versus not taking the course.b. Nominal scalec.The dependent variable isthe amount of arthritis pain experienced.d. The amount of pain probably is measured with an interval or a ratio scale.14.a.An ordinal scale provides information about the direction of difference (greater or less)between two measurements.b.An interval scale provides information about the magnitude of the difference betweentwo measurements.c. A ratio scaleprovides information about the ratio of two measurements.16.Honesty is an attribute or personality characteristic that cannot be observed or measureddirectly. Shyness could be operationally defined by identifying and observing external behaviorsassociated with being shy. Or, participants could be given a questionnaire asking how theybehave or feel in situations for which shyness might have an influence.18.a.X= 10b.X2= 38c.X+ 1 = 11d.(X+ 1) = 1420. a.X= 0b.X2= 50c.(X+ 3) = 1522. a. (ΣX)2b.X2c. Σ(X2)d. Σ(X1)2

Page 8

Statistics For The Behavioral Sciences, 10th Edition Solution Manual - Page 8 preview image

Loading page image...

Chapter 2: Frequency DistributionsChapter Outline2.1Frequency Distributions and Frequency Distribution TablesFrequencyDistribution TablesProportions and Percentages2.2Grouped Frequency Distribution TablesReal Limits and Frequency Distributions2.3Frequency Distribution GraphsGraphs for Interval or Ratio DataGraphs for Nominal or Ordinal DataGraphs for Population DistributionsThe Shape of a Frequency Distribution2.4Percentiles, Percentile Ranks, and InterpolationCumulative Frequency and Cumulative PercentageInterpolation2.5Stem and Leaf DisplaysComparing Stem and Leaf Displays with Frequency DistributionsLearning Objectives and Chapter Summary1.Describe the basic elements of a frequency distribution table and explain how they are relatedto the original set of scores.The goal of descriptive statistics is to simplify the organization and presentation of data.One descriptive technique is to place the data in afrequency distribution table or graphthat shows exactly how many individuals (or scores) are located in each category on thescale of measurement.2.Calculate the following from a frequency table: ΣX, ΣX2, and the proportion and percentage ofthe group associated with each score.A frequency distribution table lists the categories that make up the scale of measurement(theXvalues) in one column. Beside eachXvalue, in a second column, is the frequency(f)or number of individuals in that category. The table may include a proportion(p)column showing the relative frequency for each category and itmay include a percentagecolumn showing the percentage(%)associated with each X value.3.Identify when it is useful to set up a grouped frequency distribution table, and explain how toconstruct this type of table for a set of scores.It is recommended that a frequency distribution table have a maximum of 1015 rows tokeep it simple. If the scores cover a range that is wider than this suggested maximum, it is

Page 9

Statistics For The Behavioral Sciences, 10th Edition Solution Manual - Page 9 preview image

Loading page image...

customary to divide the range into sections called class intervals. These intervals are thenlisted in the frequency distribution table along with the frequency or number ofindividuals with scores in each interval. The result is called a grouped frequencydistribution.The guidelines for constructing a grouped frequency distribution table are asfollows:a. There should be about 10 intervals.b. The width of each interval should be a simple number (e.g., 2, 5, or 10).c. The bottom score ineach interval should be a multiple of the width.d. All intervals should be the same width, and they should cover the range ofscores with no gaps.4.Describe how the three types of frequency distribution graphs-histograms, polygons, and bargraphs-are constructed and identify when each is used.5.Describe the basic elements of a frequency distribution graph and explain how they are relatedto the original set of scores.6.Explain how frequency distribution graphs for populations differ from the graphs used forsamples.A frequency distribution graph lists scores on the horizontal axis and frequencies on thevertical axis. Thetype of graph used to display a distribution depends on the scale ofmeasurement used. For interval or ratio scales, you should use a histogram or a polygon.For a histogram, a bar is drawn above each score so that the height of the bar correspondsto the frequency. Each bar extends to the real limits of the score, so that adjacent barstouch. For a polygon, a dot is placed above the mid-point of each score or class intervalso that the height of the dot corresponds to the frequency; then lines are drawn to connectthe dots. Bar graphs are used with nominal or ordinal scales.Bar graphs are similar tohistograms except that gaps are left between adjacent bars.7. Identify the shape-symmetrical, andpositively or negatively skewed-of a distribution in afrequency distribution graph.Shape is one of the basic characteristics used to describe a distribution of scores. Mostdistributions can be classified as either symmetrical or skewed. A skewed distributionthat tails off to the right is positively skewed. If it tails off to the left, it is negativelyskewed.8.Define percentiles and percentile ranks.9. Determine percentiles and percentile ranks for values corresponding to real limits in afrequency distribution table.The cumulative percentage is the percentage of individuals with scores at or below aparticular point in the distribution. The cumulative percentage values are associated withtheupper real limits of the corresponding scores or intervals.

Page 10

Statistics For The Behavioral Sciences, 10th Edition Solution Manual - Page 10 preview image

Loading page image...

Percentiles and percentile ranks are used to describe the position of individual scoreswithin a distribution. Percentile rank givesthe cumulative percentage associated with aparticular score. A score that is identified by its rank is called a percentile.10.Estimate percentiles and percentile ranks using interpolation for values that do notcorrespond to real limits in a frequency distribution table.When a desired percentile or percentile rank is located between two known values, it ispossible to estimate the desired value using the process of interpolation. Interpolationassumes a regular linear change between the two known values.11.Describe the basic elements of a stem and leaf display and explain how the display shows theentire distribution of scores.A stem and leaf display is an alternative procedure for organizing data. Each score isseparated into a stem (the first digit or digits) and a leaf (the last digit). The displayconsists of the stems listed in a column with the leaf for each score written beside itsstem. A stem and leaf display is similar to a grouped frequency distribution table,however the stem and leaf display identifies the exact value of each score and thegrouped frequency distribution does not.Other Lecture Suggestions1. Begin with an unorganized list of scores as in Example 2.1, and then organize the scores into atable. If you use a set of 20 or 25 scores, it will be easy to compute proportions and percentagesfor the same example.2. Present a relatively simple, regular frequency distribution table (for example, use scores of 5,4, 3, 2, and 1 with corresponding frequencies of 1, 3, 5, 3, 2. Ask the students to determine thevalues of N and ΣX for the scores. Note that ΣX can be obtained two different ways: 1) bycomputing and summing the fX values within the table, 2) by retrieving the complete list ofindividual scores and working outside the table.Next, ask the students to determine the value of ΣX2. You probably will find a lot of wronganswers from students who are trying to use the fX values within the table. The common mistakeis to compute (fX)2and then sum these values. Note that whenever it is necessary to do complexcalculations with a set of scores, the safe method is to retrieve the list of individual scores fromthe table before you try any computations.3. It sometimes helps to make a distinction between graphs that are being used in a formalpresentation and sketches that are used to get a quick overview of a set of data. In one case, thegraphs should be drawn precisely and the axes should be labeled clearly so that the graph can beeasily understood without any outside explanation. On the other hand, a sketch that is intendedfor your own personal use can be much less precise. As an instructor, if you are expecting

Page 11

Statistics For The Behavioral Sciences, 10th Edition Solution Manual - Page 11 preview image

Loading page image...

precise, detailed graphs from your students, you should be sure that they know yourexpectations.4. Introduce interpolation with a simple, real-world example. For example, in Buffalo, theaverage snowfall during the month of February is 30 inches. Ask students, how much snow theywould expect during the first half of the month. Then point out that the same interval (February)is being measured in terms of days and in terms of inches of snow. A point that is half-waythrough the interval in terms of days should also be half-way through the interval in terms ofsnow.5. Refer to Box 2.1 The Use and Misuse of Graphs and discuss common misuses. For moreexamples, refer to the subtly-namedHow to Lie with Data Visualization(http://data.heapanalytics.com/how-to-lie-with-data-visualization/). Challenge students to bringin examples of misleading graphs they find online or in print. (Hint: The more stridently awebsite advocates for or against a particular point of view on a social, political or othercontroversial issue, the more likely you are to find misrepresentation of data.)Answers to Even-Numbered Problems2.Xfp%────────────910.055%800.000%710.055%620.1010%540.2020%420.1010%330.1515%250.2525%120.1010%────────────4. a.n= 14b. ΣX= 44c. ΣX2= 168

Page 12

Statistics For The Behavioral Sciences, 10th Edition Solution Manual - Page 12 preview image

Loading page image...

6.Xf60-64155-59250-54245-491Younger drivers, especially those 20 to 2940-442years old, tend to get more tickets.35-39330-34325-29520-24815-1938. A regular table reports the exact frequency for each category on the scale of measurement.After the categories have been grouped into classintervals, the table reports only the overallfrequency for the interval but does not indicate how many scores are in each of the individualcategories.10. a.Xf102948474635241b.54┌────┐f3┌───┤2┌───┤├───┐1┌───┤└─┴───┴───┴───┴───┴───┴───┴───┴─────X4567891011

Page 13

Statistics For The Behavioral Sciences, 10th Edition Solution Manual - Page 13 preview image

Loading page image...

12.17│┌────┐16│15│14│┌────┐13│12│┌────┐11│10│f9│┌────┐87│┌────┐6│┌────┐5│4│3│2│1│─┴────┴───┴────┴───┴────┴───┴────┴───┴────┴───┴────┴─Plumb.Elect.Secur.Book.NurseEducat.Job Advertisement Categories14.Xf155146134The distribution is negatively skewed.122112101

Page 14

Statistics For The Behavioral Sciences, 10th Edition Solution Manual - Page 14 preview image

Loading page image...

16.Xflowfhigh515426343251130The scores for children from thehigh number-talk parents are noticeably higher.18.Xfcfc%252912510020244249615198208010147124859352004228a. 20%b. 80%c.X= 14.5d.X= 24.520.a. 32%b. 59%c.X= 14.25d.X= 15.1022.a.X= 22b.X= 31.5c. 93%d. 28%24.a. 6b. 75, 79, 72, 73, 77, 74c. 1d. 48

Page 15

Statistics For The Behavioral Sciences, 10th Edition Solution Manual - Page 15 preview image

Loading page image...

Chapter 3: Central TendencyChapter Outline3.1 Overview3.2 The MeanAlternative Definitions for the MeanThe Weighted MeanComputing the Mean from a Frequency Distribution TableCharacteristics of the Mean3.3 The MedianFinding the Median for Most DistributionsFinding the Precise Median for a Continuous VariableThe Median, the Mean, and the Middle3.4 The Mode3.5 Selecting a Measure of Central TendencyWhen to Use the MedianWhen to Use the ModeIn The Literature: Reporting Measures of Central TendencyPresenting Means and Medians in Graphs3.6 Central Tendency and the Shape of the DistributionSymmetrical DistributionsSkewed DistributionsLearning Objectives and Chapter Summary1. Define the mean and calculate both the population mean and the sample mean.2. Explain the alternative definitions of the mean as the amount each individual receives whenthe total is divided equally and as a balancing point.3. Calculate a weighted mean.4. Findn,X, andMusing scores in a frequency distribution table.5. Describe how the mean is affected by each of the following: changing a score, adding orremoving a score, adding or subtracting a constant from each score, and multiplying or dividingeach score by a constant.The purpose of central tendency is to determine the single value that identifies the centerof the distribution and best represents the entire set of scores. The three standardmeasures of central tendency are the mode, the median, and the mean.The mean is thearithmetic average. It is computed by adding all the scores and thendividing by the number of scores. Conceptually, the mean is obtained by dividing thetotal (X) equally among the number of individuals (Norn). The mean can also be

Page 16

Statistics For The Behavioral Sciences, 10th Edition Solution Manual - Page 16 preview image

Loading page image...

defined as thebalance point for the distribution. The distancesabove the mean areexactly balanced by the distances below the mean. Although the calculation is the samefor a population or a sample mean, a population mean is identified by the symbolμ, and asample mean is identified byM. In most situations with numerical scores from an intervalor a ratio scale, the mean is the preferred measure of central tendency.Changing any score in the distribution causes the mean to be changed. When a constantvalue is added to (or subtracted from) every score in a distribution, the same constantvalue is added to (or subtracted from) the mean. If every score is multiplied by a constant,the mean is multiplied by the same constant.6. Define and calculate the median, and find the precise median for a continuous variable.The median is the midpoint of a distribution of scores. The median is the preferredmeasure of central tendency when a distribution has a few extreme scores that displacethe value of the mean. The median also is used when there are undetermined (infinite)scores that make it impossible to compute a mean. Finally, the median is the preferredmeasure of central tendency for data from an ordinal scale.7. Define and identify the mode(s) for a distribution, including the major and minor modes for abinomial distribution.The mode is the most frequently occurring score in a distribution. It is easily located byfinding the peak in a frequency distribution graph. For data measured on a nominal scale,the mode is the appropriate measureof central tendency. It is possible for a distribution tohave more than one mode.8.Explain when each of the three measures of central tendencymean, median, and modeshould be used, identify the advantages and disadvantages of each, and describe how each ispresented in a report of research results.9. Explain how the three measures of central tendencymean, median, and modeare related toeach other for symmetrical and skewed distributions.For symmetrical distributions, the mean will equal the median. If there is only one mode,then it will have the same value, too.For skewed distributions, the mode is located toward the side where the scores pile up,and the mean is pulled toward the extreme scores in the tail. The median is usuallylocated between these two values.Other Lecture Suggestions1.The mean can be introduced as the “average” that students already know how to calculate.Forexample, ask students to find the average telephone bill if one month is $20 and the next monthis $30.Everyone gets this right.Now, add a third month with a bill of $100.Many students will
Preview Mode

This document has 94 pages. Sign in to access the full document!

Study Now!

XY-Copilot AI
Unlimited Access
Secure Payment
Instant Access
24/7 Support
Document Chat

Document Details

Subject
Statistics

Related Documents

View all