Test Bank for Intro Stats, 4th Edition

Achieve top scores with Test Bank for Intro Stats, 4th Edition, a well-crafted guide filled with must-know information, examples, and revision techniques.

Leo Bailey
Contributor
4.5
37
5 months ago
Preview (16 of 397 Pages)
100%
Purchase to unlock

Page 1

Test Bank for Intro Stats, 4th Edition - Page 1 preview image

Loading page image...

ONLINETESTBANKANDRESOURCEGUIDEINTROSTATSFOURTHEDITIONRichard De VeauxWilliams CollegePaul VellemanCornell UniversityDavid BockCornell UniversityWilliam Craine IIILansing High School

Page 2

Test Bank for Intro Stats, 4th Edition - Page 2 preview image

Loading page image...

Page 3

Test Bank for Intro Stats, 4th Edition - Page 3 preview image

Loading page image...

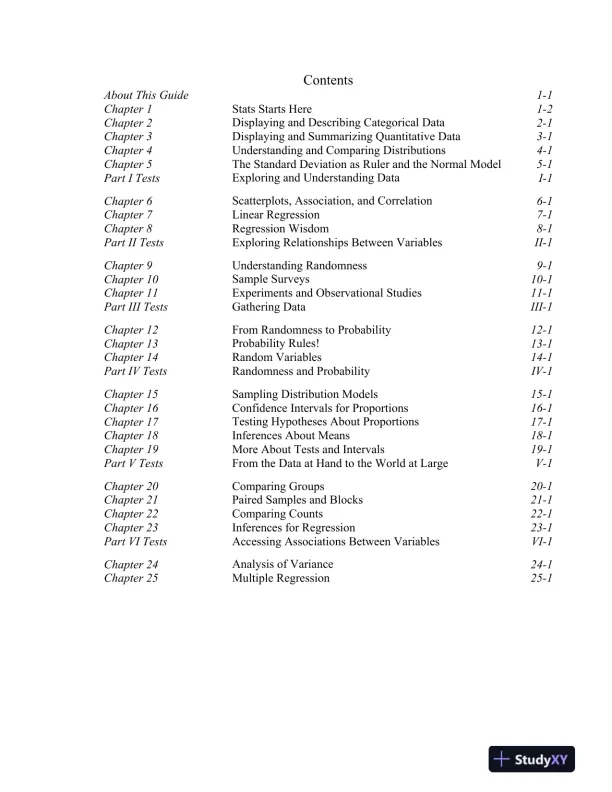
ContentsAbout This Guide1-1Chapter 1Stats Starts Here1-2Chapter 2Displaying and Describing Categorical Data2-1Chapter 3Displaying and Summarizing Quantitative Data3-1Chapter 4Understanding and Comparing Distributions4-1Chapter 5The Standard Deviation as Ruler and the Normal Model5-1Part I TestsExploring and Understanding DataI-1Chapter 6Scatterplots, Association, and Correlation6-1Chapter 7Linear Regression7-1Chapter 8Regression Wisdom8-1Part II TestsExploring Relationships Between VariablesII-1Chapter 9Understanding Randomness9-1Chapter 10Sample Surveys10-1Chapter 11Experiments and Observational Studies11-1Part III TestsGathering DataIII-1Chapter 12From Randomness to Probability12-1Chapter 13Probability Rules!13-1Chapter 14Random Variables14-1Part IV TestsRandomness and ProbabilityIV-1Chapter 15Sampling Distribution Models15-1Chapter 16Confidence Intervals for Proportions16-1Chapter 17Testing Hypotheses About Proportions17-1Chapter 18Inferences About Means18-1Chapter 19More About Tests and Intervals19-1Part V TestsFrom the Data at Hand to the World at LargeV-1Chapter 20Comparing Groups20-1Chapter 21Paired Samples and Blocks21-1Chapter 22Comparing Counts22-1Chapter 23Inferences for Regression23-1Part VI TestsAccessing Associations Between VariablesVI-1Chapter 24Analysis of Variance24-1Chapter 25Multiple Regression25-1

Page 4

Test Bank for Intro Stats, 4th Edition - Page 4 preview image

Loading page image...

1-1How to use thisTest Bank and Resource GuideThis guide is a supplement to be used in conjunction with the Instructor’s Edition ofIntro Stats,4thedition by De Veaux, Velleman, and Bock. The authors have integrated many instructor’sresources into the text, and these sections precede each chapter. In thisTest Bank and ResourceGuide, all or some of the following features may be found for each chapter and unit.Solutions to Class ExamplesAnswers are provided to the chapter examples presented in the Instructor’s Edition of the text.Investigative TasksInstead of a quiz, you may choose to have students do a written assignment that applies the majorconcepts of the chapter. Along with each classroom-tested task, there is a proposed solution tothe task and a scoring rubric. Returning the completed rubric to the students will provide themthe guidance needed to learn to write clear, complete, and concise statistical analyses.Chapter QuizzesYou might choose to give a quiz after completing a chapter. For each chapter, there are two orthree quizzes that you can choose from, along with solutions. If not used as a quiz, the questionscan be used as additional class examples, homework assignments, or extra practice.Unit TestsTwo or three sample exams (and solutions) are available for you at the end of each of the text’sseven units. These exams include multiple-choice questions, short questions some calculations orwritten explanations, and longer questions requiring more in-depth analysis. They are not easy.Understanding Statistics means thinking about the world. All of the problems ask for clearunderstanding of important statistical concepts, accurate application of statistical techniques, andproper interpretation of the results. Expecting this from the start helps students establish the habitof clear statistical thinking.Supplemental ResourcesWe’ve tried lots of things over the years to help students understand the beauty and power ofStatistics. Where applicable, we’ve included some extra materials. These might be worksheets,group assignments, or class activities.

Page 5

Test Bank for Intro Stats, 4th Edition - Page 5 preview image

Loading page image...

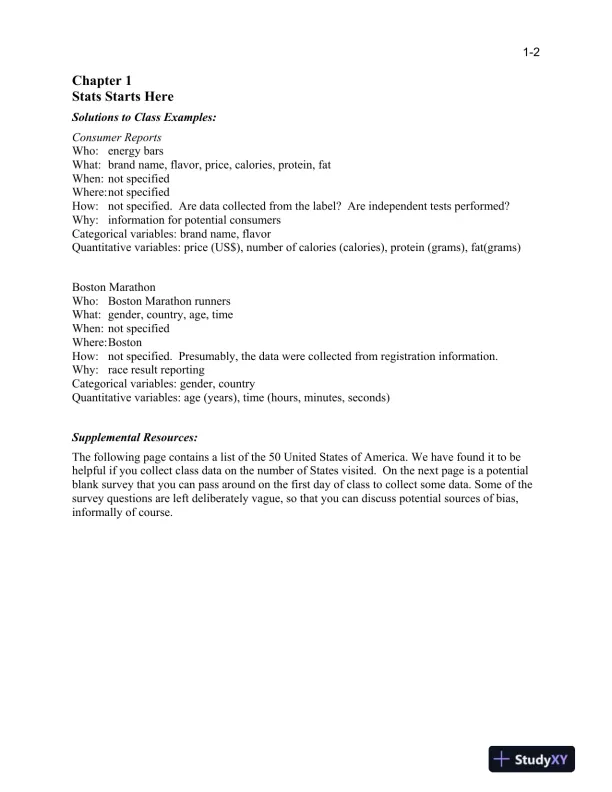
1-2Chapter 1Stats Starts HereSolutions to Class Examples:Consumer ReportsWho:energy barsWhat: brand name, flavor, price, calories, protein, fatWhen: not specifiedWhere:not specifiedHow:not specified. Are data collected from the label? Are independent tests performed?Why:information for potential consumersCategorical variables: brand name, flavorQuantitative variables: price (US$), number of calories (calories), protein (grams), fat(grams)Boston MarathonWho:Boston Marathon runnersWhat: gender, country, age, timeWhen: not specifiedWhere:BostonHow:not specified. Presumably, the data were collected from registration information.Why:race result reportingCategorical variables: gender, countryQuantitative variables: age (years), time (hours, minutes, seconds)Supplemental Resources:The following page contains a list of the 50 United States of America. We have found it to behelpful if you collect class data on the number of States visited. On the next page is a potentialblank survey that you can pass around on the first day of class to collect some data. Some of thesurvey questions are left deliberately vague, so that you can discuss potential sources of bias,informally of course.

Page 6

Test Bank for Intro Stats, 4th Edition - Page 6 preview image

Loading page image...

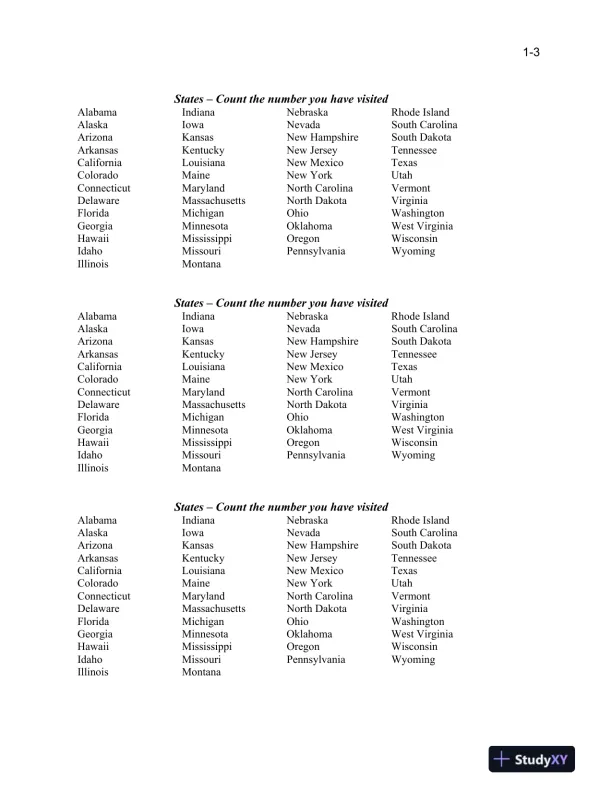
1-3States – Count the number you have visitedAlabamaIndianaNebraskaRhode IslandAlaskaIowaNevadaSouth CarolinaArizonaKansasNew HampshireSouth DakotaArkansasKentuckyNew JerseyTennesseeCaliforniaLouisianaNew MexicoTexasColoradoMaineNew YorkUtahConnecticutMarylandNorth CarolinaVermontDelawareMassachusettsNorth DakotaVirginiaFloridaMichiganOhioWashingtonGeorgiaMinnesotaOklahomaWest VirginiaHawaiiMississippiOregonWisconsinIdahoMissouriPennsylvaniaWyomingIllinoisMontanaStates – Count the number you have visitedAlabamaIndianaNebraskaRhode IslandAlaskaIowaNevadaSouth CarolinaArizonaKansasNew HampshireSouth DakotaArkansasKentuckyNew JerseyTennesseeCaliforniaLouisianaNew MexicoTexasColoradoMaineNew YorkUtahConnecticutMarylandNorth CarolinaVermontDelawareMassachusettsNorth DakotaVirginiaFloridaMichiganOhioWashingtonGeorgiaMinnesotaOklahomaWest VirginiaHawaiiMississippiOregonWisconsinIdahoMissouriPennsylvaniaWyomingIllinoisMontanaStates – Count the number you have visitedAlabamaIndianaNebraskaRhode IslandAlaskaIowaNevadaSouth CarolinaArizonaKansasNew HampshireSouth DakotaArkansasKentuckyNew JerseyTennesseeCaliforniaLouisianaNew MexicoTexasColoradoMaineNew YorkUtahConnecticutMarylandNorth CarolinaVermontDelawareMassachusettsNorth DakotaVirginiaFloridaMichiganOhioWashingtonGeorgiaMinnesotaOklahomaWest VirginiaHawaiiMississippiOregonWisconsinIdahoMissouriPennsylvaniaWyomingIllinoisMontana

Page 7

Test Bank for Intro Stats, 4th Edition - Page 7 preview image

Loading page image...

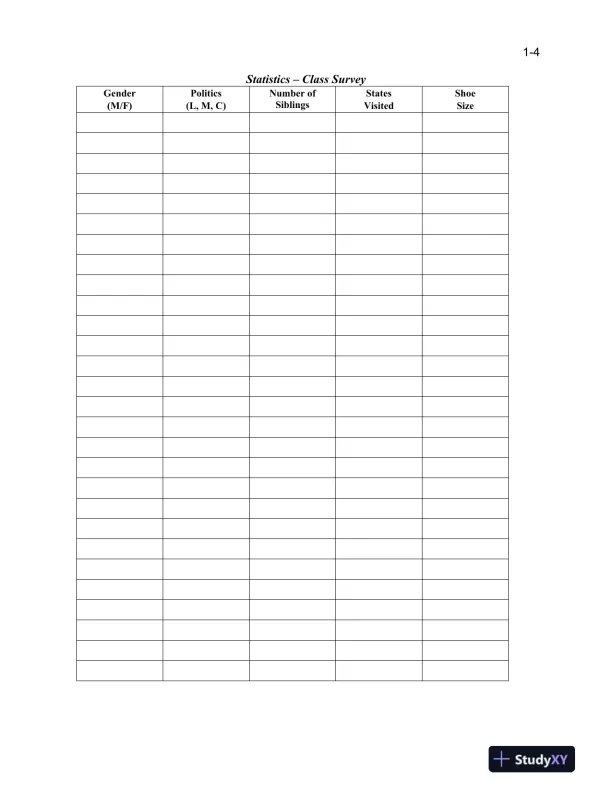
1-4Statistics – Class SurveyGender(M/F)Politics(L, M, C)Number ofSiblingsStatesVisitedShoeSize

Page 8

Test Bank for Intro Stats, 4th Edition - Page 8 preview image

Loading page image...

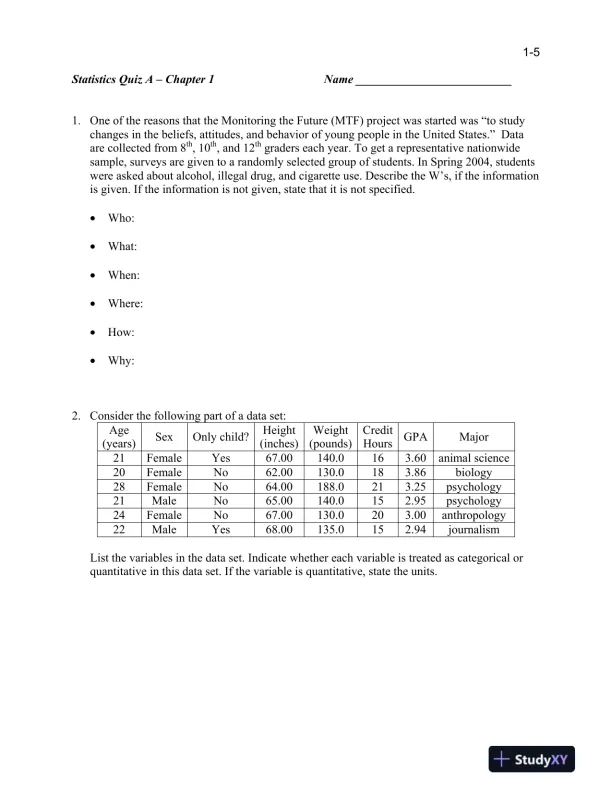
1-5Statistics Quiz A – Chapter 1Name __________________________1.One of the reasons that the Monitoring the Future (MTF) project was started was “to studychanges in the beliefs, attitudes, and behavior of young people in the United States.” Dataare collected from 8th, 10th, and 12thgraders each year. To get a representative nationwidesample, surveys are given to a randomly selected group of students. In Spring 2004, studentswere asked about alcohol, illegal drug, and cigarette use. Describe the W’s, if the informationis given. If the information is not given, state that it is not specified.Who:What:When:Where:How:Why:2.Consider the following part of a data set:Age(years)SexOnly child?Height(inches)Weight(pounds)CreditHoursGPAMajor21FemaleYes67.00140.0163.60animal science20FemaleNo62.00130.0183.86biology28FemaleNo64.00188.0213.25psychology21MaleNo65.00140.0152.95psychology24FemaleNo67.00130.0203.00anthropology22MaleYes68.00135.0152.94journalismList the variables in the data set. Indicate whether each variable is treated as categorical orquantitative in this data set. If the variable is quantitative, state the units.

Page 9

Test Bank for Intro Stats, 4th Edition - Page 9 preview image

Loading page image...

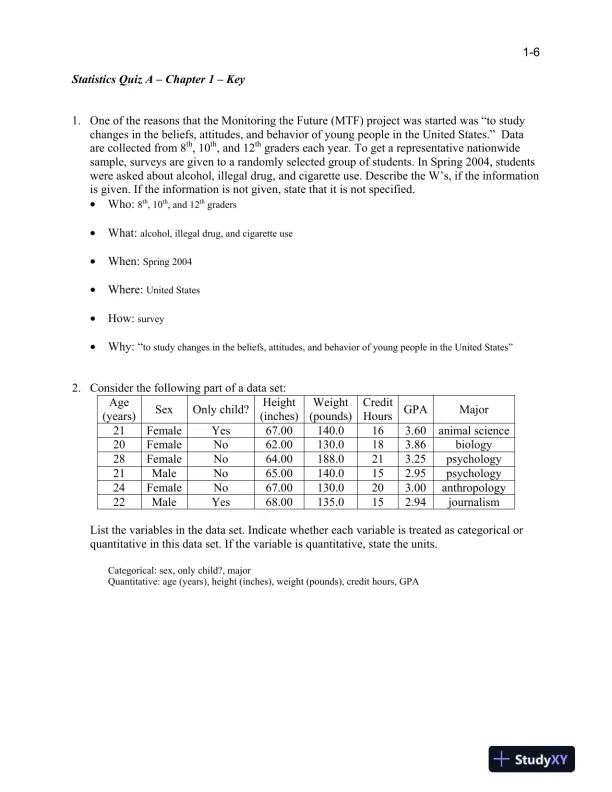
1-6Statistics Quiz A – Chapter 1 – Key1.One of the reasons that the Monitoring the Future (MTF) project was started was “to studychanges in the beliefs, attitudes, and behavior of young people in the United States.” Dataare collected from 8th, 10th, and 12thgraders each year. To get a representative nationwidesample, surveys are given to a randomly selected group of students. In Spring 2004, studentswere asked about alcohol, illegal drug, and cigarette use. Describe the W’s, if the informationis given. If the information is not given, state that it is not specified.Who:8th, 10th, and 12thgradersWhat:alcohol, illegal drug, and cigarette useWhen:Spring 2004Where:United StatesHow:surveyWhy: “to study changes in the beliefs, attitudes, and behavior of young people in the United States”2.Consider the following part of a data set:Age(years)SexOnly child?Height(inches)Weight(pounds)CreditHoursGPAMajor21FemaleYes67.00140.0163.60animal science20FemaleNo62.00130.0183.86biology28FemaleNo64.00188.0213.25psychology21MaleNo65.00140.0152.95psychology24FemaleNo67.00130.0203.00anthropology22MaleYes68.00135.0152.94journalismList the variables in the data set. Indicate whether each variable is treated as categorical orquantitative in this data set. If the variable is quantitative, state the units.Categorical: sex, only child?, majorQuantitative: age (years), height (inches), weight (pounds), credit hours, GPA

Page 10

Test Bank for Intro Stats, 4th Edition - Page 10 preview image

Loading page image...

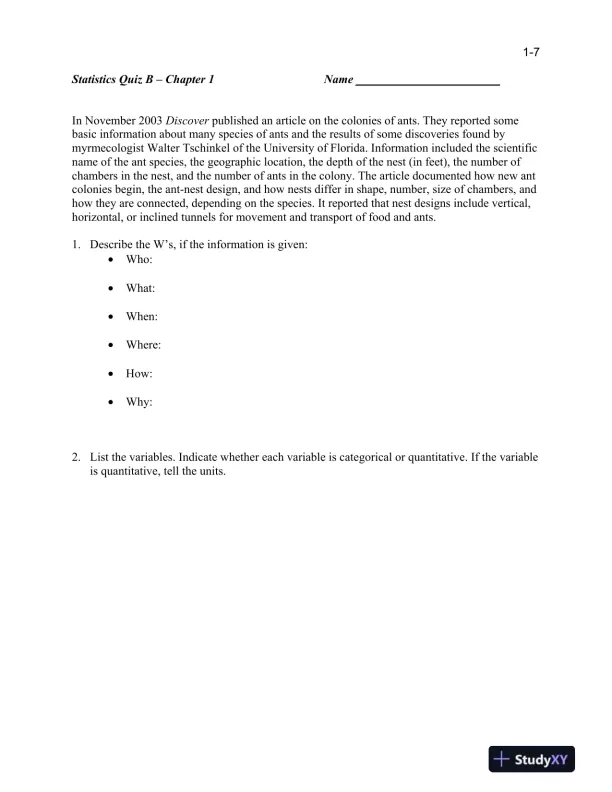
1-7Statistics Quiz B – Chapter 1Name ________________________In November 2003Discoverpublished an article on the colonies of ants. They reported somebasic information about many species of ants and the results of some discoveries found bymyrmecologist Walter Tschinkel of the University of Florida. Information included the scientificname of the ant species, the geographic location, the depth of the nest (in feet), the number ofchambers in the nest, and the number of ants in the colony. The article documented how new antcolonies begin, the ant-nest design, and how nests differ in shape, number, size of chambers, andhow they are connected, depending on the species. It reported that nest designs include vertical,horizontal, or inclined tunnels for movement and transport of food and ants.1.Describe the W’s, if the information is given:Who:What:When:Where:How:Why:2.List the variables. Indicate whether each variable is categorical or quantitative. If the variableis quantitative, tell the units.

Page 11

Test Bank for Intro Stats, 4th Edition - Page 11 preview image

Loading page image...

1-8Statistics Quiz B – Chapter 1 – KeyIn November 2003Discoverpublished an article on the colonies of ants. They reported somebasic information about many species of ants and the results of some discoveries found bymyrmecologist Walter Tschinkel of the University of Florida. Information included the scientificname of the ant species, the geographic location, the depth of the nest (in feet), the number ofchambers in the nest, and the number of ants in the colony. The article documented how new antcolonies begin, the ant-nest design, and how nests differ in shape, number, size of chambers, andhow they are connected, depending on the species. It reported that nest designs include vertical,horizontal, or inclined tunnels for movement and transport of food and ants.1.Describe the W’s, if the information is given:Who:Colonies of ants. “Many species of ants,” but no indication of exactly how many.What:scientific name, geographic location, average nest depth, average number of chambers, averagecolony size, how new ant colonies begin, the ant-nest design, and how nests differ inarchitecture.When:November 2003Where:not specifiedHow:The results of some discoveries found by myrmecologist Walter Tschinkel of the University ofFloridaWhy:Information of interest to readers of the magazine2.List the variables. Indicate whether each variable is categorical or quantitative. If the variableis quantitative, tell the units.Categorical: species, geographic location, how new ant colonies begin, and nest design.Quantitative: nest depth (feet), number of chambers (units), and colony size (units).

Page 12

Test Bank for Intro Stats, 4th Edition - Page 12 preview image

Loading page image...

1-9Statistics Quiz C – Chapter 1Name __________________________In June 2012Consumer Reportspublished an article on some sport-utility vehicles they hadtested recently. They reported some basic information about each of the vehicles and the resultsof some tests conducted by their staff. Among other things, the article told the brand of eachvehicle, its price, and whether it had a standard or automatic transmission. They reported thevehicle’s fuel economy, its acceleration (number of seconds to go from zero to 60 mph), and itsbraking distance to stop from 60 mph. The article also rated each vehicle’s reliability as muchbetter than average, better than average, average, worse, or much worse than average.1.Describe the W’s, if the information is given:Who:What:When:Where:How:Why:2.List the variables. Indicate whether each variable is categorical or quantitative. If thevariable is quantitative, tell the units.

Page 13

Test Bank for Intro Stats, 4th Edition - Page 13 preview image

Loading page image...

1-10Statistics Quiz C – Chapter 1 – KeyIn June 2012Consumer Reportspublished an article on some sport-utility vehicles they hadtested recently. They reported some basic information about each of the vehicles and the resultsof some tests conducted by their staff. Among other things, the article told the brand of eachvehicle, its price, and whether it had a standard or automatic transmission. They reported thevehicle’s fuel economy, its acceleration (number of seconds to go from zero to 60 mph), and itsbraking distance to stop from 60 mph. The article also rated each vehicle’s reliability as muchbetter than average, better than average, average, worse, or much worse than average.1.Describe the W’s, if the information is given:Who:SUV’s currently on the market. We don’t know how many models.What:When: prior to June 2012Where:not specified, probably the United StatesHow:testing the vehicles by driving eachWhy:information for potential consumers2.List the variables. Indicate whether each variable is categorical or quantitative. If thevariable is quantitative, tell the units.Categorical: brand, transmission type, reliabilityQuantitative: price (US$), fuel economy (mpg), acceleration (seconds), braking distance (probablyfeet?)

Page 14

Test Bank for Intro Stats, 4th Edition - Page 14 preview image

Loading page image...

2-1Chapter 2Displaying and Describing Categorical DataSolutions to Class Examples:1.See Class Example 1.2.Answers will vary according to your data.3.See Class Example 3.4.Point out that this example deals with quantitative variables, not categorical. The paradoxcan be explained when you realize that Company A must employ a greater percentage oflaborers than Company B. Also, Company A must employ a smaller percentage of managersthan Company B. If laborers earn salaries that are considerably lower than managers, thesalaries of Company A’s laborers will pull the company average down, and the salaries ofCompany B’s managers will pull the company average up.The proper way tocompare the companiesis to use the salaries thatare broken down by jobtype. Using the overallaverage salary leads to amisleading conclusion.Investigative TaskRace and the Death Penalty uses a three-way contingency table and requires comparing marginaland conditional distributions.Supplemental ResourcesAfter the Investigative Task, there is a worksheet on the relationship between smoking andeducation level.1000030000500002468Company A Salaries ($)1000030000500002468Company B Salaries ($)MeanSalary$28000MeanSalary$43000

Page 15

Test Bank for Intro Stats, 4th Edition - Page 15 preview image

Loading page image...

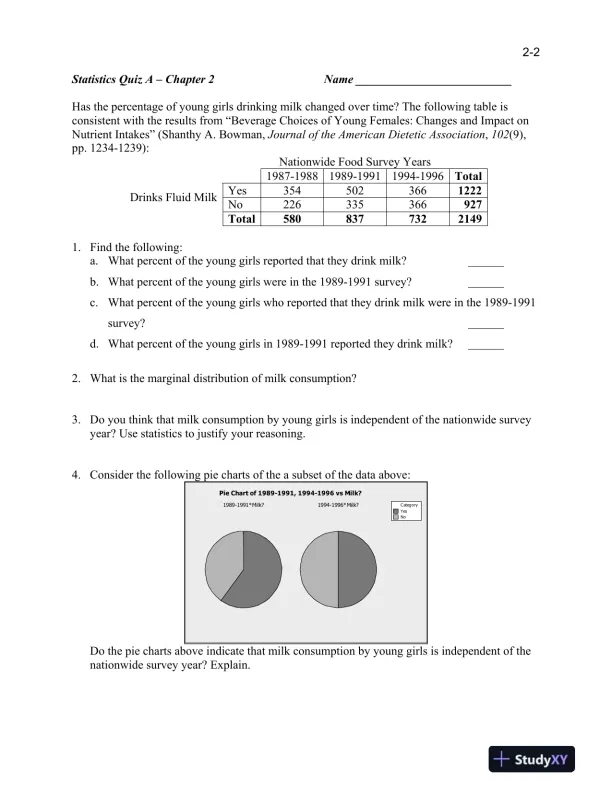
2-2Statistics Quiz A – Chapter 2Name __________________________Has the percentage of young girls drinking milk changed over time? The following table isconsistent with the results from “Beverage Choices of Young Females: Changes and Impact onNutrient Intakes” (Shanthy A. Bowman,Journal of the American Dietetic Association,102(9),pp. 1234-1239):Nationwide Food Survey Years1987-19881989-19911994-1996TotalYes3545023661222Drinks Fluid MilkNo226335366927Total58083773221491.Find the following:a.What percent of the young girls reported that they drink milk?b.What percent of the young girls were in the 1989-1991 survey?c.What percent of the young girls who reported that they drink milk were in the 1989-1991survey?d.What percent of the young girls in 1989-1991 reported they drink milk?2.What is the marginal distribution of milk consumption?3.Do you think that milk consumption by young girls is independent of the nationwide surveyyear? Use statistics to justify your reasoning.4.Consider the following pie charts of the a subset of the data above:1989-1991*Milk?1994-1996*Milk?CategoryYesNoPie Chart of 1989-1991, 1994-1996 vs Milk?Do the pie charts above indicate that milk consumption by young girls is independent of thenationwide survey year? Explain.

Page 16

Test Bank for Intro Stats, 4th Edition - Page 16 preview image

Loading page image...

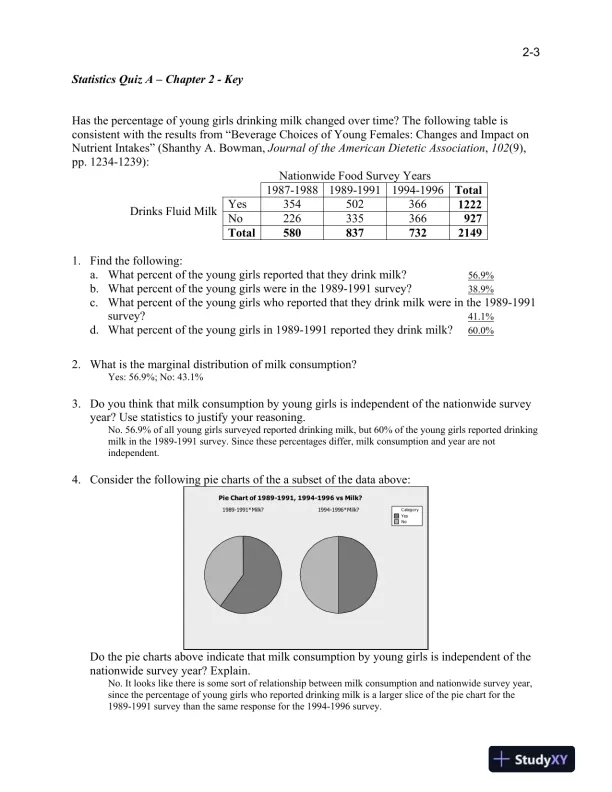
2-3Statistics Quiz A – Chapter 2 - KeyHas the percentage of young girls drinking milk changed over time? The following table isconsistent with the results from “Beverage Choices of Young Females: Changes and Impact onNutrient Intakes” (Shanthy A. Bowman,Journal of the American Dietetic Association,102(9),pp. 1234-1239):Nationwide Food Survey Years1987-19881989-19911994-1996TotalYes3545023661222Drinks Fluid MilkNo226335366927Total58083773221491.Find the following:a.What percent of the young girls reported that they drink milk?56.9%b.What percent of the young girls were in the 1989-1991 survey?38.9%c.What percent of the young girls who reported that they drink milk were in the 1989-1991survey?41.1%d.What percent of the young girls in 1989-1991 reported they drink milk?60.0%2.What is the marginal distribution of milk consumption?Yes: 56.9%; No: 43.1%3.Do you think that milk consumption by young girls is independent of the nationwide surveyyear? Use statistics to justify your reasoning.No. 56.9% of all young girls surveyed reported drinking milk, but 60% of the young girls reported drinkingmilk in the 1989-1991 survey. Since these percentages differ, milk consumption and year are notindependent.4.Consider the following pie charts of the a subset of the data above:1989-1991*Milk?1994-1996*Milk?C ategoryYesNoPie Chart of 1989-1991, 1994-1996 vs Milk?Do the pie charts above indicate that milk consumption by young girls is independent of thenationwide survey year? Explain.No. It looks like there is some sort of relationship between milk consumption and nationwide survey year,since the percentage of young girls who reported drinking milk is a larger slice of the pie chart for the1989-1991 survey than the same response for the 1994-1996 survey.
Preview Mode

This document has 397 pages. Sign in to access the full document!

Study Now!

XY-Copilot AI
Unlimited Access
Secure Payment
Instant Access
24/7 Support
Document Chat

Document Details

Subject
Statistics

Related Documents

View all