Analyzing MTA Transit Fare Trends with Linear Mode

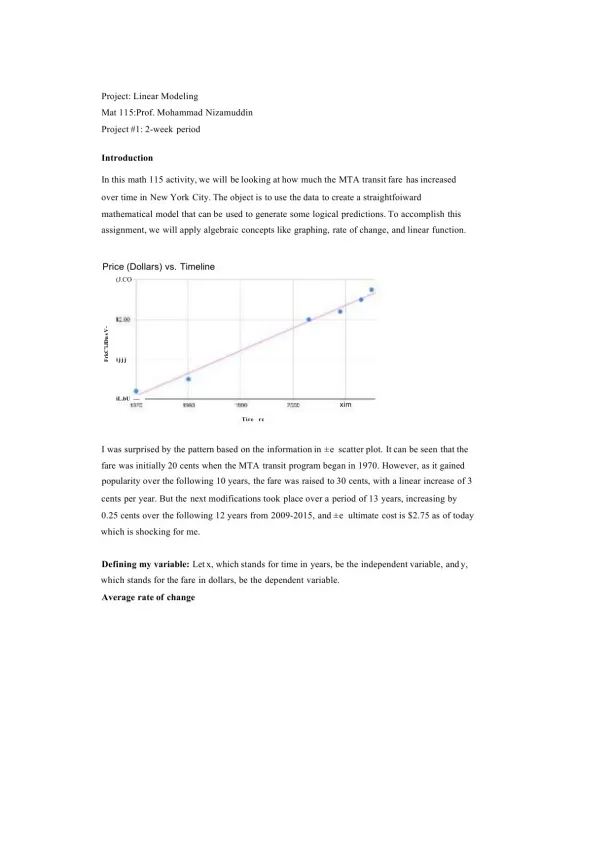
Project on modeling NYC MTA fare increases using algebra concepts like graphing, rate of change, and linear functions to predict future fare trends over a 2-week study period.

Alice Edwards
Contributor
4.1
35
5 months ago
Preview (1 of 3 Pages)
100%
Purchase to unlock

Page 1

Analyzing MTA Transit Fare Trends with Linear Mode - Page 1 preview image

Loading page image...

Project: Linear ModelingMat 115:Prof. Mohammad NizamuddinProject #1: 2-week periodIntroductionIn this math 115 activity, we will be looking at how much the MTA transit fare has increasedover time in New York City. The object is to use the data to create a straightfoiwardmathematical model that can be used to generate some logical predictions. To accomplish thisassignment, we will apply algebraic concepts like graphing, rate of change, and linear function.Price (Dollars) vs. Timeline(J.COFrkC’iJDn sV-i j j jiL.bU —ximTirercI was surprised by the pattern based on the information in ±e scatter plot. It can be seen that thefare was initially 20 cents when the MTA transit program began in 1970. However, as it gainedpopularity over the following 10 years, the fare was raised to 30 cents, with a linear increase of 3cents per year. But the next modifications took place over a period of 13 years, increasing by0.25 cents over the following 12 years from 2009-2015, and ±e ultimate cost is $2.75 as of todaywhich is shocking for me.Defining my variable:Let x, which stands for time in years, be the independent variable, and y,which stands for the fare in dollars, be the dependent variable.Average rate of change
Preview Mode

This document has 3 pages. Sign in to access the full document!

Study Now!

XY-Copilot AI
Unlimited Access
Secure Payment
Instant Access
24/7 Support
Document Chat

Document Details

Related Documents

View all