Page 1
Loading page image...
Page 2

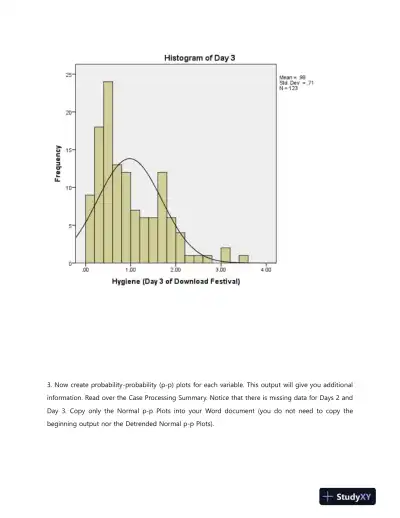
Loading page image...
Page 3
Loading page image...
Page 4
Loading page image...
Page 5
Loading page image...
Page 6
Loading page image...
Page 7
Loading page image...
Week 2 solutions on statistical assumptions and hypothesis testing.
Loading page image...
Loading page image...
Loading page image...
Loading page image...
Loading page image...
Loading page image...
Loading page image...
This document has 20 pages. Sign in to access the full document!