BTM8107-8 Week 6 Apply Repeated-Measures Correct Answers

Explores repeated-measures analysis techniques with verified solutions.

Benjamin White
Contributor
4.9
49
5 months ago
Preview (6 of 17 Pages)
100%
Purchase to unlock

Page 1

BTM8107-8 Week 6 Apply Repeated-Measures Correct Answers - Page 1 preview image

Loading page image...

BTM8107-8Week 6 Apply Repeated-MeasuresCorrectAnswersActivity #6 consists of two parts. In the first part, you will utilize an existing dataset to analyze thedataset from repeated-measures experimental design. All SPSS output should be pastedinto your Worddocument. In the second part, you will be asked to create a dataset for a hypothetical repeated-measures experimental design. Finally, you will answer questions about your hypothetical dataset.Part A. SPSS ActivityThe “Activity 6.sav” file contains a dataset of a high school teacher interested in determining whether hisstudents’ test scores increase over the course of a 12 week period. In the dataset, you will find thefollowing variables:Participant: unique identifierGender: Male (M) or Female (F)Score_0score on the initial course pre-test (first day of class)Score_2score at the end of week 2Score_4score at the end of week 4Score_6score at the end of week 6Score_8score at the end of week 8Score_10score at theend of week 10Score_12score at the end of the course (week 12)To complete this Activity1. Exploratory Data Analysis.a. Perform exploratory data analysis on the relevant variables in the dataset. When possible, includeappropriate graphs to help illustrate the dataset.b. Compose a one to two paragraph write up ofthe data.c. Create an APA style table that presents descriptive statistics for the sample.2. Repeated-Measures ANOVA. Perform a repeated-measures ANOVA using the “Activity 6.sav” data set.You will use Score_0 throughScore_12 as your repeated measure (7levels), and gender as a fixed factor.a. Is the assumption of sphericity violated? How can you tell? What does this mean in the context ofinterpreting the results?b. Is there a main effect of gender? If so, explain the effect. Use post hoc tests when necessary orexplain why they are not required in this specific case.c. Is there a main effect time (i.e., an increase in scores from Week 0 to Week 12)? If so, explain theeffect. Use post hoc tests when necessary or explain why they are not required in this specific case.Examine the output carefully and give as much detail as possible in your findings.d. Write up the results in APA style and interpret them. Be sure that you discuss both main effects andthe presence/absence of an interaction between thetwo.Part B. Applying Analytical Strategies to an Area of Research Interest3. Briefly restate your research area of interest.a. Identify at least 2 variables for which you would utilize a repeated-measures ANOVA in your analysis.Describe the variablesand their scale of measurement. Identify whether each factor is fixed or repeating.Where on the SPSS output would you look to find out if you violated the assumption of sphericity? If thedata did violate this assumption, what would the impact be on youranalysis?

Page 2

BTM8107-8 Week 6 Apply Repeated-Measures Correct Answers - Page 2 preview image

Loading page image...

Page 3

BTM8107-8 Week 6 Apply Repeated-Measures Correct Answers - Page 3 preview image

Loading page image...

Your submittal should demonstrate thoughtful consideration of the ideas and concepts that are presentedin the course and provide new thoughts and insights relating directly to this topic. Where applicable yoursubmittal should reflect scholarly writing and current APA standards.Review APA Form and Style.Be sure to adhere to Northcentral University's Academic Integrity Policy. View the Northcentral AcademicIntegrity Tutorial to refresh your knowledge of how to achieve academic integrity.Upload your assignment using the Upload Assignment button below.Learning Outcomes2.0 Develop appropriate null and alternative hypotheses given a research question.3.0 Calculate and interpret descriptive statistical analysis.4.0 Create and interpret visual displays of data.5.0 Apply appropriate statistical tests based on level of measurement.6.0 Determine the appropriate use of inferential statistical analysis.9.0 Compare and contrast parametric and non-parametric data analysis in order to apply the correctstatistical procedure.10.0 Demonstrate proficiency in the use of SPSS.11.0 Demonstrate proficiency in reporting statistical output in APA format.

Page 4

BTM8107-8 Week 6 Apply Repeated-Measures Correct Answers - Page 4 preview image

Loading page image...

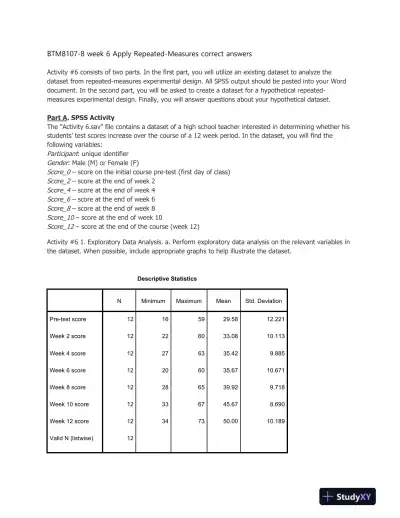
BTM8107-8 week 6ApplyRepeated-Measurescorrect answersActivity #6 consists of two parts. In the first part, you will utilize an existing dataset to analyze thedataset from repeated-measures experimental design. All SPSS output should be pasted into your Worddocument. In the second part, you will be asked tocreate a dataset for a hypothetical repeated-measures experimental design. Finally, you will answer questions about your hypothetical dataset.Part A. SPSS ActivityThe “Activity 6.sav” file contains a dataset of a high schoolteacher interested in determining whether hisstudents’ test scores increase over the course of a 12 week period. In the dataset, you will find thefollowing variables:Participant: unique identifierGender: Male (M) or Female (F)Score_0score on the initial course pre-test (first day of class)Score_2score at the end of week 2Score_4score at the end of week 4Score_6score at the end of week 6Score_8score at the end of week 8Score_10score at the end of week 10Score_12score at the end of the course (week 12)Activity #6 1. Exploratory Data Analysis. a. Perform exploratory data analysis on the relevant variables inthe dataset. When possible, include appropriate graphs to help illustrate the dataset.Descriptive StatisticsNMinimumMaximumMeanStd. DeviationPre-test score12165929.5812.221Week 2 score12226033.0810.113Week 4 score12276335.429.885Week 6 score12206035.6710.671Week 8 score12286539.929.718Week 10 score12336745.678.690Week 12 score12347350.0010.189Valid N (listwise)12

Page 5

BTM8107-8 Week 6 Apply Repeated-Measures Correct Answers - Page 5 preview image

Loading page image...

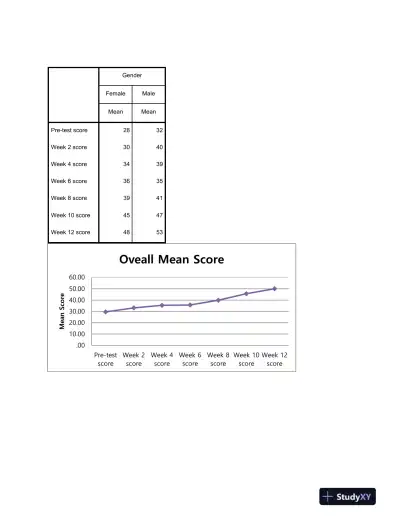
GenderFemaleMaleMeanMeanPre-test score2832Week 2 score3040Week 4 score3439Week 6 score3635Week 8 score3941Week 10 score4547Week 12 score4853.0010.0020.0030.0040.0050.0060.00Pre-testscoreWeek 2scoreWeek 4scoreWeek 6scoreWeek 8scoreWeek 10scoreWeek 12scoreMean ScoreOveall Mean Score

Page 6

BTM8107-8 Week 6 Apply Repeated-Measures Correct Answers - Page 6 preview image

Loading page image...

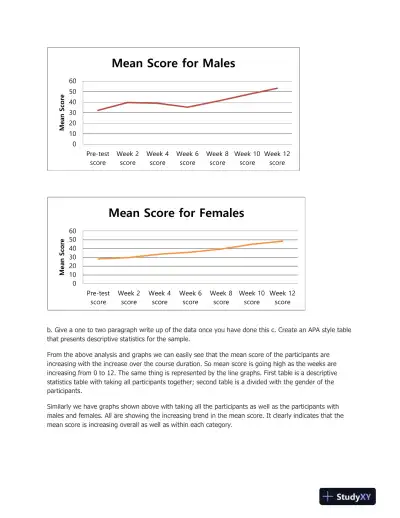
b.Give a one to two paragraph write up of the data once you have done thisc. Create an APA style tablethat presents descriptive statistics for the sample.From the above analysis and graphs we can easily see that the mean score of the participants areincreasing with the increase over the course duration. So mean score is going high as the weeks areincreasing from 0 to 12. The same thing is represented by the line graphs. First table is a descriptivestatistics table with taking all participants together; second table is a divided with the gender of theparticipants.Similarly we have graphs shown above with taking all the participants as well as the participants withmales and females. All are showing the increasing trend in the mean score. It clearly indicates that themean score is increasing overall as well as within each category.0102030405060Pre-testscoreWeek 2scoreWeek 4scoreWeek 6scoreWeek 8scoreWeek 10scoreWeek 12scoreMean ScoreMean Score for Males0102030405060Pre-testscoreWeek 2scoreWeek 4scoreWeek 6scoreWeek 8scoreWeek 10scoreWeek 12scoreMean ScoreMean Score for Females
Preview Mode

This document has 17 pages. Sign in to access the full document!

Study Now!

XY-Copilot AI
Unlimited Access
Secure Payment
Instant Access
24/7 Support
Document Chat

Document Details

Related Documents

View all