Page 1
Loading page image...
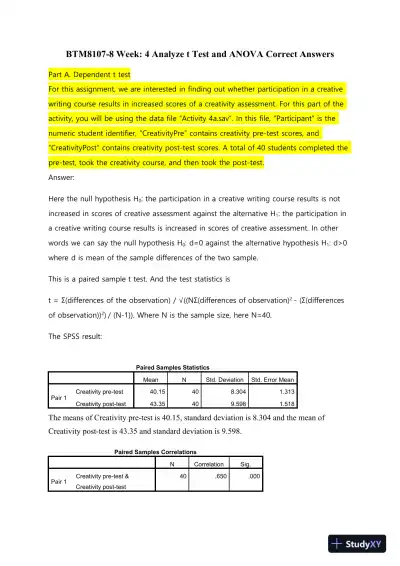
Page 2

Loading page image...
Page 3
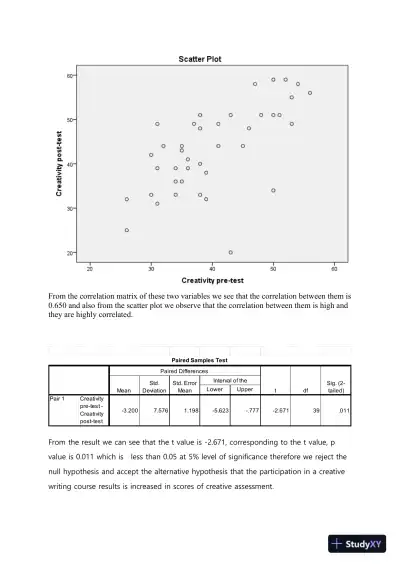
Loading page image...
Solutions for t-tests and ANOVA statistical analysis.
Loading page image...
Loading page image...
Loading page image...
This document has 7 pages. Sign in to access the full document!