Elementary Statistics: Picturing the World, 6th Edition Test Bank

Elementary Statistics: Picturing the World, 6th Edition Test Bank makes learning easy with a structured format, concise explanations, and plenty of practice material.

Eli Simmons
Contributor
4.9
34
5 months ago
Preview (16 of 285 Pages)
100%
Purchase to unlock

Page 1

Elementary Statistics: Picturing the World, 6th Edition Test Bank - Page 1 preview image

Loading page image...

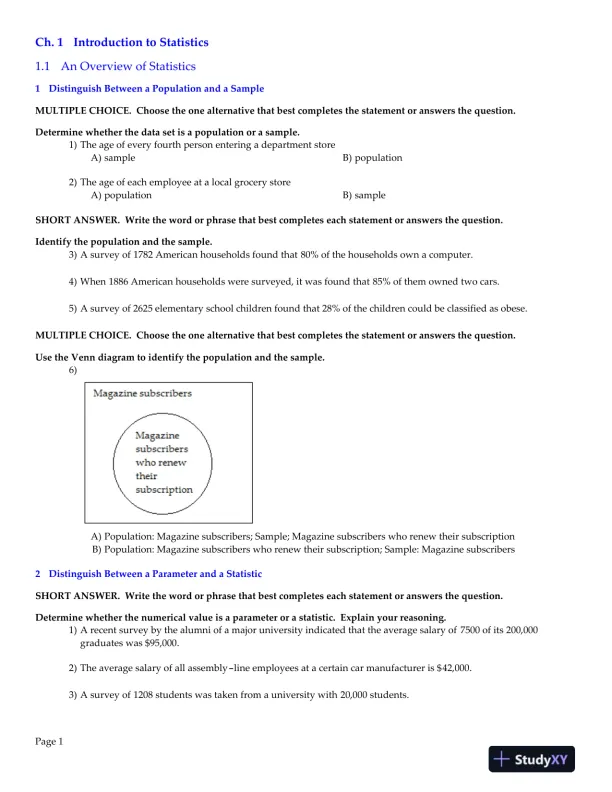
Ch.1IntroductiontoStatistics1.1AnOverviewofStatistics1DistinguishBetweenaPopulationandaSampleMULTIPLECHOICE.Choosetheonealternativethatbestcompletesthestatementoranswersthequestion.Determinewhetherthedatasetisapopulationorasample.1) TheageofeveryfourthpersonenteringadepartmentstoreA) sampleB) population2) TheageofeachemployeeatalocalgrocerystoreA) populationB) sampleSHORTANSWER.Writethewordorphrasethatbestcompleteseachstatementoranswersthequestion.Identifythepopulationandthesample.3) Asurveyof1782Americanhouseholdsfoundthat80%ofthehouseholdsownacomputer.4) When1886Americanhouseholdsweresurveyed,itwasfoundthat85%ofthemownedtwocars.5) Asurveyof2625elementaryschoolchildrenfoundthat28%ofthechildrencouldbeclassifiedasobese.MULTIPLECHOICE.Choosetheonealternativethatbestcompletesthestatementoranswersthequestion.UsetheVenndiagramtoidentifythepopulationandthesample.6)A) Population:Magazinesubscribers;Sample;MagazinesubscriberswhorenewtheirsubscriptionB) Population:Magazinesubscriberswhorenewtheirsubscription;Sample:Magazinesubscribers2DistinguishBetweenaParameterandaStatisticSHORTANSWER.Writethewordorphrasethatbestcompleteseachstatementoranswersthequestion.Determinewhetherthenumericalvalueisaparameterorastatistic.Explainyourreasoning.1) Arecentsurveybythealumniofamajoruniversityindicatedthattheaveragesalaryof7500ofits200,000graduateswas$95,000.2) Theaveragesalaryofallassembly-lineemployeesatacertaincarmanufactureris$42,000.3) Asurveyof1208studentswastakenfromauniversitywith20,000 students.Page1

Page 2

Elementary Statistics: Picturing the World, 6th Edition Test Bank - Page 2 preview image

Loading page image...

Page 3

Elementary Statistics: Picturing the World, 6th Edition Test Bank - Page 3 preview image

Loading page image...

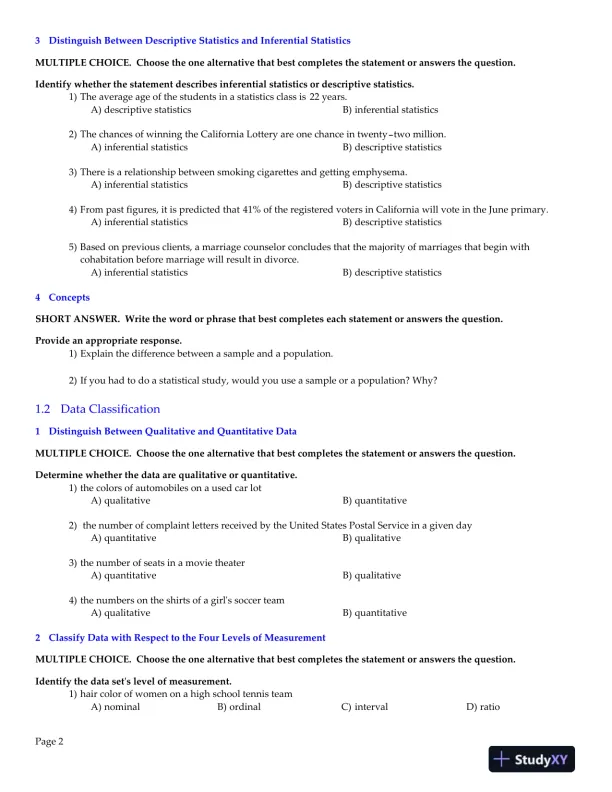
3DistinguishBetweenDescriptiveStatisticsandInferentialStatisticsMULTIPLECHOICE.Choosetheonealternativethatbestcompletesthestatementoranswersthequestion.Identifywhetherthestatementdescribesinferentialstatisticsordescriptivestatistics.1) Theaverageageofthestudentsinastatisticsclassis22 years.A) descriptivestatisticsB) inferentialstatistics2) ThechancesofwinningtheCaliforniaLotteryareonechanceintwenty-twomillion.A) inferentialstatisticsB) descriptivestatistics3) Thereisarelationshipbetweensmokingcigarettesandgettingemphysema.A) inferentialstatisticsB) descriptivestatistics4) Frompastfigures,itispredictedthat41%oftheregisteredvotersinCaliforniawillvoteintheJuneprimary.A) inferentialstatisticsB) descriptivestatistics5) Basedonpreviousclients,amarriagecounselorconcludesthatthemajorityofmarriagesthatbeginwithcohabitationbeforemarriagewillresultindivorce.A) inferentialstatisticsB) descriptivestatistics4ConceptsSHORTANSWER.Writethewordorphrasethatbestcompleteseachstatementoranswersthequestion.Provideanappropriateresponse.1) Explainthedifferencebetweenasampleandapopulation.2) Ifyouhadtodoastatisticalstudy,wouldyouuseasampleorapopulation?Why?1.2DataClassification1DistinguishBetweenQualitativeandQuantitativeDataMULTIPLECHOICE.Choosetheonealternativethatbestcompletesthestatementoranswersthequestion.Determinewhetherthedataarequalitativeorquantitative.1) thecolorsofautomobilesonausedcarlotA) qualitativeB) quantitative2)thenumberofcomplaintlettersreceivedbytheUnitedStatesPostalServiceinagivendayA) quantitativeB) qualitative3) thenumberofseatsinamovietheaterA) quantitativeB) qualitative4) thenumbersontheshirtsofagirlʹssoccerteamA) qualitativeB) quantitative2ClassifyDatawithRespecttotheFourLevelsofMeasurementMULTIPLECHOICE.Choosetheonealternativethatbestcompletesthestatementoranswersthequestion.Identifythedatasetʹslevelofmeasurement.1) haircolorofwomenonahighschooltennisteamA) nominalB) ordinalC) intervalD) ratioPage2

Page 4

Elementary Statistics: Picturing the World, 6th Edition Test Bank - Page 4 preview image

Loading page image...

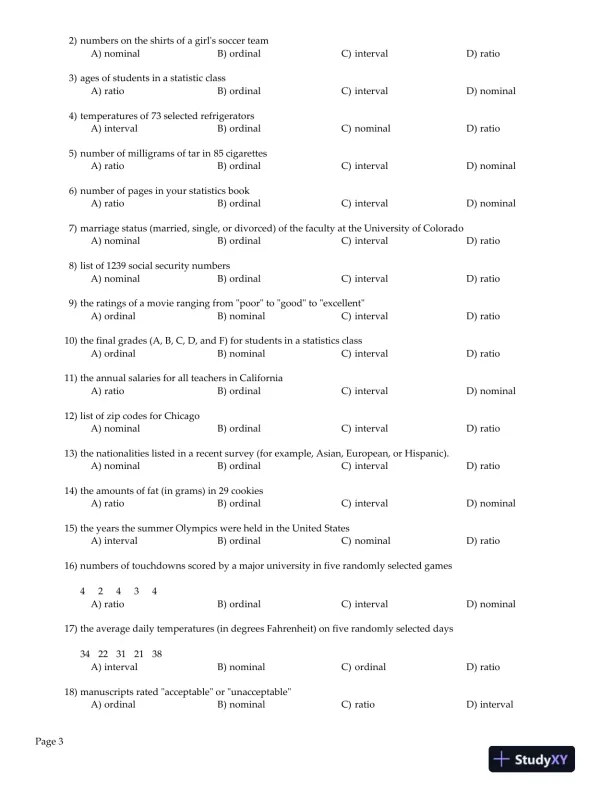
2) numbersontheshirtsofagirlʹssoccerteamA) nominalB) ordinalC) intervalD) ratio3) agesofstudentsinastatisticclassA) ratioB) ordinalC) intervalD) nominal4) temperaturesof73selectedrefrigeratorsA) intervalB) ordinalC) nominalD) ratio5) numberofmilligramsoftarin85cigarettesA) ratioB) ordinalC) intervalD) nominal6) numberofpagesinyourstatisticsbookA) ratioB) ordinalC) intervalD) nominal7) marriagestatus(married,single,ordivorced)ofthefacultyattheUniversityofColoradoA) nominalB) ordinalC) intervalD) ratio8) listof1239socialsecuritynumbersA) nominalB) ordinalC) intervalD) ratio9) theratingsofamovierangingfromʺpoorʺtoʺgoodʺtoʺexcellentʺA) ordinalB) nominalC) intervalD) ratio10) thefinalgrades(A,B,C,D,andF)forstudentsinastatisticsclassA) ordinalB) nominalC) intervalD) ratio11) theannualsalariesforallteachersinCaliforniaA) ratioB) ordinalC) intervalD) nominal12) listofzipcodesforChicagoA) nominalB) ordinalC) intervalD) ratio13) thenationalitieslistedinarecentsurvey(forexample,Asian,European,orHispanic).A) nominalB) ordinalC) intervalD) ratio14) theamountsoffat(ingrams)in29cookiesA) ratioB) ordinalC) intervalD) nominal15) theyearsthesummerOlympicswereheldintheUnitedStatesA) intervalB) ordinalC) nominalD) ratio16) numbersoftouchdownsscoredbyamajoruniversityinfiverandomlyselectedgames42434A) ratioB) ordinalC) intervalD) nominal17) theaveragedailytemperatures(indegreesFahrenheit)onfiverandomlyselecteddays3422312138A) intervalB) nominalC) ordinalD) ratio18) manuscriptsratedʺacceptableʺorʺunacceptableʺA) ordinalB) nominalC) ratioD) intervalPage3

Page 5

Elementary Statistics: Picturing the World, 6th Edition Test Bank - Page 5 preview image

Loading page image...

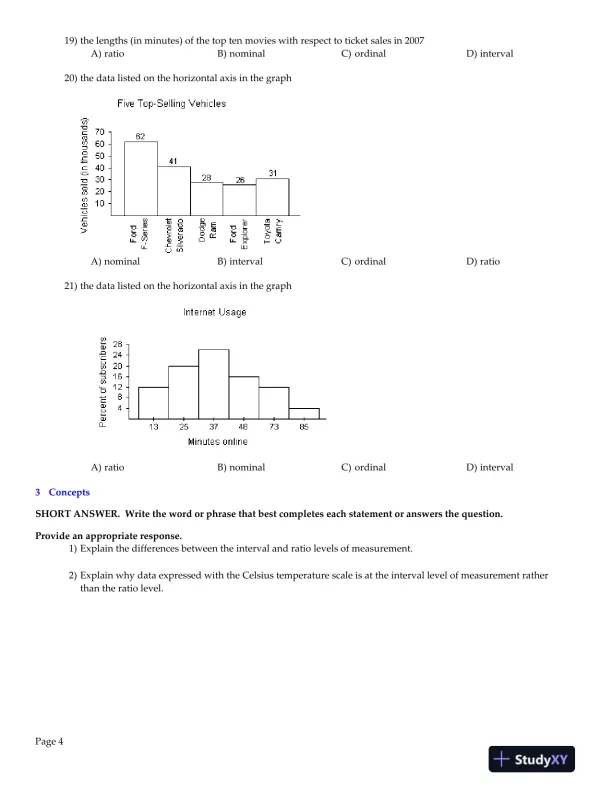
19) thelengths(inminutes)ofthetoptenmovieswithrespecttoticketsalesin2007A) ratioB) nominalC) ordinalD) interval20) thedatalistedonthehorizontalaxisinthegraphA) nominalB) intervalC) ordinalD) ratio21) thedatalistedonthehorizontalaxisinthegraphA) ratioB) nominalC) ordinalD) interval3ConceptsSHORTANSWER.Writethewordorphrasethatbestcompleteseachstatementoranswersthequestion.Provideanappropriateresponse.1) Explainthedifferencesbetweentheintervalandratiolevelsofmeasurement.2) ExplainwhydataexpressedwiththeCelsiustemperaturescaleisattheintervallevelofmeasurementratherthantheratiolevel.Page4

Page 6

Elementary Statistics: Picturing the World, 6th Edition Test Bank - Page 6 preview image

Loading page image...

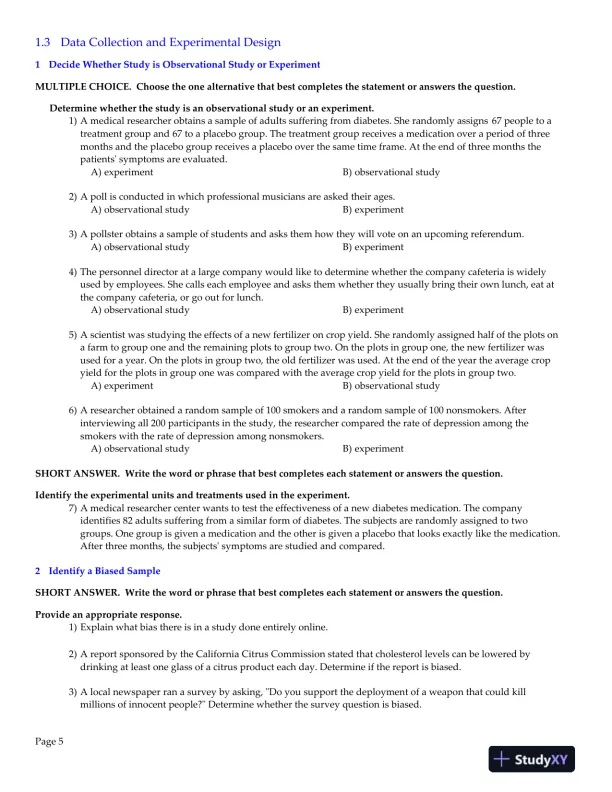
1.3DataCollectionandExperimentalDesign1DecideWhetherStudyisObservationalStudyorExperimentMULTIPLECHOICE.Choosetheonealternativethatbestcompletesthestatementoranswersthequestion.Determinewhetherthestudyisanobservationalstudyoranexperiment.1) Amedicalresearcherobtainsasampleofadultssufferingfromdiabetes.Sherandomlyassigns67 peopletoatreatmentgroupand67toaplacebogroup.Thetreatmentgroupreceivesamedicationoveraperiodofthreemonthsandtheplacebogroupreceivesaplacebooverthesametimeframe.Attheendofthreemonthsthepatientsʹsymptomsareevaluated.A) experimentB) observationalstudy2) Apollisconductedinwhichprofessionalmusiciansareaskedtheirages.A) observationalstudyB) experiment3) Apollsterobtainsasampleofstudentsandasksthemhowtheywillvoteonanupcomingreferendum.A) observationalstudyB) experiment4) Thepersonneldirectoratalargecompanywouldliketodeterminewhetherthecompanycafeteriaiswidelyusedbyemployees.Shecallseachemployeeandasksthemwhethertheyusuallybringtheirownlunch,eatatthecompanycafeteria,orgooutforlunch.A) observationalstudyB) experiment5) Ascientistwasstudyingtheeffectsofanewfertilizeroncropyield.Sherandomlyassignedhalfoftheplotsonafarmtogrouponeandtheremainingplotstogrouptwo.Ontheplotsingroupone,thenewfertilizerwasusedforayear.Ontheplotsingrouptwo,theoldfertilizerwasused.Attheendoftheyeartheaveragecropyieldfortheplotsingrouponewascomparedwiththeaveragecropyieldfortheplotsingrouptwo.A) experimentB) observationalstudy6) Aresearcherobtainedarandomsampleof100smokersandarandomsampleof100nonsmokers.Afterinterviewingall200participantsinthestudy,theresearchercomparedtherateofdepressionamongthesmokerswiththerateofdepressionamongnonsmokers.A) observationalstudyB) experimentSHORTANSWER.Writethewordorphrasethatbestcompleteseachstatementoranswersthequestion.Identifytheexperimentalunitsandtreatmentsusedintheexperiment.7) Amedicalresearchercenterwantstotesttheeffectivenessofanewdiabetesmedication.Thecompanyidentifies82adultssufferingfromasimilarformofdiabetes.Thesubjectsarerandomlyassignedtotwogroups.Onegroupisgivenamedicationandtheotherisgivenaplacebothatlooksexactlylikethemedication.Afterthreemonths,thesubjectsʹsymptomsarestudiedandcompared.2IdentifyaBiasedSampleSHORTANSWER.Writethewordorphrasethatbestcompleteseachstatementoranswersthequestion.Provideanappropriateresponse.1) Explainwhatbiasthereisinastudydoneentirelyonline.2) AreportsponsoredbytheCaliforniaCitrusCommissionstatedthatcholesterollevelscanbeloweredbydrinkingatleastoneglassofacitrusproducteachday.Determineifthereportisbiased.3) Alocalnewspaperranasurveybyasking,ʺDoyousupportthedeploymentofaweaponthatcouldkillmillionsofinnocentpeople?ʺDeterminewhetherthesurveyquestionisbiased.Page5

Page 7

Elementary Statistics: Picturing the World, 6th Edition Test Bank - Page 7 preview image

Loading page image...

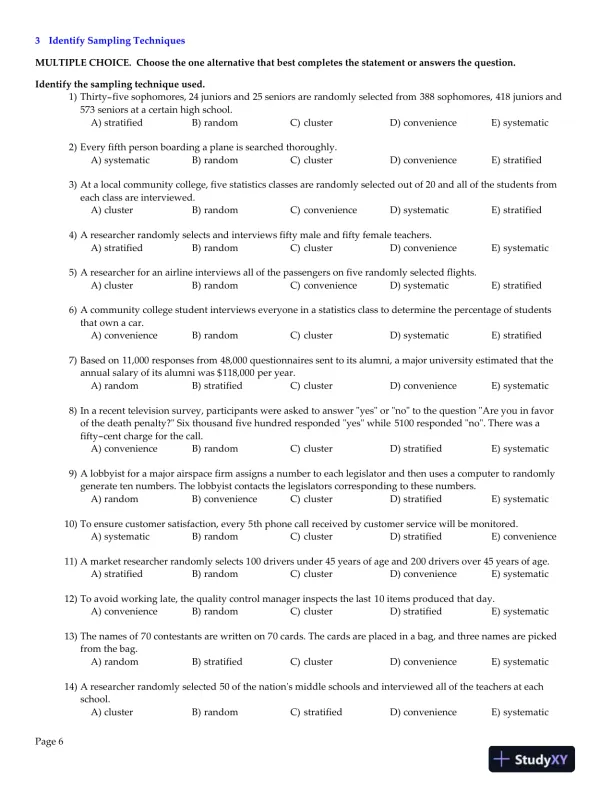
3IdentifySamplingTechniquesMULTIPLECHOICE.Choosetheonealternativethatbestcompletesthestatementoranswersthequestion.Identifythesamplingtechniqueused.1) Thirty-fivesophomores,24juniorsand25 seniorsarerandomlyselectedfrom388sophomores,418 juniorsand573seniorsatacertainhighschool.A) stratifiedB) randomC) clusterD) convenienceE) systematic2) Everyfifthpersonboardingaplaneissearchedthoroughly.A) systematicB) randomC) clusterD) convenienceE) stratified3) Atalocalcommunitycollege,fivestatisticsclassesarerandomlyselectedoutof20andallofthestudentsfromeachclassareinterviewed.A) clusterB) randomC) convenienceD) systematicE) stratified4) Aresearcherrandomlyselectsandinterviewsfiftymaleandfiftyfemaleteachers.A) stratifiedB) randomC) clusterD) convenienceE) systematic5) Aresearcherforanairlineinterviewsallofthepassengersonfiverandomlyselectedflights.A) clusterB) randomC) convenienceD) systematicE) stratified6) Acommunitycollegestudentinterviewseveryoneinastatisticsclasstodeterminethepercentageofstudentsthatownacar.A) convenienceB) randomC) clusterD) systematicE) stratified7) Basedon11,000responsesfrom48,000 questionnairessenttoitsalumni,amajoruniversityestimatedthattheannualsalaryofitsalumniwas$118,000peryear.A) randomB) stratifiedC) clusterD) convenienceE) systematic8) Inarecenttelevisionsurvey,participantswereaskedtoanswerʺyesʺorʺnoʺtothequestionʺAreyouinfavorofthedeathpenalty?ʺSixthousandfivehundredrespondedʺyesʺwhile5100respondedʺnoʺ.Therewasafifty-centchargeforthecall.A) convenienceB) randomC) clusterD) stratifiedE) systematic9) Alobbyistforamajorairspacefirmassignsanumbertoeachlegislatorandthenusesacomputertorandomlygeneratetennumbers.Thelobbyistcontactsthelegislatorscorrespondingtothesenumbers.A) randomB) convenienceC) clusterD) stratifiedE) systematic10) Toensurecustomersatisfaction,every5thphonecallreceivedbycustomerservicewillbemonitored.A) systematicB) randomC) clusterD) stratifiedE) convenience11) Amarketresearcherrandomlyselects100driversunder45 yearsofageand200driversover45 yearsofage.A) stratifiedB) randomC) clusterD) convenienceE) systematic12) Toavoidworkinglate,thequalitycontrolmanagerinspectsthelast10itemsproducedthatday.A) convenienceB) randomC) clusterD) stratifiedE) systematic13) Thenamesof70contestantsarewrittenon70cards.Thecardsareplacedinabag,andthreenamesarepickedfromthebag.A) randomB) stratifiedC) clusterD) convenienceE) systematic14) Aresearcherrandomlyselected50ofthenationʹsmiddleschoolsandinterviewedalloftheteachersateachschool.A) clusterB) randomC) stratifiedD) convenienceE) systematicPage6

Page 8

Elementary Statistics: Picturing the World, 6th Edition Test Bank - Page 8 preview image

Loading page image...

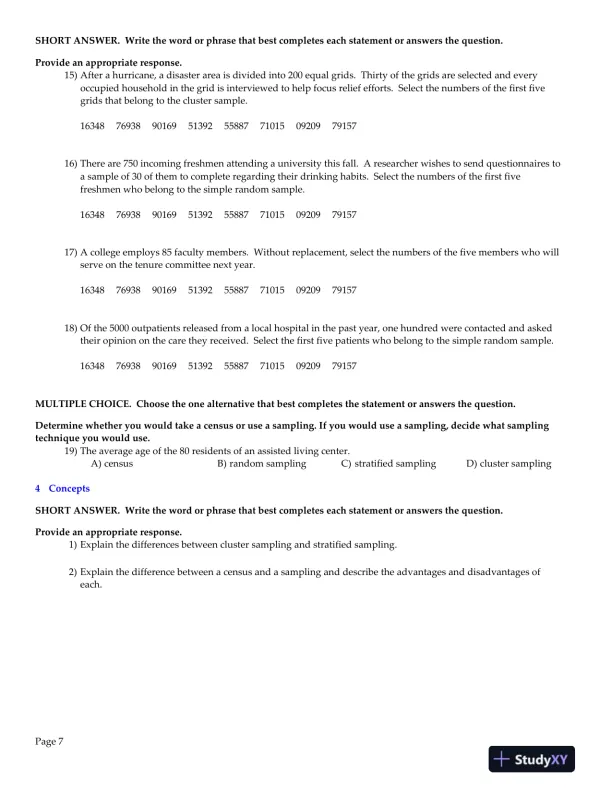
SHORTANSWER.Writethewordorphrasethatbestcompleteseachstatementoranswersthequestion.Provideanappropriateresponse.15) Afterahurricane,adisasterareaisdividedinto200equalgrids.Thirtyofthegridsareselectedandeveryoccupiedhouseholdinthegridisinterviewedtohelpfocusreliefefforts.Selectthenumbersofthefirstfivegridsthatbelongtotheclustersample.163487693890169513925588771015092097915716) Thereare750incomingfreshmenattendingauniversitythisfall.Aresearcherwishestosendquestionnairestoasampleof30ofthemtocompleteregardingtheirdrinkinghabits.Selectthenumbersofthefirstfivefreshmenwhobelongtothesimplerandomsample.163487693890169513925588771015092097915717) Acollegeemploys85facultymembers.Withoutreplacement,selectthenumbersofthefivememberswhowillserveonthetenurecommitteenextyear.163487693890169513925588771015092097915718) Ofthe5000outpatientsreleasedfromalocalhospitalinthepastyear,onehundredwerecontactedandaskedtheiropiniononthecaretheyreceived.Selectthefirstfivepatientswhobelongtothesimplerandomsample.1634876938901695139255887710150920979157MULTIPLECHOICE.Choosetheonealternativethatbestcompletesthestatementoranswersthequestion.Determinewhetheryouwouldtakeacensusoruseasampling.Ifyouwoulduseasampling,decidewhatsamplingtechniqueyouwoulduse.19) Theaverageageofthe80residentsofanassistedlivingcenter.A) censusB) randomsamplingC) stratifiedsamplingD) clustersampling4ConceptsSHORTANSWER.Writethewordorphrasethatbestcompleteseachstatementoranswersthequestion.Provideanappropriateresponse.1) Explainthedifferencesbetweenclustersamplingandstratifiedsampling.2) Explainthedifferencebetweenacensusandasamplinganddescribetheadvantagesanddisadvantagesofeach.Page7

Page 9

Elementary Statistics: Picturing the World, 6th Edition Test Bank - Page 9 preview image

Loading page image...

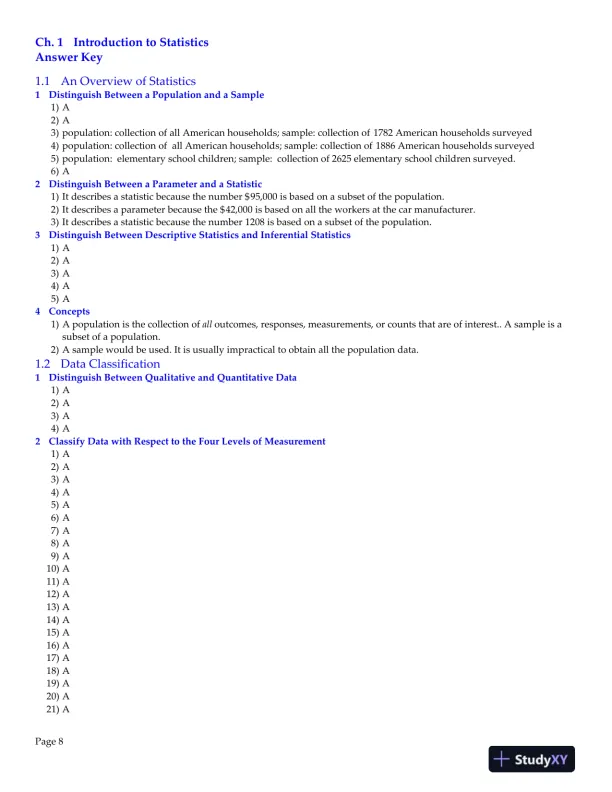
Ch.1IntroductiontoStatisticsAnswerKey1.1AnOverviewofStatistics1DistinguishBetweenaPopulationandaSample1) A2) A3) population:collectionofallAmericanhouseholds;sample:collectionof1782 Americanhouseholdssurveyed4) population:collectionofallAmericanhouseholds;sample:collectionof1886 Americanhouseholdssurveyed5) population:elementaryschoolchildren;sample:collectionof2625elementaryschoolchildrensurveyed.6) A2DistinguishBetweenaParameterandaStatistic1) Itdescribesastatisticbecausethenumber$95,000 isbasedonasubsetofthepopulation.2) Itdescribesaparameterbecausethe$42,000 isbasedonalltheworkersatthecarmanufacturer.3) Itdescribesastatisticbecausethenumber1208 isbasedonasubsetofthepopulation.3DistinguishBetweenDescriptiveStatisticsandInferentialStatistics1) A2) A3) A4) A5) A4Concepts1) Apopulationisthecollectionofalloutcomes,responses,measurements,orcountsthatareofinterest..Asampleisasubsetofapopulation.2) Asamplewouldbeused.Itisusuallyimpracticaltoobtainallthepopulationdata.1.2DataClassification1DistinguishBetweenQualitativeandQuantitativeData1) A2) A3) A4) A2ClassifyDatawithRespecttotheFourLevelsofMeasurement1) A2) A3) A4) A5) A6) A7) A8) A9) A10) A11) A12) A13) A14) A15) A16) A17) A18) A19) A20) A21) APage8

Page 10

Elementary Statistics: Picturing the World, 6th Edition Test Bank - Page 10 preview image

Loading page image...

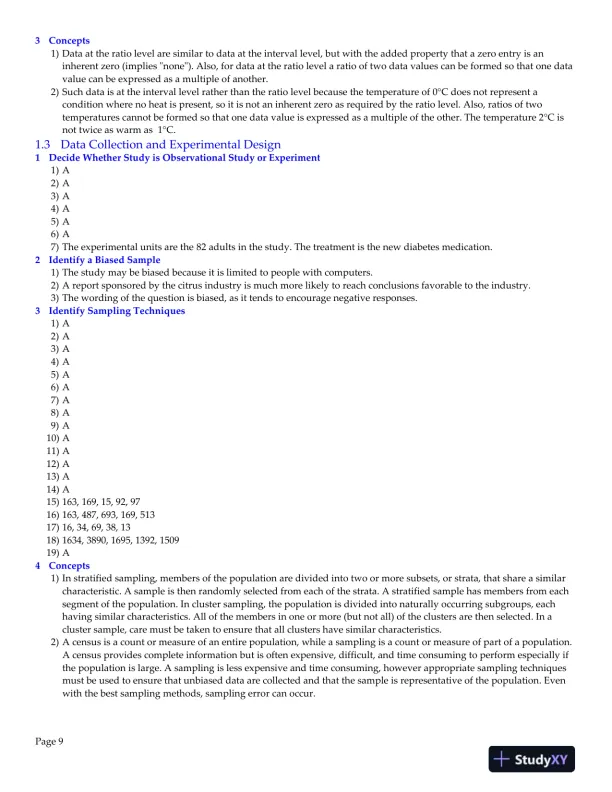
3Concepts1) Dataattheratiolevelaresimilartodataattheintervallevel,butwiththeaddedpropertythatazeroentryisaninherentzero(impliesʺnoneʺ).Also,fordataattheratiolevelaratiooftwodatavaluescanbeformedsothatonedatavaluecanbeexpressedasamultipleofanother.2) Suchdataisattheintervallevelratherthantheratiolevelbecausethetemperatureof0°Cdoesnotrepresentaconditionwherenoheatispresent,soitisnotaninherentzeroasrequiredbytheratiolevel.Also,ratiosoftwotemperaturescannotbeformedsothatonedatavalueisexpressedasamultipleoftheother.Thetemperature2°Cisnottwiceaswarmas1°C.1.3DataCollectionandExperimentalDesign1DecideWhetherStudyisObservationalStudyorExperiment1) A2) A3) A4) A5) A6) A7) Theexperimentalunitsarethe82adultsinthestudy.Thetreatmentisthenewdiabetesmedication.2IdentifyaBiasedSample1) Thestudymaybebiasedbecauseitislimitedtopeoplewithcomputers.2) Areportsponsoredbythecitrusindustryismuchmorelikelytoreachconclusionsfavorabletotheindustry.3) Thewordingofthequestionisbiased,asittendstoencouragenegativeresponses.3IdentifySamplingTechniques1) A2) A3) A4) A5) A6) A7) A8) A9) A10) A11) A12) A13) A14) A15) 163,169,15,92,9716) 163,487,693,169,51317) 16,34,69,38,1318) 1634,3890,1695,1392,150919) A4Concepts1) Instratifiedsampling,membersofthepopulationaredividedintotwoormoresubsets,orstrata,thatshareasimilarcharacteristic.Asampleisthenrandomlyselectedfromeachofthestrata.Astratifiedsamplehasmembersfromeachsegmentofthepopulation.Inclustersampling,thepopulationisdividedintonaturallyoccurringsubgroups,eachhavingsimilarcharacteristics.Allofthemembersinoneormore(butnotall)oftheclustersarethenselected.Inaclustersample,caremustbetakentoensurethatallclustershavesimilarcharacteristics.2) Acensusisacountormeasureofanentirepopulation,whileasamplingisacountormeasureofpartofapopulation.Acensusprovidescompleteinformationbutisoftenexpensive,difficult,andtimeconsumingtoperformespeciallyifthepopulationislarge.Asamplingislessexpensiveandtimeconsuming,howeverappropriatesamplingtechniquesmustbeusedtoensurethatunbiaseddataarecollectedandthatthesampleisrepresentativeofthepopulation.Evenwiththebestsamplingmethods,samplingerrorcanoccur.Page9

Page 11

Elementary Statistics: Picturing the World, 6th Edition Test Bank - Page 11 preview image

Loading page image...

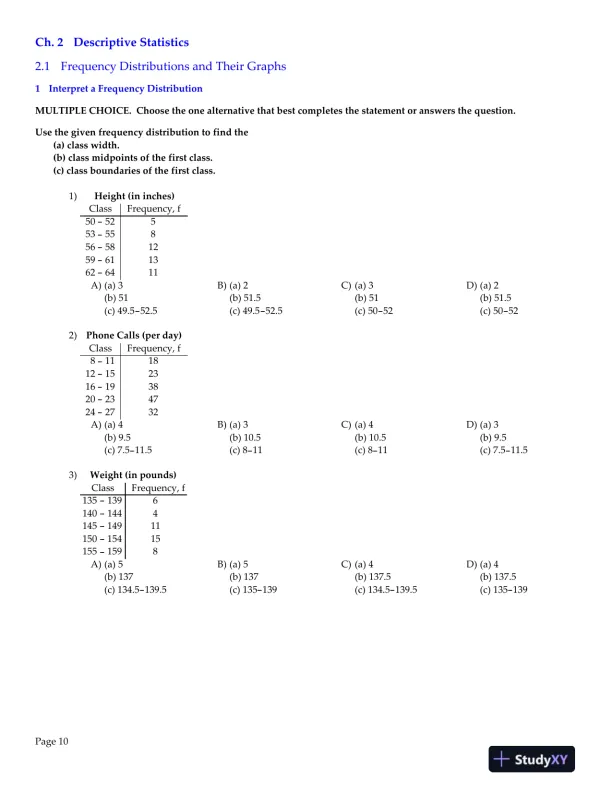
Ch.2DescriptiveStatistics2.1FrequencyDistributionsandTheirGraphs1InterpretaFrequencyDistributionMULTIPLECHOICE.Choosetheonealternativethatbestcompletesthestatementoranswersthequestion.Usethegivenfrequencydistributiontofindthe(a)classwidth.(b)classmidpointsofthefirstclass.(c)classboundariesofthefirstclass.1)Height(ininches)ClassFrequency,f50-52553-55856-581259-611362-6411A) (a)3(b)51(c)49.5-52.5B) (a)2(b)51.5(c)49.5-52.5C) (a)3(b)51(c)50-52D) (a)2(b)51.5(c)50-522)PhoneCalls(perday)ClassFrequency,f8-111812-152316-193820-234724-2732A) (a)4(b)9.5(c)7.5-11.5B) (a)3(b)10.5(c)8-11C) (a)4(b)10.5(c)8-11D) (a)3(b)9.5(c)7.5-11.53)Weight(inpounds)ClassFrequency,f135-1396140-1444145-14911150-15415155-1598A) (a)5(b)137(c)134.5-139.5B) (a)5(b)137(c)135-139C) (a)4(b)137.5(c)134.5-139.5D) (a)4(b)137.5(c)135-139Page10

Page 12

Elementary Statistics: Picturing the World, 6th Edition Test Bank - Page 12 preview image

Loading page image...

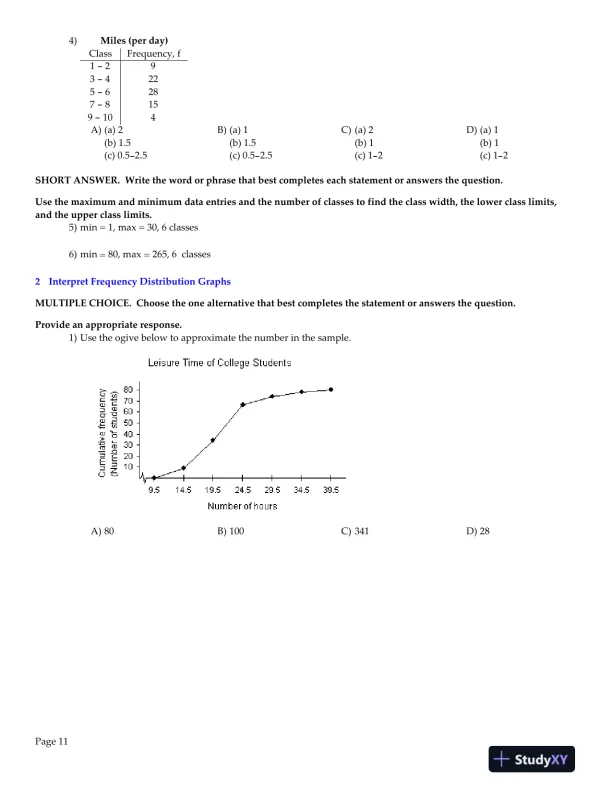
4)Miles(perday)ClassFrequency,f1-293-4225-6287-8159-104A) (a)2(b)1.5(c)0.5-2.5B) (a)1(b)1.5(c)0.5-2.5C) (a)2(b)1(c)1-2D) (a)1(b)1(c)1-2SHORTANSWER.Writethewordorphrasethatbestcompleteseachstatementoranswersthequestion.Usethemaximumandminimumdataentriesandthenumberofclassestofindtheclasswidth,thelowerclasslimits,andtheupperclasslimits.5) min=1,max=30,6classes6) min=80,max=265,6classes2InterpretFrequencyDistributionGraphsMULTIPLECHOICE.Choosetheonealternativethatbestcompletesthestatementoranswersthequestion.Provideanappropriateresponse.1) Usetheogivebelowtoapproximatethenumberinthesample.A) 80B) 100C) 341D) 28Page11

Page 13

Elementary Statistics: Picturing the World, 6th Edition Test Bank - Page 13 preview image

Loading page image...

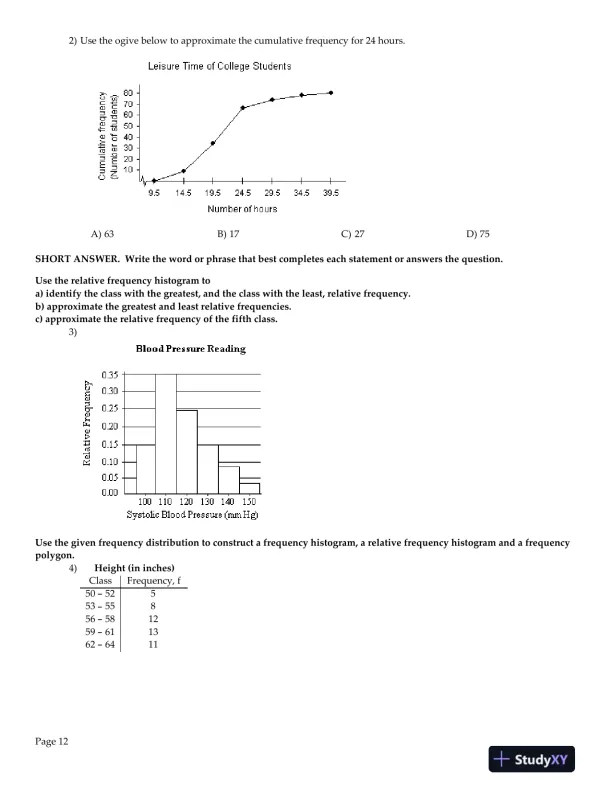
2) Usetheogivebelowtoapproximatethecumulativefrequencyfor24hours.A) 63B) 17C) 27D) 75SHORTANSWER.Writethewordorphrasethatbestcompleteseachstatementoranswersthequestion.Usetherelativefrequencyhistogramtoa)identifytheclasswiththegreatest,andtheclasswiththeleast,relativefrequency.b)approximatethegreatestandleastrelativefrequencies.c)approximatetherelativefrequencyofthefifthclass.3)Usethegivenfrequencydistributiontoconstructafrequencyhistogram,arelativefrequencyhistogramandafrequencypolygon.4)Height(ininches)ClassFrequency,f50-52553-55856-581259-611362-6411Page12

Page 14

Elementary Statistics: Picturing the World, 6th Edition Test Bank - Page 14 preview image

Loading page image...

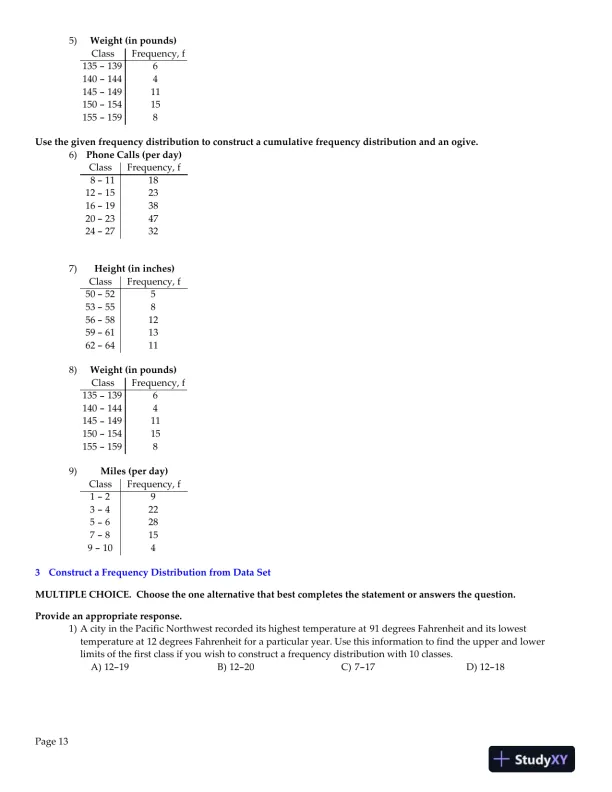
5)Weight(inpounds)ClassFrequency,f135-1396140-1444145-14911150-15415155-1598Usethegivenfrequencydistributiontoconstructacumulativefrequencydistributionandanogive.6)PhoneCalls(perday)ClassFrequency,f8-111812-152316-193820-234724-27327)Height(ininches)ClassFrequency,f50-52553-55856-581259-611362-64118)Weight(inpounds)ClassFrequency,f135-1396140-1444145-14911150-15415155-15989)Miles(perday)ClassFrequency,f1-293-4225-6287-8159-1043ConstructaFrequencyDistributionfromDataSetMULTIPLECHOICE.Choosetheonealternativethatbestcompletesthestatementoranswersthequestion.Provideanappropriateresponse.1) AcityinthePacificNorthwestrecordeditshighesttemperatureat91 degreesFahrenheitanditslowesttemperatureat12degreesFahrenheitforaparticularyear.Usethisinformationtofindtheupperandlowerlimitsofthefirstclassifyouwishtoconstructafrequencydistributionwith10classes.A) 12-19B) 12-20C) 7-17D) 12-18Page13

Page 15

Elementary Statistics: Picturing the World, 6th Edition Test Bank - Page 15 preview image

Loading page image...

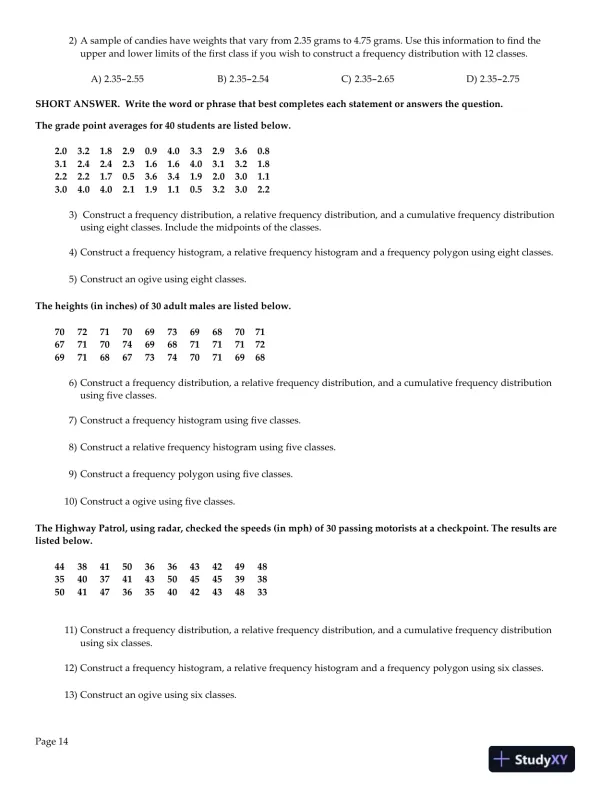
2) Asampleofcandieshaveweightsthatvaryfrom2.35gramsto4.75grams.Usethisinformationtofindtheupperandlowerlimitsofthefirstclassifyouwishtoconstructafrequencydistributionwith12classes.A) 2.35-2.55B) 2.35-2.54C) 2.35-2.65D) 2.35-2.75SHORTANSWER.Writethewordorphrasethatbestcompleteseachstatementoranswersthequestion.Thegradepointaveragesfor40studentsarelistedbelow.2.03.21.82.90.94.03.32.93.60.83.12.42.42.31.61.64.03.13.21.82.22.21.70.53.63.41.92.03.01.13.04.04.02.11.91.10.53.23.02.23)Constructafrequencydistribution,arelativefrequencydistribution,andacumulativefrequencydistributionusingeightclasses.Includethemidpointsoftheclasses.4) Constructafrequencyhistogram,arelativefrequencyhistogramandafrequencypolygonusingeightclasses.5) Constructanogiveusingeightclasses.Theheights(ininches)of30adultmalesarelistedbelow.7072717069736968707167717074696871717172697168677374707169686) Constructafrequencydistribution,arelativefrequencydistribution,andacumulativefrequencydistributionusingfiveclasses.7) Constructafrequencyhistogramusingfiveclasses.8) Constructarelativefrequencyhistogramusingfiveclasses.9) Constructafrequencypolygonusingfiveclasses.10) Constructaogiveusingfiveclasses.TheHighwayPatrol,usingradar,checkedthespeeds(inmph)of30passingmotoristsatacheckpoint.Theresultsarelistedbelow.44384150363643424948354037414350454539385041473635404243483311) Constructafrequencydistribution,arelativefrequencydistribution,andacumulativefrequencydistributionusingsixclasses.12) Constructafrequencyhistogram,arelativefrequencyhistogramandafrequencypolygonusingsixclasses.13) Constructanogiveusingsixclasses.Page14

Page 16

Elementary Statistics: Picturing the World, 6th Edition Test Bank - Page 16 preview image

Loading page image...

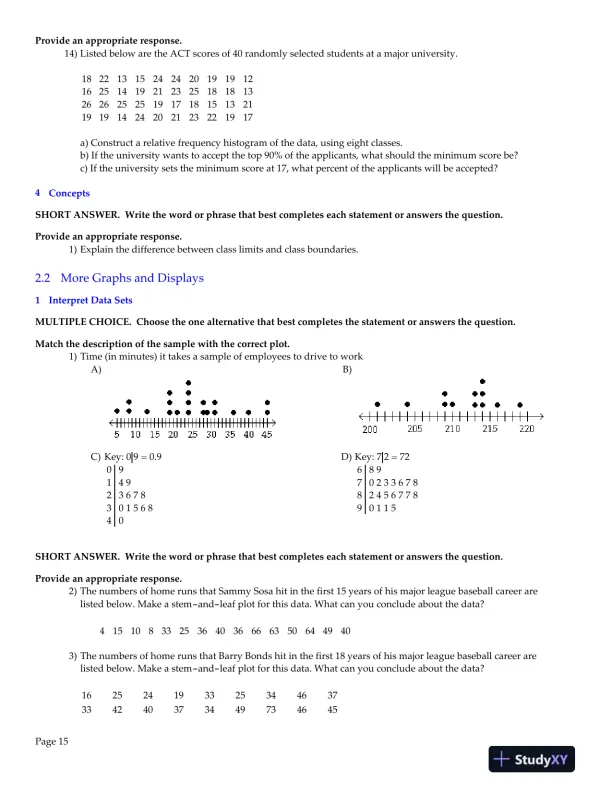
Provideanappropriateresponse.14) ListedbelowaretheACTscoresof40randomlyselectedstudentsatamajoruniversity.18221315242420191912162514192123251818132626252519171815132119191424202123221917a)Constructarelativefrequencyhistogramofthedata,usingeightclasses.b)Iftheuniversitywantstoacceptthetop90%oftheapplicants,whatshouldtheminimumscorebe?c)Iftheuniversitysetstheminimumscoreat17,whatpercentoftheapplicantswillbeaccepted?4ConceptsSHORTANSWER.Writethewordorphrasethatbestcompleteseachstatementoranswersthequestion.Provideanappropriateresponse.1) Explainthedifferencebetweenclasslimitsandclassboundaries.2.2MoreGraphsandDisplays1InterpretDataSetsMULTIPLECHOICE.Choosetheonealternativethatbestcompletesthestatementoranswersthequestion.Matchthedescriptionofthesamplewiththecorrectplot.1) Time(inminutes)ittakesasampleofemployeestodrivetoworkA)B)C) Key:0 9=0.9012349493678015680D) Key:7 2=72678989023367824567780115SHORTANSWER.Writethewordorphrasethatbestcompleteseachstatementoranswersthequestion.Provideanappropriateresponse.2) ThenumbersofhomerunsthatSammySosahitinthefirst15yearsofhismajorleaguebaseballcareerarelistedbelow.Makeastem-and-leafplotforthisdata.Whatcanyouconcludeaboutthedata?41510833253640366663506449403) ThenumbersofhomerunsthatBarryBondshitinthefirst18yearsofhismajorleaguebaseballcareerarelistedbelow.Makeastem-and-leafplotforthisdata.Whatcanyouconcludeaboutthedata?162524193325344637334240373449734645Page15
Preview Mode

This document has 285 pages. Sign in to access the full document!

Study Now!

XY-Copilot AI
Unlimited Access
Secure Payment
Instant Access
24/7 Support
Document Chat

Document Details

Subject
Statistics

Related Documents

View all