Elementary Statistics: Picturing the World, 7th Edition Solution Manual

Unlock the answers to every textbook problem with Elementary Statistics: Picturing the World, 7th Edition Solution Manual, making studying more efficient and effective.

Emma Adams
Contributor
4.7
30
5 months ago
Preview (16 of 596 Pages)
100%
Purchase to unlock

Page 1

Elementary Statistics: Picturing the World, 7th Edition Solution Manual - Page 1 preview image

Loading page image...

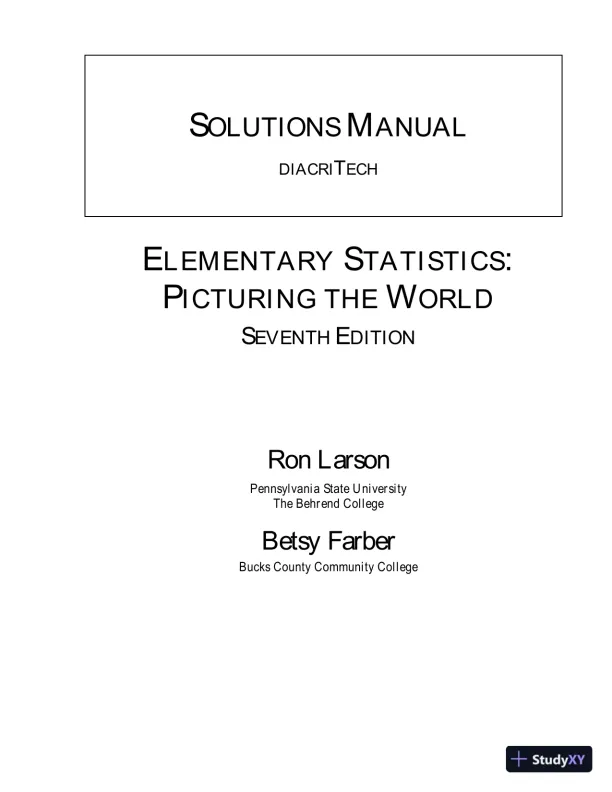
SOLUTIONSMANUALDIACRITECHELEMENTARYSTATISTICS:PICTURING THEWORLDSEVENTHEDITIONRon LarsonPennsylvania State UniversityThe Behrend CollegeBetsy FarberBucks County Community College

Page 2

Elementary Statistics: Picturing the World, 7th Edition Solution Manual - Page 2 preview image

Loading page image...

Page 3

Elementary Statistics: Picturing the World, 7th Edition Solution Manual - Page 3 preview image

Loading page image...

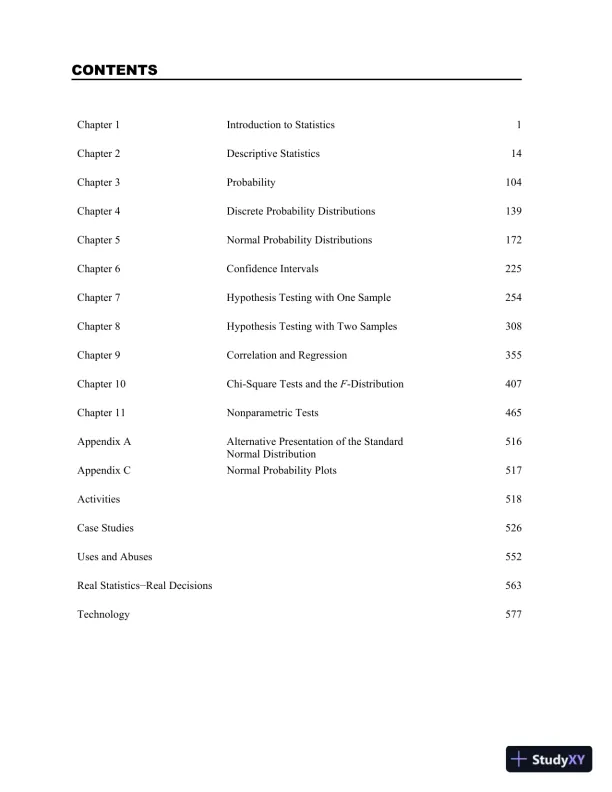
CONTENTSChapter 1Introduction to Statistics1Chapter 2Descriptive Statistics14Chapter 3Probability104Chapter 4Discrete Probability Distributions139Chapter 5Normal Probability Distributions172Chapter 6Confidence Intervals225Chapter 7Hypothesis Testing with One Sample254Chapter 8Hypothesis Testing with Two Samples308Chapter 9Correlation and Regression355Chapter 10Chi-Square Tests and theF-Distribution407Chapter 11Nonparametric Tests465Appendix AAlternative Presentation of the StandardNormal Distribution516Appendix CNormal Probability Plots517Activities518Case Studies526Uses and Abuses552Real StatisticsReal Decisions563Technolog577y

Page 4

Elementary Statistics: Picturing the World, 7th Edition Solution Manual - Page 4 preview image

Loading page image...

Page 5

Elementary Statistics: Picturing the World, 7th Edition Solution Manual - Page 5 preview image

Loading page image...

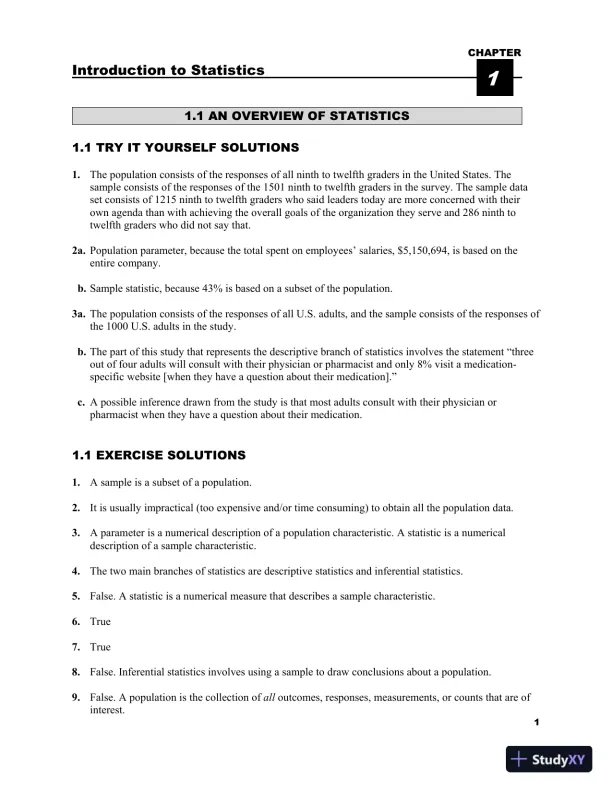
CHAPTERIntroduction to Statistics11.1 AN OVERVIEW OF STATISTICS1.11.The population consists of the responses of all ninth to twelfth graders in the United States. Thesample consists of the responses of the 1501 ninth to twelfth graders in the survey. The sample dataset consists of 1215 ninth to twelfth graders who said leaders today are more concerned with theirown agenda than with achieving the overall goals of the organization they serve and 286 ninth totwelfth graders who did not say that.2a.Population parameter, because the total spent on employees’ salaries, $5,150,694, is based on theentire company.b.Sample statistic, because 43% is based on a subset of the population.3a.The population consists of the responses of all U.S. adults, and the sample consists of the responses ofthe 1000 U.S. adults in the study.b.The part of this study that represents the descriptive branch of statistics involves the statement “threeout of four adults will consult with their physician or pharmacist and only 8% visit a medication-specific website [when they have a question about their medication].”c.A possible inference drawn from the study is that most adults consult with their physician orpharmacist when they have a question about their medication.1.1 EXERCISE SOLUTIONS1.A sample is a subset of a population.2.It is usually impractical (too expensive and/or time consuming) to obtain all the population data.3.A parameter is a numerical description of a population characteristic. A statistic is a numericaldescription of a sample characteristic.4.The two main branches of statistics are descriptive statistics and inferential statistics.5.False. A statistic is a numerical measure that describes a sample characteristic.6.True7.True8.False. Inferential statistics involves using a sample to draw conclusions about a population.9.False. A population is the collection ofalloutcomes, responses, measurements, or counts that are ofinterest.TRY IT YOURSELF SOLUTIONS1

Page 6

Elementary Statistics: Picturing the World, 7th Edition Solution Manual - Page 6 preview image

Loading page image...

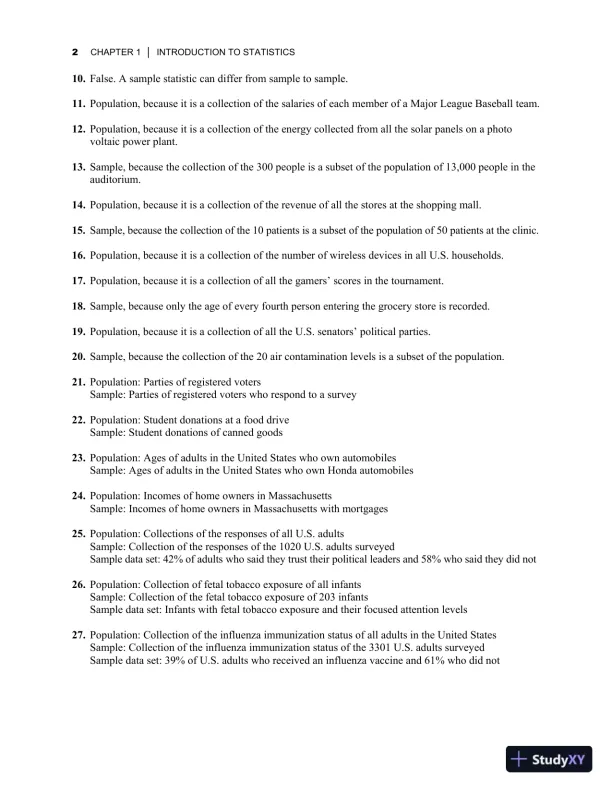
2CHAPTER 1INTRODUCTION TO STATISTICS10.False. A sample statistic can differ from sample to sample.11.Population, because it is a collection of the salaries of each member of a Major League Baseball team.12.Population, because it is a collection of the energy collected from all the solar panels on a photovoltaic power plant.13.Sample, because the collection of the 300 people is a subset of the population of 13,000 people in theauditorium.14.Population, because it is a collection of the revenue of all the stores at the shopping mall.15.Sample, because the collection of the 10 patients is a subset of the population of 50 patients at the clinic.16.Population, because it is a collection of the number of wireless devices in all U.S. households.17.Population, because it is a collection of all the gamers’ scores in the tournament.18.Sample, because only the age of every fourth person entering the grocery store is recorded.19.Population, because it is a collection of all the U.S. senators’ political parties.20.Sample, because the collection of the 20 air contamination levels is a subset of the population.21.Population: Parties of registered votersSample: Parties of registered voters who respond to a survey22.Population: Student donations at a food driveSample: Student donations of canned goods23.Population: Ages of adults in the United States who own automobilesSample: Ages of adults in the United States who own Honda automobiles24.Population: Incomes of home owners in MassachusettsSample: Incomes of home owners in Massachusetts with mortgages25.Population: Collections of the responses of all U.S. adultsSample: Collection of the responses of the 1020 U.S. adults surveyedSample data set: 42% of adults who said they trust their political leaders and 58% who said they did not26.Population: Collection of fetal tobacco exposure of all infantsSample: Collection of the fetal tobacco exposure of 203 infantsSample data set: Infants with fetal tobacco exposure and their focused attention levels27.Population: Collection of the influenza immunization status of all adults in the United StatesSample: Collection of the influenza immunization status of the 3301 U.S. adults surveyedSample data set: 39% of U.S. adults who received an influenza vaccine and 61% who did not

Page 7

Elementary Statistics: Picturing the World, 7th Edition Solution Manual - Page 7 preview image

Loading page image...

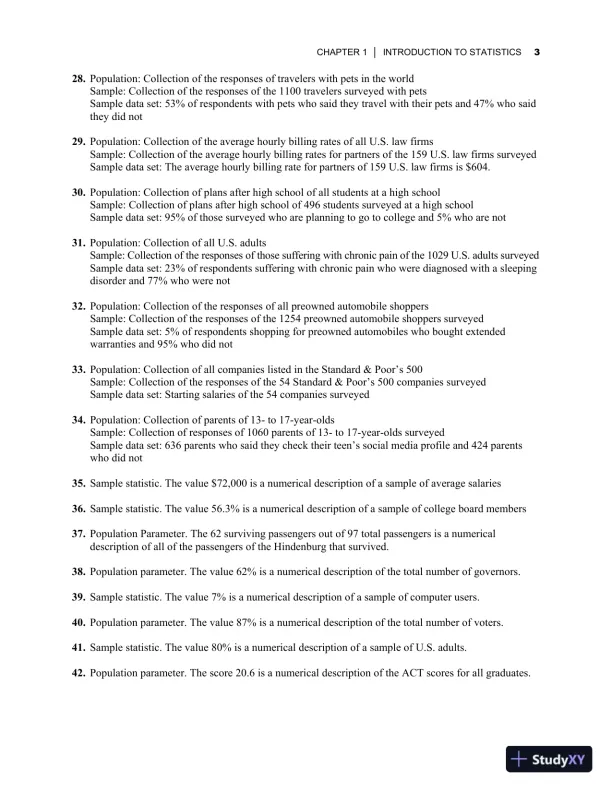
CHAPTER 1INTRODUCTION TO STATISTICS328.Population: Collection of the responses of travelers with pets in the worldSample: Collection of the responses of the 1100 travelers surveyed with petsSample data set: 53% of respondents with pets who said they travel with their pets and 47% who saidthey did not29.Population: Collection of the average hourly billing rates of all U.S. law firmsSample: Collection of the average hourly billing rates for partners of the 159 U.S. law firms surveyedSample data set: The average hourly billing rate for partners of 159 U.S. law firms is $604.30.Population: Collection of plans after high school of all students at a high schoolSample: Collection of plans after high school of 496 students surveyed at a high schoolSample data set: 95% of those surveyed who are planning to go to college and 5% who are not31.Population: Collection of all U.S. adultsSample: Collection of the responses of those suffering with chronic pain of the 1029 U.S. adults surveyedSample data set: 23% of respondents suffering with chronic pain who were diagnosed with a sleepingdisorder and 77% who were not32.Population: Collection of the responses of all preowned automobile shoppersSample: Collection of the responses of the 1254 preowned automobile shoppers surveyedSample data set: 5% of respondents shopping for preowned automobiles who bought extendedwarranties and 95% who did not33.Population: Collection of all companies listed in the Standard & Poor’s 500Sample: Collection of the responses of the 54 Standard & Poor’s 500 companies surveyedSample data set: Starting salaries of the 54 companies surveyed34.Population: Collection of parents of 13- to 17-year-oldsSample: Collection of responses of 1060 parents of 13- to 17-year-olds surveyedSample data set: 636 parents who said they check their teen’s social media profile and 424 parentswho did not35.Sample statistic. The value $72,000 is a numerical description of a sample of average salaries36.Sample statistic. The value 56.3% is a numerical description of a sample of college board members37.Population Parameter. The 62 surviving passengers out of 97 total passengers is a numericaldescription of all of the passengers of the Hindenburg that survived.38.Population parameter. The value 62% is a numerical description of the total number of governors.39.Sample statistic. The value 7% is a numerical description of a sample of computer users.40.Population parameter. The value 87% is a numerical description of the total number of voters.41.Sample statistic. The value 80% is a numerical description of a sample of U.S. adults.42.Population parameter. The score 20.6 is a numerical description of the ACT scores for all graduates.

Page 8

Elementary Statistics: Picturing the World, 7th Edition Solution Manual - Page 8 preview image

Loading page image...

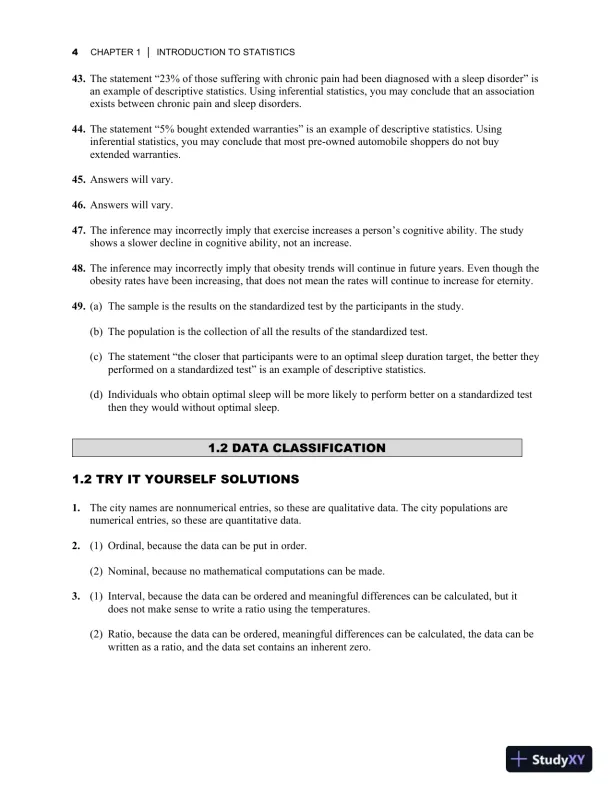
4CHAPTER 1INTRODUCTION TO STATISTICS43.The statement “23% of those suffering with chronic pain had been diagnosed with a sleep disorder” isan example of descriptive statistics. Using inferential statistics, you may conclude that an associationexists between chronic pain and sleep disorders.44.The statement “5% bought extended warranties” is an example of descriptive statistics. Usinginferential statistics, you may conclude that most pre-owned automobile shoppers do not buyextended warranties.45.Answers will vary.46.Answers will vary.47.The inference may incorrectly imply that exercise increases a person’s cognitive ability. The studyshows a slower decline in cognitive ability, not an increase.48.The inference may incorrectly imply that obesity trends will continue in future years. Even though theobesity rates have been increasing, that does not mean the rates will continue to increase for eternity.49.(a) The sample is the results on the standardized test by the participants in the study.(b) The population is the collection of all the results of the standardized test.(c) The statement “the closer that participants were to an optimal sleep duration target, the better theyperformed on a standardized test” is an example of descriptive statistics.(d) Individuals who obtain optimal sleep will be more likely to perform better on a standardized testthen they would without optimal sleep.1.2 DATA CLASSIFICATION1.21.The city names are nonnumerical entries, so these are qualitative data. The city populations arenumerical entries, so these are quantitative data.2.(1) Ordinal, because the data can be put in order.(2) Nominal, because no mathematical computations can be made.3.(1) Interval, because the data can be ordered and meaningful differences can be calculated, but itdoes not make sense to write a ratio using the temperatures.(2) Ratio, because the data can be ordered, meaningful differences can be calculated, the data can bewritten as a ratio, and the data set contains an inherent zero.TRY IT YOURSELF SOLUTIONS

Page 9

Elementary Statistics: Picturing the World, 7th Edition Solution Manual - Page 9 preview image

Loading page image...

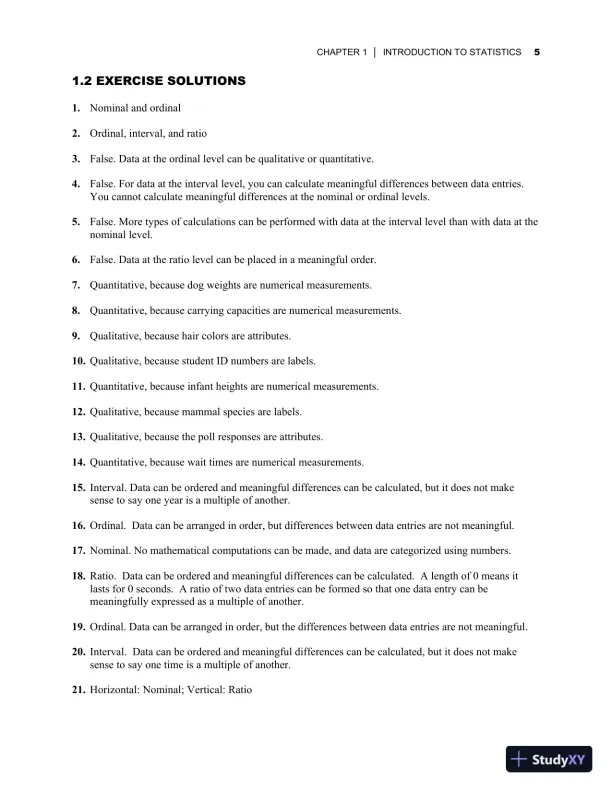
CHAPTER 1INTRODUCTION TO STATISTICS51.2 EXERCISE SOLUTIONS1.Nominal and ordinal2.Ordinal, interval, and ratio3.False. Data at the ordinal level can be qualitative or quantitative.4.False. For data at the interval level, you can calculate meaningful differences between data entries.You cannot calculate meaningful differences at the nominal or ordinal levels.5.False. More types of calculations can be performed with data at the interval level than with data at thenominal level.6.False. Data at the ratio level can be placed in a meaningful order.7.Quantitative, because dog weights are numerical measurements.8.Quantitative, because carrying capacities are numerical measurements.9.Qualitative, because hair colors are attributes.10.Qualitative, because student ID numbers are labels.11.Quantitative, because infant heights are numerical measurements.12.Qualitative, because mammal species are labels.13.Qualitative, because the poll responses are attributes.14.Quantitative, because wait times are numerical measurements.15.Interval. Data can be ordered and meaningful differences can be calculated, but it does not makesense to say one year is a multiple of another.16.Ordinal. Data can be arranged in order, but differences between data entries are not meaningful.17.Nominal. No mathematical computations can be made, and data are categorized using numbers.18.Ratio. Data can be ordered and meaningful differences can be calculated. A length of 0 means itlasts for 0 seconds. A ratio of two data entries can be formed so that one data entry can bemeaningfully expressed as a multiple of another.19.Ordinal. Data can be arranged in order, but the differences between data entries are not meaningful.20.Interval. Data can be ordered and meaningful differences can be calculated, but it does not makesense to say one time is a multiple of another.21.Horizontal: Nominal; Vertical: Ratio

Page 10

Elementary Statistics: Picturing the World, 7th Edition Solution Manual - Page 10 preview image

Loading page image...

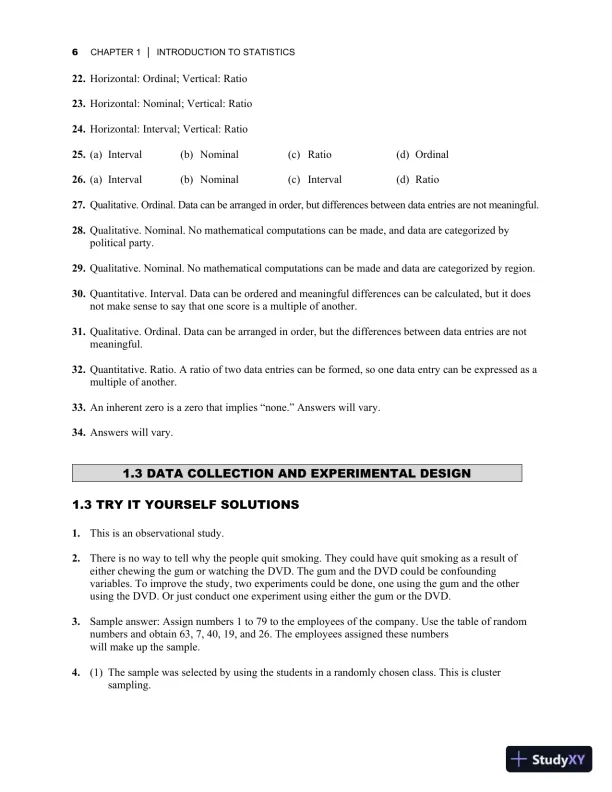
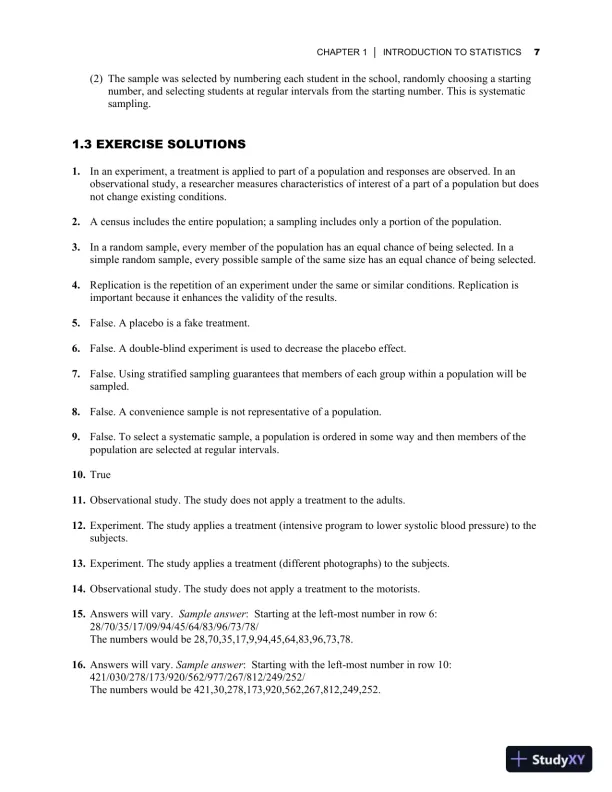
6CHAPTER 1INTRODUCTION TO STATISTICS22.Horizontal: Ordinal; Vertical: Ratio23.Horizontal: Nominal; Vertical: Ratio24.Horizontal: Interval; Vertical: Ratio25.(a) Interval(b)Nominal(c)Ratio(d) Ordinal26.(a) Interval(b)Nominal(c)Interval(d) Ratio27.Qualitative. Ordinal. Data can be arranged in order, but differences between data entries are not meaningful.28.Qualitative. Nominal. No mathematical computations can be made, and data are categorized bypolitical party.29.Qualitative. Nominal. No mathematical computations can be made and data are categorized by region.30.Quantitative. Interval. Data can be ordered and meaningful differences can be calculated, but it doesnot make sense to say that one score is a multiple of another.31.Qualitative. Ordinal. Data can be arranged in order, but the differences between data entries are notmeaningful.32.Quantitative. Ratio. A ratio of two data entries can be formed, so one data entry can be expressed as amultiple of another.33.An inherent zero is a zero that implies “none.” Answers will vary.34.Answers will vary.1.3 DATA COLLECTION AND EXPERIMENTAL DESIGN1.31.This is an observational study.2.There is no way to tell why the people quit smoking. They could have quit smoking as a result ofeither chewing the gum or watching the DVD. The gum and the DVD could be confoundingvariables. To improve the study, two experiments could be done, one using the gum and the otherusing the DVD. Or just conduct one experiment using either the gum or the DVD.3.Sample answer: Assign numbers 1 to 79 to the employees of the company. Use the table of randomnumbers and obtain 63, 7, 40, 19, and 26. The employees assigned these numberswill make up the sample.4.(1) The sample was selected by using the students in a randomly chosen class. This is clustersampling.TRY IT YOURSELF SOLUTIONS

Page 11

Elementary Statistics: Picturing the World, 7th Edition Solution Manual - Page 11 preview image

Loading page image...

CHAPTER 1INTRODUCTION TO STATISTICS7(2) The sample was selected by numbering each student in the school, randomly choosing a startingnumber, and selecting students at regular intervals from the starting number. This is systematicsampling.1.3 EXERCISE SOLUTIONS1.In an experiment, a treatment is applied to part of a population and responses are observed. In anobservational study, a researcher measures characteristics of interest of a part of a population but doesnot change existing conditions.2.A census includes the entire population; a sampling includes only a portion of the population.3.In a random sample, every member of the population has an equal chance of being selected. In asimple random sample, every possible sample of the same size has an equal chance of being selected.4.Replication is the repetition of an experiment under the same or similar conditions. Replication isimportant because it enhances the validity of the results.5.False. A placebo is a fake treatment.6.False. A double-blind experiment is used to decrease the placebo effect.7.False. Using stratified sampling guarantees that members of each group within a population will besampled.8.False. A convenience sample is not representative of a population.9.False. To select a systematic sample, a population is ordered in some way and then members of thepopulation are selected at regular intervals.10.True11.Observational study. The study does not apply a treatment to the adults.12.Experiment. The study applies a treatment (intensive program to lower systolic blood pressure) to thesubjects.13.Experiment. The study applies a treatment (different photographs) to the subjects.14.Observational study. The study does not apply a treatment to the motorists.15.Answers will vary.Sample answer: Starting at the left-most number in row 6:28/70/35/17/09/94/45/64/83/96/73/78/The numbers would be 28,70,35,17,9,94,45,64,83,96,73,78.16.Answers will vary.Sample answer: Starting with the left-most number in row 10:421/030/278/173/920/562/977/267/812/249/252/The numbers would be 421,30,278,173,920,562,267,812,249,252.

Page 12

Elementary Statistics: Picturing the World, 7th Edition Solution Manual - Page 12 preview image

Loading page image...

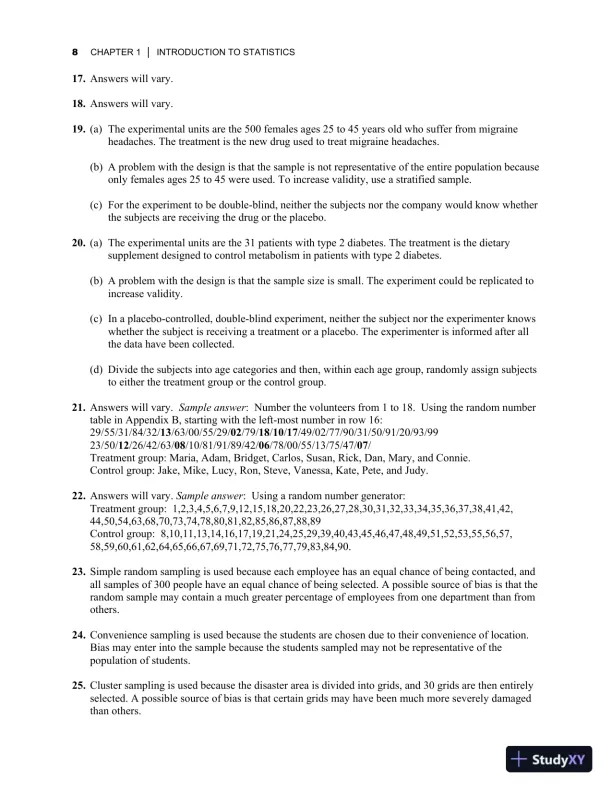
8CHAPTER 1INTRODUCTION TO STATISTICS17.Answers will vary.18.Answers will vary.19.(a) The experimental units are the 500 females ages 25 to 45 years old who suffer from migraineheadaches. The treatment is the new drug used to treat migraine headaches.(b) A problem with the design is that the sample is not representative of the entire population becauseonly females ages 25 to 45 were used. To increase validity, use a stratified sample.(c) For the experiment to be double-blind, neither the subjects nor the company would know whetherthe subjects are receiving the drug or the placebo.20.(a) The experimental units are the 31 patients with type 2 diabetes. The treatment is the dietarysupplement designed to control metabolism in patients with type 2 diabetes.(b) A problem with the design is that the sample size is small. The experiment could be replicated toincrease validity.(c) In a placebo-controlled, double-blind experiment, neither the subject nor the experimenter knowswhether the subject is receiving a treatment or a placebo. The experimenter is informed after allthe data have been collected.(d) Divide the subjects into age categories and then, within each age group, randomly assign subjectsto either the treatment group or the control group.21.Answers will vary.Sample answer: Number the volunteers from 1 to 18. Using the random numbertable in Appendix B, starting with the left-most number in row 16:29/55/31/84/32/13/63/00/55/29/02/79/18/10/17/49/02/77/90/31/50/91/20/93/9923/50/12/26/42/63/08/10/81/91/89/42/06/78/00/55/13/75/47/07/Treatment group: Maria, Adam, Bridget, Carlos, Susan, Rick, Dan, Mary, and Connie.Control group: Jake, Mike, Lucy, Ron, Steve, Vanessa, Kate, Pete, and Judy.22.Answers will vary.Sample answer: Using a random number generator:Treatment group: 1,2,3,4,5,6,7,9,12,15,18,20,22,23,26,27,28,30,31,32,33,34,35,36,37,38,41,42,44,50,54,63,68,70,73,74,78,80,81,82,85,86,87,88,89Control group: 8,10,11,13,14,16,17,19,21,24,25,29,39,40,43,45,46,47,48,49,51,52,53,55,56,57,58,59,60,61,62,64,65,66,67,69,71,72,75,76,77,79,83,84,90.23.Simple random sampling is used because each employee has an equal chance of being contacted, andall samples of 300 people have an equal chance of being selected. A possible source of bias is that therandom sample may contain a much greater percentage of employees from one department than fromothers.24.Convenience sampling is used because the students are chosen due to their convenience of location.Bias may enter into the sample because the students sampled may not be representative of thepopulation of students.25.Cluster sampling is used because the disaster area is divided into grids, and 30 grids are then entirelyselected. A possible source of bias is that certain grids may have been much more severely damagedthan others.

Page 13

Elementary Statistics: Picturing the World, 7th Edition Solution Manual - Page 13 preview image

Loading page image...

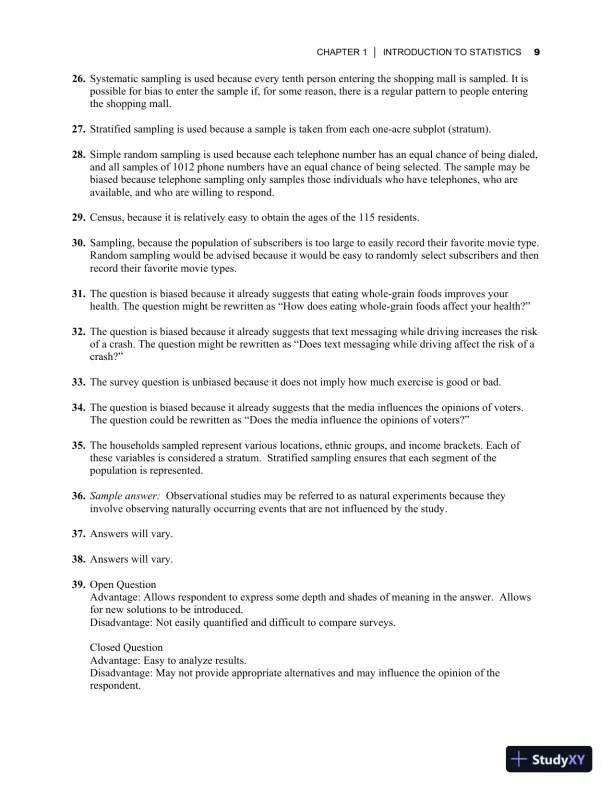
CHAPTER 1INTRODUCTION TO STATISTICS926.Systematic sampling is used because every tenth person entering the shopping mall is sampled. It ispossible for bias to enter the sample if, for some reason, there is a regular pattern to people enteringthe shopping mall.27.Stratified sampling is used because a sample is taken from each one-acre subplot (stratum).28.Simple random sampling is used because each telephone number has an equal chance of being dialed,and all samples of 1012 phone numbers have an equal chance of being selected. The sample may bebiased because telephone sampling only samples those individuals who have telephones, who areavailable, and who are willing to respond.29.Census, because it is relatively easy to obtain the ages of the 115 residents.30.Sampling, because the population of subscribers is too large to easily record their favorite movie type.Random sampling would be advised because it would be easy to randomly select subscribers and thenrecord their favorite movie types.31.The question is biased because it already suggests that eating whole-grain foods improves yourhealth. The question might be rewritten as “How does eating whole-grain foods affect your health?”32.The question is biased because it already suggests that text messaging while driving increases the riskof a crash. The question might be rewritten as “Does text messaging while driving affect the risk of acrash?”33.The survey question is unbiased because it does not imply how much exercise is good or bad.34.The question is biased because it already suggests that the media influences the opinions of voters.The question could be rewritten as “Does the media influence the opinions of voters?”35.The households sampled represent various locations, ethnic groups, and income brackets. Each ofthese variables is considered a stratum. Stratified sampling ensures that each segment of thepopulation is represented.36.Sample answer:Observational studies may be referred to as natural experiments because theyinvolve observing naturally occurring events that are not influenced by the study.37.Answers will vary.38.Answers will vary.39.Open QuestionAdvantage: Allows respondent to express some depth and shades of meaning in the answer. Allowsfor new solutions to be introduced.Disadvantage: Not easily quantified and difficult to compare surveys.Closed QuestionAdvantage: Easy to analyze results.Disadvantage: May not provide appropriate alternatives and may influence the opinion of therespondent.

Page 14

Elementary Statistics: Picturing the World, 7th Edition Solution Manual - Page 14 preview image

Loading page image...

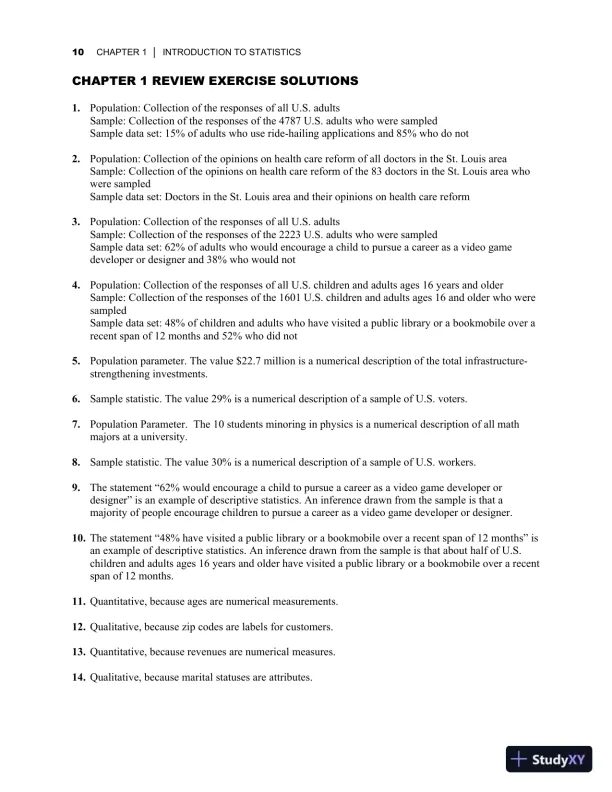
10CHAPTER 1INTRODUCTION TO STATISTICSCHAPTER 1 REVIEW EXERCISE SOLUTIONS1.Population: Collection of the responses of all U.S. adultsSample: Collection of the responses of the 4787 U.S. adults who were sampledSample data set: 15% of adults who use ride-hailing applications and 85% who do not2.Population: Collection of the opinions on health care reform of all doctors in the St. Louis areaSample: Collection of the opinions on health care reform of the 83 doctors in the St. Louis area whowere sampledSample data set: Doctors in the St. Louis area and their opinions on health care reform3.Population: Collection of the responses of all U.S. adultsSample: Collection of the responses of the 2223 U.S. adults who were sampledSample data set: 62% of adults who would encourage a child to pursue a career as a video gamedeveloper or designer and 38% who would not4.Population: Collection of the responses of all U.S. children and adults ages 16 years and olderSample: Collection of the responses of the 1601 U.S. children and adults ages 16 and older who weresampledSample data set: 48% of children and adults who have visited a public library or a bookmobile over arecent span of 12 months and 52% who did not5.Population parameter. The value $22.7 million is a numerical description of the total infrastructure-strengthening investments.6.Sample statistic. The value 29% is a numerical description of a sample of U.S. voters.7.Population Parameter. The 10 students minoring in physics is a numerical description of all mathmajors at a university.8.Sample statistic. The value 30% is a numerical description of a sample of U.S. workers.9.The statement “62% would encourage a child to pursue a career as a video game developer ordesigner” is an example of descriptive statistics. An inference drawn from the sample is that amajority of people encourage children to pursue a career as a video game developer or designer.10.The statement “48% have visited a public library or a bookmobile over a recent span of 12 months” isan example of descriptive statistics. An inference drawn from the sample is that about half of U.S.children and adults ages 16 years and older have visited a public library or a bookmobile over a recentspan of 12 months.11.Quantitative, because ages are numerical measurements.12.Qualitative, because zip codes are labels for customers.13.Quantitative, because revenues are numerical measures.14.Qualitative, because marital statuses are attributes.

Page 15

Elementary Statistics: Picturing the World, 7th Edition Solution Manual - Page 15 preview image

Loading page image...

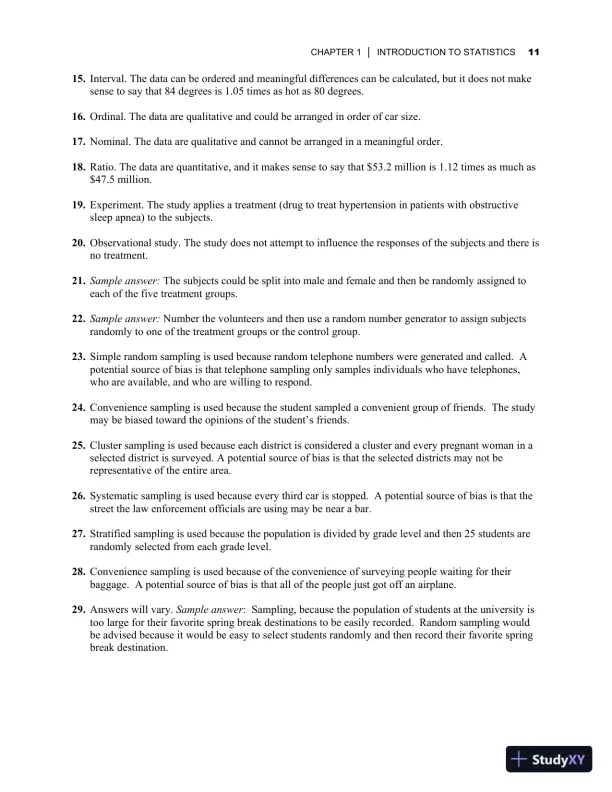
CHAPTER 1INTRODUCTION TO STATISTICS1115.Interval. The data can be ordered and meaningful differences can be calculated, but it does not makesense to say that 84 degrees is 1.05 times as hot as 80 degrees.16.Ordinal. The data are qualitative and could be arranged in order of car size.17.Nominal. The data are qualitative and cannot be arranged in a meaningful order.18.Ratio. The data are quantitative, and it makes sense to say that $53.2 million is 1.12 times as much as$47.5 million.19.Experiment. The study applies a treatment (drug to treat hypertension in patients with obstructivesleep apnea) to the subjects.20.Observational study. The study does not attempt to influence the responses of the subjects and there isno treatment.21.Sample answer:The subjects could be split into male and female and then be randomly assigned toeach of the five treatment groups.22.Sample answer:Number the volunteers and then use a random number generator to assign subjectsrandomly to one of the treatment groups or the control group.23.Simple random sampling is used because random telephone numbers were generated and called. Apotential source of bias is that telephone sampling only samples individuals who have telephones,who are available, and who are willing to respond.24.Convenience sampling is used because the student sampled a convenient group of friends. The studymay be biased toward the opinions of the student’s friends.25.Cluster sampling is used because each district is considered a cluster and every pregnant woman in aselected district is surveyed. A potential source of bias is that the selected districts may not berepresentative of the entire area.26.Systematic sampling is used because every third car is stopped. A potential source of bias is that thestreet the law enforcement officials are using may be near a bar.27.Stratified sampling is used because the population is divided by grade level and then 25 students arerandomly selected from each grade level.28.Convenience sampling is used because of the convenience of surveying people waiting for theirbaggage. A potential source of bias is that all of the people just got off an airplane.29.Answers will vary.Sample answer: Sampling, because the population of students at the university istoo large for their favorite spring break destinations to be easily recorded. Random sampling wouldbe advised because it would be easy to select students randomly and then record their favorite springbreak destination.

Page 16

Elementary Statistics: Picturing the World, 7th Edition Solution Manual - Page 16 preview image

Loading page image...

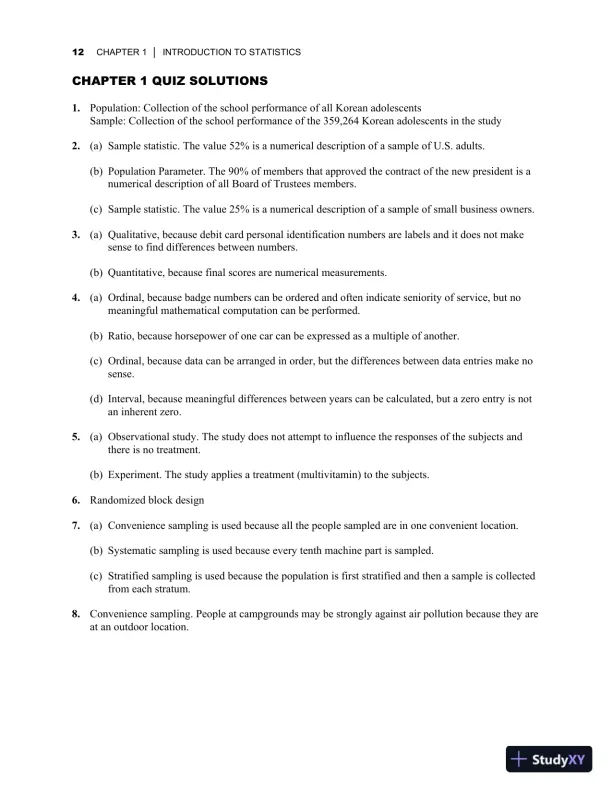
12CHAPTER 1INTRODUCTION TO STATISTICSCHAPTER 1 QUIZ SOLUTIONS1.Population: Collection of the school performance of all Korean adolescentsSample: Collection of the school performance of the 359,264 Korean adolescents in the study2.(a) Sample statistic. The value 52% is a numerical description of a sample of U.S. adults.(b) Population Parameter. The 90% of members that approved the contract of the new president is anumerical description of all Board of Trustees members.(c) Sample statistic. The value 25% is a numerical description of a sample of small business owners.3.(a) Qualitative, because debit card personal identification numbers are labels and it does not makesense to find differences between numbers.(b) Quantitative, because final scores are numerical measurements.4.(a) Ordinal, because badge numbers can be ordered and often indicate seniority of service, but nomeaningful mathematical computation can be performed.(b) Ratio, because horsepower of one car can be expressed as a multiple of another.(c) Ordinal, because data can be arranged in order, but the differences between data entries make nosense.(d) Interval, because meaningful differences between years can be calculated, but a zero entry is notan inherent zero.5.(a) Observational study. The study does not attempt to influence the responses of the subjects andthere is no treatment.(b) Experiment. The study applies a treatment (multivitamin) to the subjects.6.Randomized block design7.(a) Convenience sampling is used because all the people sampled are in one convenient location.(b) Systematic sampling is used because every tenth machine part is sampled.(c) Stratified sampling is used because the population is first stratified and then a sample is collectedfrom each stratum.8.Convenience sampling. People at campgrounds may be strongly against air pollution because they areat an outdoor location.
Preview Mode

This document has 596 pages. Sign in to access the full document!

Study Now!

XY-Copilot AI
Unlimited Access
Secure Payment
Instant Access
24/7 Support
Document Chat

Document Details

Subject
Statistics

Related Documents

View all