Inquiry Problem Solving Competency

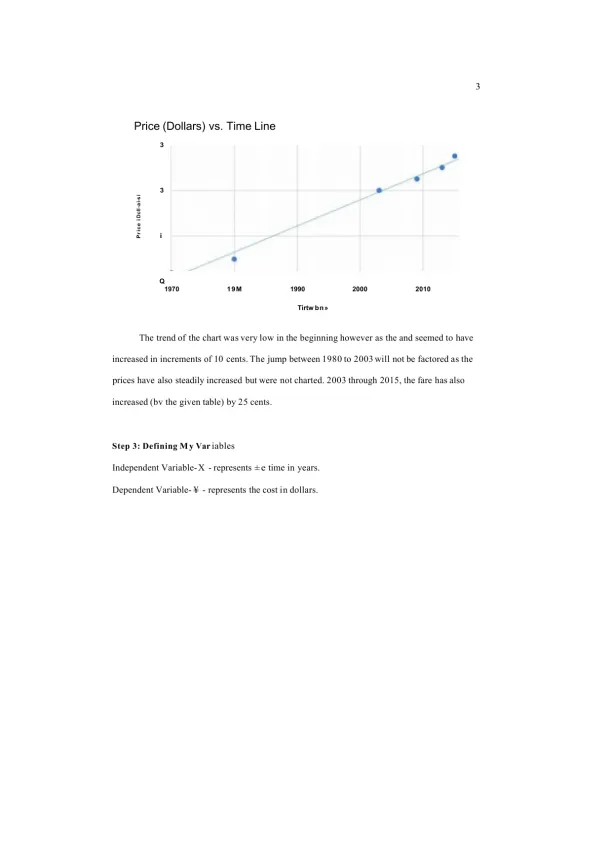
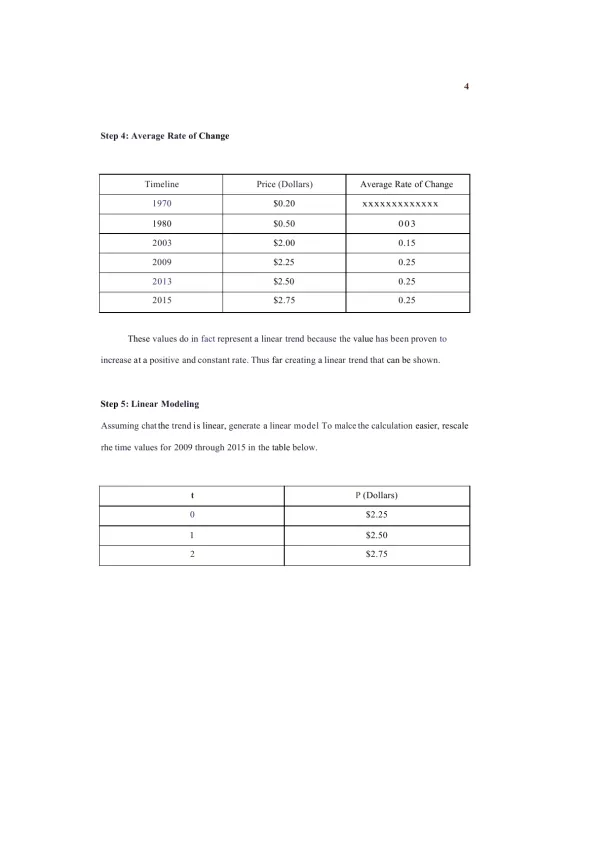
Analyze NYC MTA fare trends over time using linear modeling. Includes scatter plots, rate of change, and a linear function to predict future costs. A great project for exploring real-world applications of algebra and data interpretation.

Daniel Miller
Contributor
4.8
36
5 months ago
Preview (3 of 7 Pages)
100%
Purchase to unlock

Page 1

Inquiry Problem Solving Competency - Page 1 preview image

Loading page image...

1M A I 115: Inquiry Problem Solving CompetencyMAT 115: College Algebra & TrigonometryProfessor Mahdi Majidi-ZolbaninDecember b, 20242Project One:Linear Modeling of NYCMTATransit Fares Over TimeStep 1: IntroductionMy goals for this activity will be co oversee the prices of rhe MTA fares throughout theyears and to create a mathematical model in which can predict the future increases as well.Must include:-Graphs-Rate of Change-Linear FunctionStep2:Scatter PlotsTimelinePrice (Dollars)197050.20198050.50200352.00200952.25201352.50201552.75

Page 2

Inquiry Problem Solving Competency - Page 2 preview image

Loading page image...

3Price (Dollars) vs. Time Line33iQ19701 9 M199020002010Tirtw bn»The trend of the chart was very low in the beginning however as the and seemed to haveincreased in increments of 10 cents. The jump between 1980 to 2003 will not be factored as theprices have also steadily increased but were not charted. 2003 through 2015, the fare has alsoincreased (bv the given table) by 25 cents.P r i c e i Dcll-a i-s iStep 3: Defining M y VariablesIndependent Variable- X - represents ± e time in years.Dependent Variable- ¥ - represents the cost in dollars.

Page 3

Inquiry Problem Solving Competency - Page 3 preview image

Loading page image...

4Step 4: Average Rate of ChangeTimelinePrice (Dollars)Average Rate of Change1970$0.20xxxxxxxxxxxxx1980$0.500 0 32003$2.000.152009$2.250.252013$2.500.252015$2.750.25These values do in fact represent a linear trend because the value has been proven toincrease at a positive and constant rate. Thus far creating a linear trend that can be shown.Step 5: Linear ModelingAssuming chat the trend is linear, generate a linear model To malce the calculation easier, rescalerhe time values for 2009 through 2015 in the table below.tP (Dollars)0$2.251$2.502$2.75
Preview Mode

This document has 7 pages. Sign in to access the full document!

Study Now!

XY-Copilot AI
Unlimited Access
Secure Payment
Instant Access
24/7 Support
Document Chat

Document Details

Related Documents

View all