Solution Manual for Biostatistics for the Biological and Health Sciences, 2nd Edition

Solution Manual for Biostatistics for the Biological and Health Sciences, 2nd Edition breaks down difficult textbook problems into simple solutions, making your study time more effective.

James Rodriguez
Contributor
4.8
56
5 months ago
Preview (16 of 204 Pages)
100%
Purchase to unlock

Page 1

Solution Manual for Biostatistics for the Biological and Health Sciences, 2nd Edition - Page 1 preview image

Loading page image...

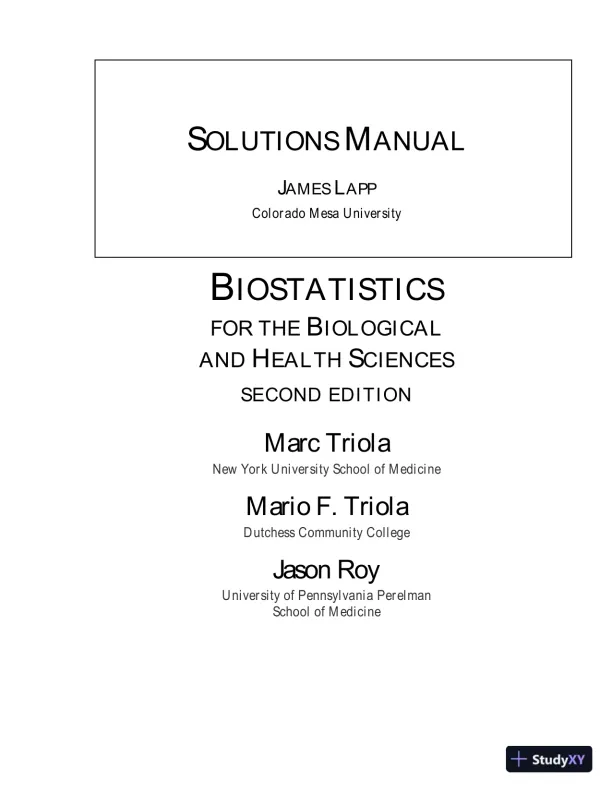
SOLUTIONSMANUALJAMESLAPPColorado Mesa UniversityBIOSTATISTICSFOR THEBIOLOGICALANDHEALTHSCIENCESSECOND EDITIONMarc TriolaNew York University School of MedicineMario F. TriolaDutchess Community CollegeJason RoyUniversity of Pennsylvania PerelmanSchool of Medicine

Page 2

Solution Manual for Biostatistics for the Biological and Health Sciences, 2nd Edition - Page 2 preview image

Loading page image...

Page 3

Solution Manual for Biostatistics for the Biological and Health Sciences, 2nd Edition - Page 3 preview image

Loading page image...

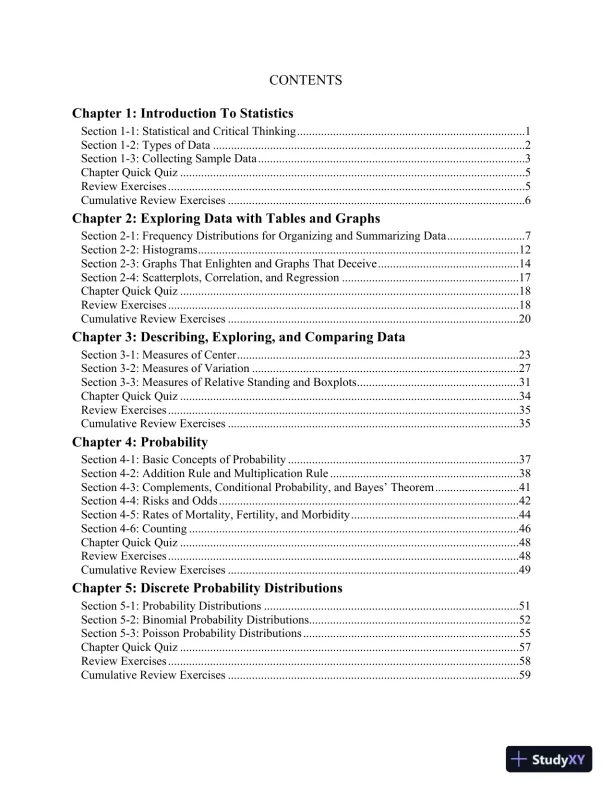
CONTENTSChapter 1: Introduction To StatisticsSection 1-1: Statistical and Critical Thinking............................................................................1Section 1-2: Types of Data ........................................................................................................2Section 1-3: Collecting Sample Data.........................................................................................3Chapter Quick Quiz ...................................................................................................................5Review Exercises .......................................................................................................................5Cumulative Review Exercises ...................................................................................................6Chapter 2: Exploring Data with Tables and GraphsSection 2-1: Frequency Distributions for Organizing and Summarizing Data..........................7Section 2-2: Histograms...........................................................................................................12Section 2-3: Graphs That Enlighten and Graphs That Deceive...............................................14Section 2-4: Scatterplots, Correlation, and Regression ...........................................................17Chapter Quick Quiz .................................................................................................................18Review Exercises .....................................................................................................................18Cumulative Review Exercises .................................................................................................20Chapter 3: Describing, Exploring, and Comparing DataSection 3-1: Measures of Center..............................................................................................23Section 3-2: Measures of Variation .........................................................................................27Section 3-3: Measures of Relative Standing and Boxplots......................................................31Chapter Quick Quiz .................................................................................................................34Review Exercises .....................................................................................................................35Cumulative Review Exercises .................................................................................................35Chapter 4: ProbabilitySection 4-1: Basic Concepts of Probability .............................................................................37Section 4-2: Addition Rule and Multiplication Rule ...............................................................38Section 4-3: Complements, Conditional Probability, and Bayes’ Theorem............................41Section 4-4: Risks and Odds ....................................................................................................42Section 4-5: Rates of Mortality, Fertility, and Morbidity........................................................44Section 4-6: Counting ..............................................................................................................46Chapter Quick Quiz .................................................................................................................48Review Exercises .....................................................................................................................48Cumulative Review Exercises .................................................................................................49Chapter 5: Discrete Probability DistributionsSection 5-1: Probability Distributions .....................................................................................51Section 5-2: Binomial Probability Distributions......................................................................52Section 5-3: Poisson Probability Distributions ........................................................................55Chapter Quick Quiz .................................................................................................................57Review Exercises .....................................................................................................................58Cumulative Review Exercises .................................................................................................59

Page 4

Solution Manual for Biostatistics for the Biological and Health Sciences, 2nd Edition - Page 4 preview image

Loading page image...

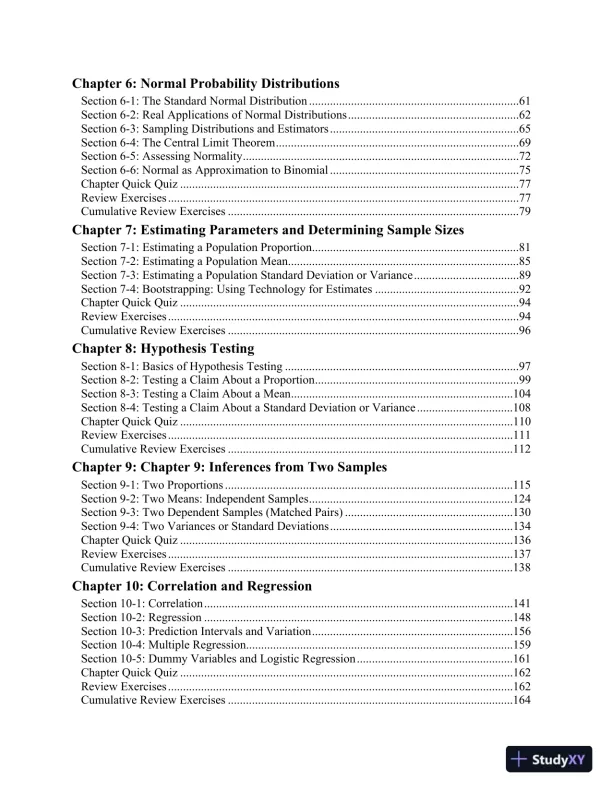
Chapter 6: Normal Probability DistributionsSection 6-1: The Standard Normal Distribution ......................................................................61Section 6-2: Real Applications of Normal Distributions.........................................................62Section 6-3: Sampling Distributions and Estimators ...............................................................65Section 6-4: The Central Limit Theorem.................................................................................69Section 6-5: Assessing Normality............................................................................................72Section 6-6: Normal as Approximation to Binomial ...............................................................75Chapter Quick Quiz .................................................................................................................77Review Exercises .....................................................................................................................77Cumulative Review Exercises .................................................................................................79Chapter 7: Estimating Parameters and Determining Sample SizesSection 7-1: Estimating a Population Proportion.....................................................................81Section 7-2: Estimating a Population Mean.............................................................................85Section 7-3: Estimating a Population Standard Deviation or Variance...................................89Section 7-4: Bootstrapping: Using Technology for Estimates ................................................92Chapter Quick Quiz .................................................................................................................94Review Exercises .....................................................................................................................94Cumulative Review Exercises .................................................................................................96Chapter 8: Hypothesis TestingSection 8-1: Basics of Hypothesis Testing ..............................................................................97Section 8-2: Testing a Claim About a Proportion....................................................................99Section 8-3: Testing a Claim About a Mean..........................................................................104Section 8-4: Testing a Claim About a Standard Deviation or Variance ................................108Chapter Quick Quiz ...............................................................................................................110Review Exercises ...................................................................................................................111Cumulative Review Exercises ...............................................................................................112Chapter 9: Chapter 9: Inferences from Two SamplesSection 9-1: Two Proportions ................................................................................................115Section 9-2: Two Means: Independent Samples....................................................................124Section 9-3: Two Dependent Samples (Matched Pairs) ........................................................130Section 9-4: Two Variances or Standard Deviations.............................................................134Chapter Quick Quiz ...............................................................................................................136Review Exercises ...................................................................................................................137Cumulative Review Exercises ...............................................................................................138Chapter 10: Correlation and RegressionSection 10-1: Correlation.......................................................................................................141Section 10-2: Regression .......................................................................................................148Section 10-3: Prediction Intervals and Variation...................................................................156Section 10-4: Multiple Regression.........................................................................................159Section 10-5: Dummy Variables and Logistic Regression ....................................................161Chapter Quick Quiz ...............................................................................................................162Review Exercises ...................................................................................................................162Cumulative Review Exercises ...............................................................................................164

Page 5

Solution Manual for Biostatistics for the Biological and Health Sciences, 2nd Edition - Page 5 preview image

Loading page image...

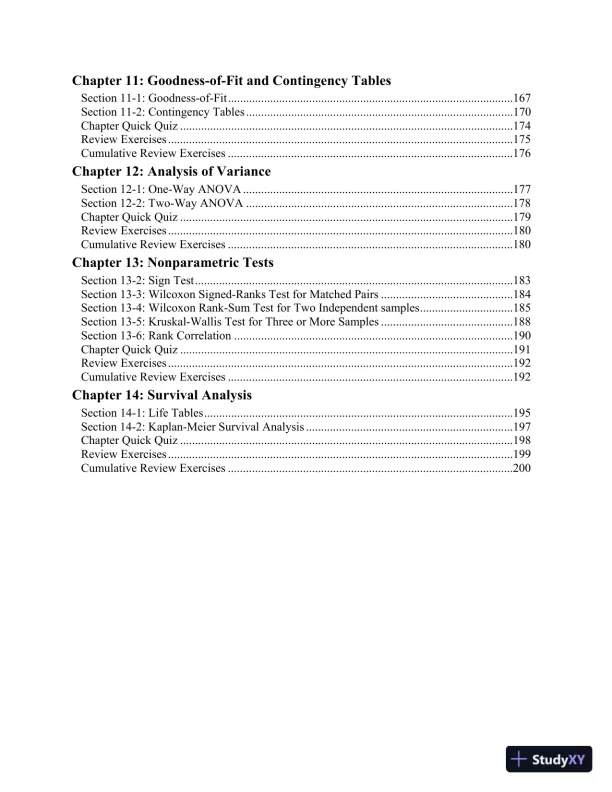
Chapter 11: Goodness-of-Fit and Contingency TablesSection 11-1: Goodness-of-Fit...............................................................................................167Section 11-2: Contingency Tables .........................................................................................170Chapter Quick Quiz ...............................................................................................................174Review Exercises ...................................................................................................................175Cumulative Review Exercises ...............................................................................................176Chapter 12: Analysis of VarianceSection 12-1: One-Way ANOVA ..........................................................................................177Section 12-2: Two-Way ANOVA .........................................................................................178Chapter Quick Quiz ...............................................................................................................179Review Exercises ...................................................................................................................180Cumulative Review Exercises ...............................................................................................180Chapter 13: Nonparametric TestsSection 13-2: Sign Test..........................................................................................................183Section 13-3: Wilcoxon Signed-Ranks Test for Matched Pairs ............................................184Section 13-4: Wilcoxon Rank-Sum Test for Two Independent samples...............................185Section 13-5: Kruskal-Wallis Test for Three or More Samples ............................................188Section 13-6: Rank Correlation .............................................................................................190Chapter Quick Quiz ...............................................................................................................191Review Exercises ...................................................................................................................192Cumulative Review Exercises ...............................................................................................192Chapter 14: Survival AnalysisSection 14-1: Life Tables.......................................................................................................195Section 14-2: Kaplan-Meier Survival Analysis .....................................................................197Chapter Quick Quiz ...............................................................................................................198Review Exercises ...................................................................................................................199Cumulative Review Exercises ...............................................................................................200

Page 6

Solution Manual for Biostatistics for the Biological and Health Sciences, 2nd Edition - Page 6 preview image

Loading page image...

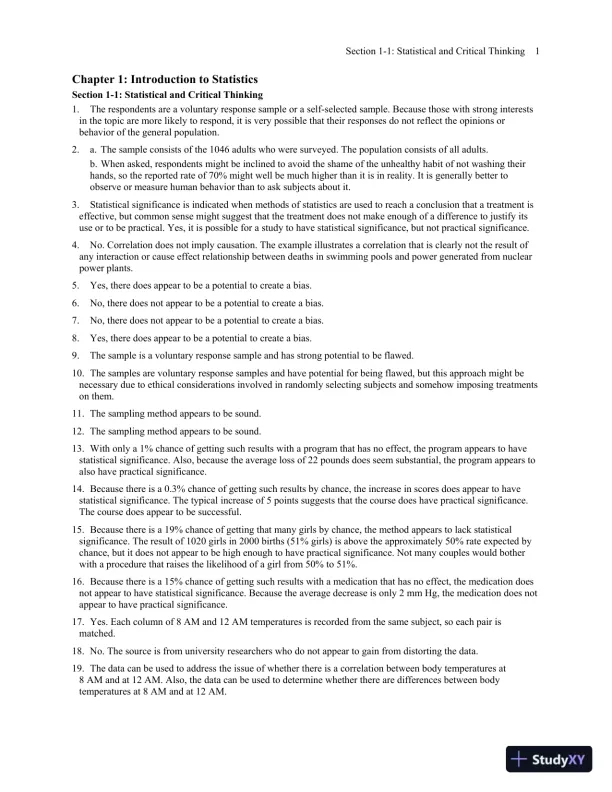
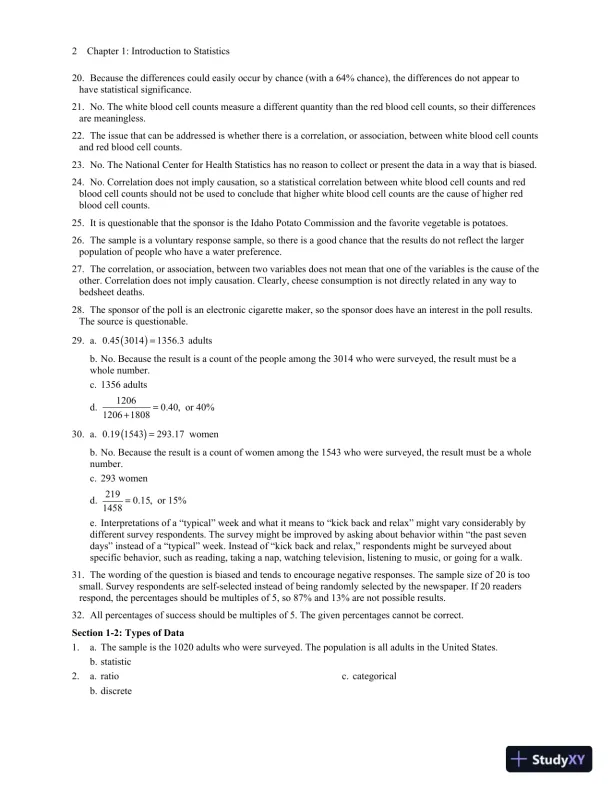
Section 1-1: Statistical and Critical Thinking1Chapter 1: Introduction to StatisticsSection 1-1: Statistical and Critical Thinking1.The respondents are a voluntary response sample or a self-selected sample. Because those with strong interestsin the topic are more likely to respond, it is very possible that their responses do not reflect the opinions orbehavior of the general population.2.a. The sample consists of the 1046 adults who were surveyed. The population consists of all adults.b. When asked, respondents might be inclined to avoid the shame of the unhealthy habit of not washing theirhands, so the reported rate of 70% might well be much higher than it is in reality. It is generally better toobserve or measure human behavior than to ask subjects about it.3.Statistical significance is indicated when methods of statistics are used to reach a conclusion that a treatment iseffective, but common sense might suggest that the treatment does not make enough of a difference to justify itsuse or to be practical. Yes, it is possible for a study to have statistical significance, but not practical significance.4.No. Correlation does not imply causation. The example illustrates a correlation that is clearly not the result ofany interaction or cause effect relationship between deaths in swimming pools and power generated from nuclearpower plants.5.Yes, there does appear to be a potential to create a bias.6.No, there does not appear to be a potential to create a bias.7.No, there does not appear to be a potential to create a bias.8.Yes, there does appear to be a potential to create a bias.9.The sample is a voluntary response sample and has strong potential to be flawed.10. The samples are voluntary response samples and have potential for being flawed, but this approach might benecessary due to ethical considerations involved in randomly selecting subjects and somehow imposing treatmentson them.11. The sampling method appears to be sound.12. The sampling method appears to be sound.13. With only a 1% chance of getting such results with a program that has no effect, the program appears to havestatistical significance. Also, because the average loss of 22 pounds does seem substantial, the program appears toalso have practical significance.14. Because there is a 0.3% chance of getting such results by chance, the increase in scores does appear to havestatistical significance. The typical increase of 5 points suggests that the course does have practical significance.The course does appear to be successful.15. Because there is a 19% chance of getting that many girls by chance, the method appears to lack statisticalsignificance. The result of 1020 girls in 2000 births (51% girls) is above the approximately 50% rate expected bychance, but it does not appear to be high enough to have practical significance. Not many couples would botherwith a procedure that raises the likelihood of a girl from 50% to 51%.16. Because there is a 15% chance of getting such results with a medication that has no effect, the medication doesnot appear to have statistical significance. Because the average decrease is only 2 mm Hg, the medication does notappear to have practical significance.17. Yes. Each column of 8 AM and 12 AM temperatures is recorded from the same subject, so each pair ismatched.18. No. The source is from university researchers who do not appear to gain from distorting the data.19. The data can be used to address the issue of whether there is a correlation between body temperatures at8 AM and at 12 AM. Also, the data can be used to determine whether there are differences between bodytemperatures at 8 AM and at 12 AM.

Page 7

Solution Manual for Biostatistics for the Biological and Health Sciences, 2nd Edition - Page 7 preview image

Loading page image...

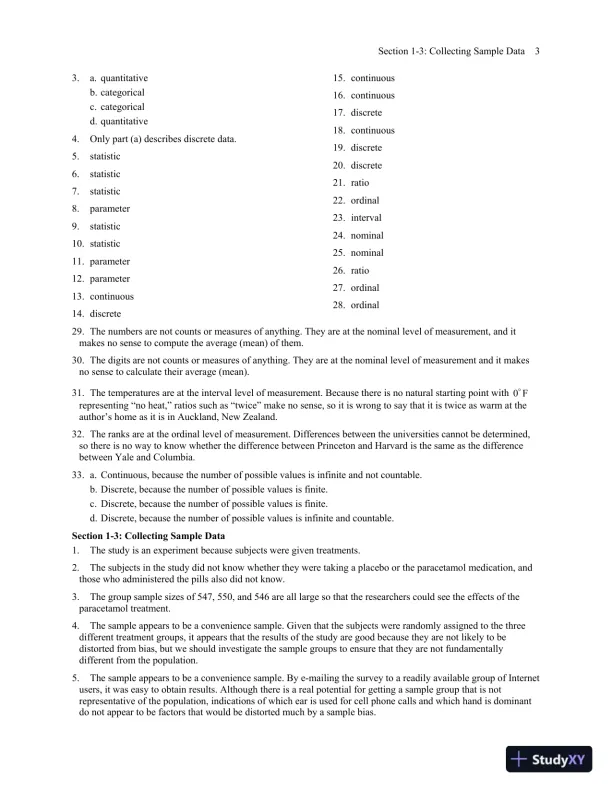
2Chapter 1: Introduction to Statistics20. Because the differences could easily occur by chance (with a 64% chance), the differences do not appear tohave statistical significance.21. No. The white blood cell counts measure a different quantity than the red blood cell counts, so their differencesare meaningless.22. The issue that can be addressed is whether there is a correlation, or association, between white blood cell countsand red blood cell counts.23. No. The National Center for Health Statistics has no reason to collect or present the data in a way that is biased.24. No. Correlation does not imply causation, so a statistical correlation between white blood cell counts and redblood cell counts should not be used to conclude that higher white blood cell counts are the cause of higher redblood cell counts.25. It is questionable that the sponsor is the Idaho Potato Commission and the favorite vegetable is potatoes.26. The sample is a voluntary response sample, so there is a good chance that the results do not reflect the largerpopulation of people who have a water preference.27. The correlation, or association, between two variables does not mean that one of the variables is the cause of theother. Correlation does not imply causation. Clearly, cheese consumption is not directly related in any way tobedsheet deaths.28. The sponsor of the poll is an electronic cigarette maker, so the sponsor does have an interest in the poll results.The source is questionable.29. a.0.45 30141356.3adultsb. No. Because the result is a count of the people among the 3014 who were surveyed, the result must be awhole number.c. 1356 adultsd.12060.40,12061808or 40%30. a.0.19 1543293.17womenb. No. Because the result is a count of women among the 1543 who were surveyed, the result must be a wholenumber.c. 293 womend.2190.15,1458or 15%e. Interpretations of a “typical” week and what it means to “kick back and relax” might vary considerably bydifferent survey respondents. The survey might be improved by asking about behavior within “the past sevendays” instead of a “typical” week. Instead of “kick back and relax,” respondents might be surveyed aboutspecific behavior, such as reading, taking a nap, watching television, listening to music, or going for a walk.31. The wording of the question is biased and tends to encourage negative responses. The sample size of 20 is toosmall. Survey respondents are self-selected instead of being randomly selected by the newspaper. If 20 readersrespond, the percentages should be multiples of 5, so 87% and 13% are not possible results.32. All percentages of success should be multiples of 5. The given percentages cannot be correct.Section 1-2: Types of Data1.a. The sample is the 1020 adults who were surveyed. The population is all adults in the United States.b. statistic2.a. ratiob. discretec. categorical

Page 8

Solution Manual for Biostatistics for the Biological and Health Sciences, 2nd Edition - Page 8 preview image

Loading page image...

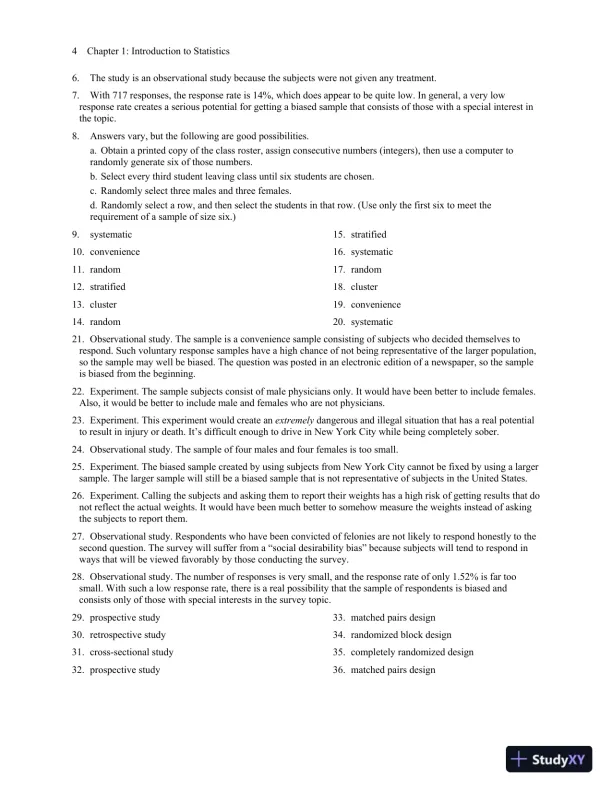
Section 1-3: Collecting Sample Data33.a. quantitativeb. categoricalc. categoricald. quantitative4.Only part (a) describes discrete data.5.statistic6.statistic7.statistic8.parameter9.statistic10. statistic11. parameter12. parameter13. continuous14. discrete15. continuous16. continuous17. discrete18. continuous19. discrete20. discrete21. ratio22. ordinal23. interval24. nominal25. nominal26. ratio27. ordinal28. ordinal29. The numbers are not counts or measures of anything. They are at the nominal level of measurement, and itmakes no sense to compute the average (mean) of them.30. The digits are not counts or measures of anything. They are at the nominal level of measurement and it makesno sense to calculate their average (mean).31. The temperatures are at the interval level of measurement. Because there is no natural starting point with0 Frepresenting “no heat,” ratios such as “twice” make no sense, so it is wrong to say that it is twice as warm at theauthor’s home as it is in Auckland, New Zealand.32. The ranks are at the ordinal level of measurement. Differences between the universities cannot be determined,so there is no way to know whether the difference between Princeton and Harvard is the same as the differencebetween Yale and Columbia.33. a. Continuous, because the number of possible values is infinite and not countable.b. Discrete, because the number of possible values is finite.c. Discrete, because the number of possible values is finite.d. Discrete, because the number of possible values is infinite and countable.Section 1-3: Collecting Sample Data1.The study is an experiment because subjects were given treatments.2.The subjects in the study did not know whether they were taking a placebo or the paracetamol medication, andthose who administered the pills also did not know.3.The group sample sizes of 547, 550, and 546 are all large so that the researchers could see the effects of theparacetamol treatment.4.The sample appears to be a convenience sample. Given that the subjects were randomly assigned to the threedifferent treatment groups, it appears that the results of the study are good because they are not likely to bedistorted from bias, but we should investigate the sample groups to ensure that they are not fundamentallydifferent from the population.5.The sample appears to be a convenience sample. By e-mailing the survey to a readily available group of Internetusers, it was easy to obtain results. Although there is a real potential for getting a sample group that is notrepresentative of the population, indications of which ear is used for cell phone calls and which hand is dominantdo not appear to be factors that would be distorted much by a sample bias.

Page 9

Solution Manual for Biostatistics for the Biological and Health Sciences, 2nd Edition - Page 9 preview image

Loading page image...

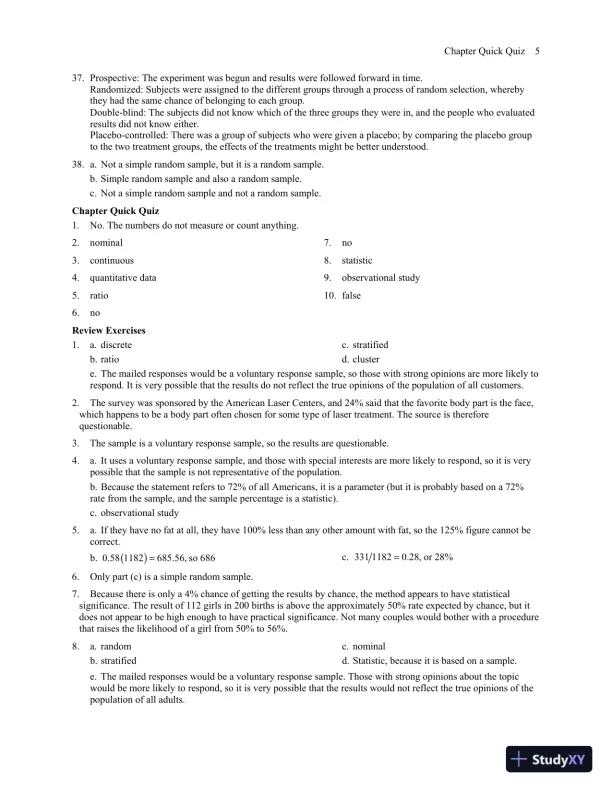
4Chapter 1: Introduction to Statistics6.The study is an observational study because the subjects were not given any treatment.7.With 717 responses, the response rate is 14%, which does appear to be quite low. In general, a very lowresponse rate creates a serious potential for getting a biased sample that consists of those with a special interest inthe topic.8.Answers vary, but the following are good possibilities.a. Obtain a printed copy of the class roster, assign consecutive numbers (integers), then use a computer torandomly generate six of those numbers.b. Select every third student leaving class until six students are chosen.c. Randomly select three males and three females.d. Randomly select a row, and then select the students in that row. (Use only the first six to meet therequirement of a sample of size six.)9.systematic10. convenience11. random12. stratified13. cluster14. random15. stratified16. systematic17. random18. cluster19. convenience20. systematic21. Observational study. The sample is a convenience sample consisting of subjects who decided themselves torespond. Such voluntary response samples have a high chance of not being representative of the larger population,so the sample may well be biased. The question was posted in an electronic edition of a newspaper, so the sampleis biased from the beginning.22. Experiment. The sample subjects consist of male physicians only. It would have been better to include females.Also, it would be better to include male and females who are not physicians.23. Experiment. This experiment would create anextremelydangerous and illegal situation that has a real potentialto result in injury or death. It’s difficult enough to drive in New York City while being completely sober.24. Observational study. The sample of four males and four females is too small.25. Experiment. The biased sample created by using subjects from New York City cannot be fixed by using a largersample. The larger sample will still be a biased sample that is not representative of subjects in the United States.26. Experiment. Calling the subjects and asking them to report their weights has a high risk of getting results that donot reflect the actual weights. It would have been much better to somehow measure the weights instead of askingthe subjects to report them.27. Observational study. Respondents who have been convicted of felonies are not likely to respond honestly to thesecond question. The survey will suffer from a “social desirability bias” because subjects will tend to respond inways that will be viewed favorably by those conducting the survey.28. Observational study. The number of responses is very small, and the response rate of only 1.52% is far toosmall. With such a low response rate, there is a real possibility that the sample of respondents is biased andconsists only of those with special interests in the survey topic.29. prospective study30. retrospective study31. cross-sectional study32. prospective study33. matched pairs design34. randomized block design35. completely randomized design36. matched pairs design

Page 10

Solution Manual for Biostatistics for the Biological and Health Sciences, 2nd Edition - Page 10 preview image

Loading page image...

Chapter Quick Quiz537. Prospective: The experiment was begun and results were followed forward in time.Randomized: Subjects were assigned to the different groups through a process of random selection, wherebythey had the same chance of belonging to each group.Double-blind: The subjects did not know which of the three groups they were in, and the people who evaluatedresults did not know either.Placebo-controlled: There was a group of subjects who were given a placebo; by comparing the placebo groupto the two treatment groups, the effects of the treatments might be better understood.38. a. Not a simple random sample, but it is a random sample.b. Simple random sample and also a random sample.c. Not a simple random sample and not a random sample.Chapter Quick Quiz1.No. The numbers do not measure or count anything.2.nominal3.continuous4.quantitative data5.ratio6.no7.no8.statistic9.observational study10. falseReview Exercises1.a. discreteb. ratioc. stratifiedd. clustere. The mailed responses would be a voluntary response sample, so those with strong opinions are more likely torespond. It is very possible that the results do not reflect the true opinions of the population of all customers.2.The survey was sponsored by the American Laser Centers, and 24% said that the favorite body part is the face,which happens to be a body part often chosen for some type of laser treatment. The source is thereforequestionable.3.The sample is a voluntary response sample, so the results are questionable.4.a. It uses a voluntary response sample, and those with special interests are more likely to respond, so it is verypossible that the sample is not representative of the population.b. Because the statement refers to 72% of all Americans, it is a parameter (but it is probably based on a 72%rate from the sample, and the sample percentage is a statistic).c. observational study5.a. If they have no fat at all, they have 100% less than any other amount with fat, so the 125% figure cannot becorrect.b.0.58 1182685.56,so 686c.331 11820.28,or 28%6.Only part (c) is a simple random sample.7.Because there is only a 4% chance of getting the results by chance, the method appears to have statisticalsignificance. The result of 112 girls in 200 births is above the approximately 50% rate expected by chance, but itdoes not appear to be high enough to have practical significance. Not many couples would bother with a procedurethat raises the likelihood of a girl from 50% to 56%.8.a. randomb. stratifiedc. nominald. Statistic, because it is based on a sample.e. The mailed responses would be a voluntary response sample. Those with strong opinions about the topicwould be more likely to respond, so it is very possible that the results would not reflect the true opinions of thepopulation of all adults.

Page 11

Solution Manual for Biostatistics for the Biological and Health Sciences, 2nd Edition - Page 11 preview image

Loading page image...

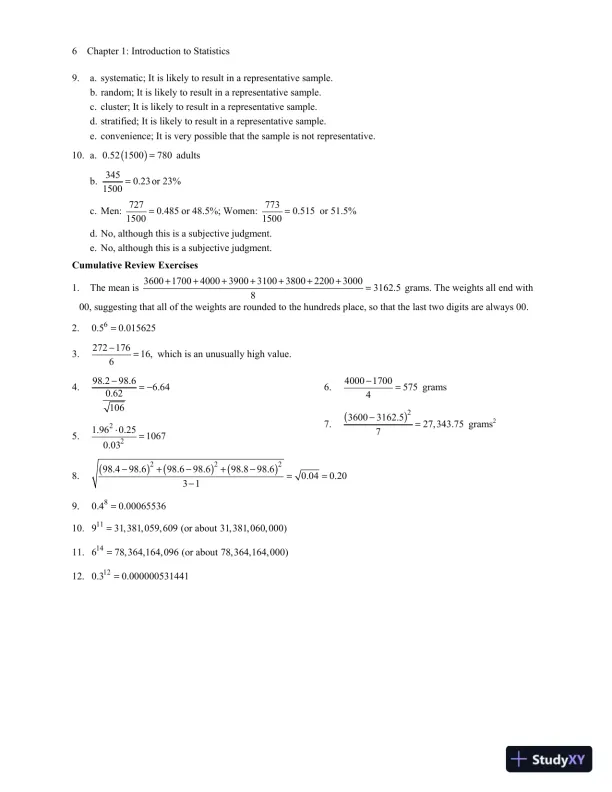
6Chapter 1: Introduction to Statistics9.a. systematic; It is likely to result in a representative sample.b. random; It is likely to result in a representative sample.c. cluster; It is likely to result in a representative sample.d. stratified; It is likely to result in a representative sample.e. convenience; It is very possible that the sample is not representative.10. a.0.52 1500780adultsb.3450.231500or 23%c. Men:7270.4851500or 48.5%; Women:7730.5151500or 51.5%d. No, although this is a subjective judgment.e. No, although this is a subjective judgment.Cumulative Review Exercises1.The mean is360017004000390031003800220030003162.58grams. The weights all end with00, suggesting that all of the weights are rounded to the hundreds place, so that the last two digits are always 00.2.60.50.0156253.27217616,6which is an unusually high value.4.98.298.66.640.62106 5.221.960.2510670.036.400017005754grams7.236003162.527, 343.757grams28.22298.498.698.698.698.898.60.040.20319.80.40.0006553610.11931, 381,059, 609 (or about 31, 381,060, 000)11.14678,364,164,096 (or about 78,364,164,000)12.120.30.000000531441

Page 12

Solution Manual for Biostatistics for the Biological and Health Sciences, 2nd Edition - Page 12 preview image

Loading page image...

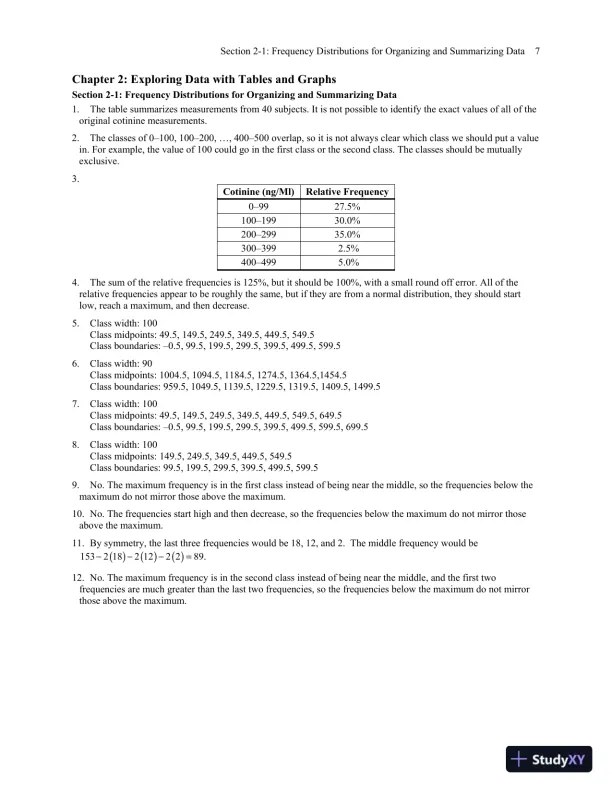
Section 2-1: Frequency Distributions for Organizing and Summarizing Data7Chapter 2: Exploring Data with Tables and GraphsSection 2-1: Frequency Distributions for Organizing and Summarizing Data1.The table summarizes measurements from 40 subjects. It is not possible to identify the exact values of all of theoriginal cotinine measurements.2.The classes of 0–100, 100–200, …, 400–500 overlap, so it is not always clear which class we should put a valuein. For example, the value of 100 could go in the first class or the second class. The classes should be mutuallyexclusive.3.Cotinine (ng/Ml)Relative Frequency0–9927.5%100–19930.0%200–29935.0%300–3992.5%400–4995.0%4.The sum of the relative frequencies is 125%, but it should be 100%, with a small round off error. All of therelative frequencies appear to be roughly the same, but if they are from a normal distribution, they should startlow, reach a maximum, and then decrease.5.Class width: 100Class midpoints: 49.5, 149.5, 249.5, 349.5, 449.5, 549.5Class boundaries: –0.5, 99.5, 199.5, 299.5, 399.5, 499.5, 599.56.Class width: 90Class midpoints: 1004.5, 1094.5, 1184.5, 1274.5, 1364.5,1454.5Class boundaries: 959.5, 1049.5, 1139.5, 1229.5, 1319.5, 1409.5, 1499.57.Class width: 100Class midpoints: 49.5, 149.5, 249.5, 349.5, 449.5, 549.5, 649.5Class boundaries: –0.5, 99.5, 199.5, 299.5, 399.5, 499.5, 599.5, 699.58.Class width: 100Class midpoints: 149.5, 249.5, 349.5, 449.5, 549.5Class boundaries: 99.5, 199.5, 299.5, 399.5, 499.5, 599.59.No. The maximum frequency is in the first class instead of being near the middle, so the frequencies below themaximum do not mirror those above the maximum.10. No. The frequencies start high and then decrease, so the frequencies below the maximum do not mirror thoseabove the maximum.11. By symmetry, the last three frequencies would be 18, 12, and 2. The middle frequency would be 1532 182 122 289.12. No. The maximum frequency is in the second class instead of being near the middle, and the first twofrequencies are much greater than the last two frequencies, so the frequencies below the maximum do not mirrorthose above the maximum.

Page 13

Solution Manual for Biostatistics for the Biological and Health Sciences, 2nd Edition - Page 13 preview image

Loading page image...

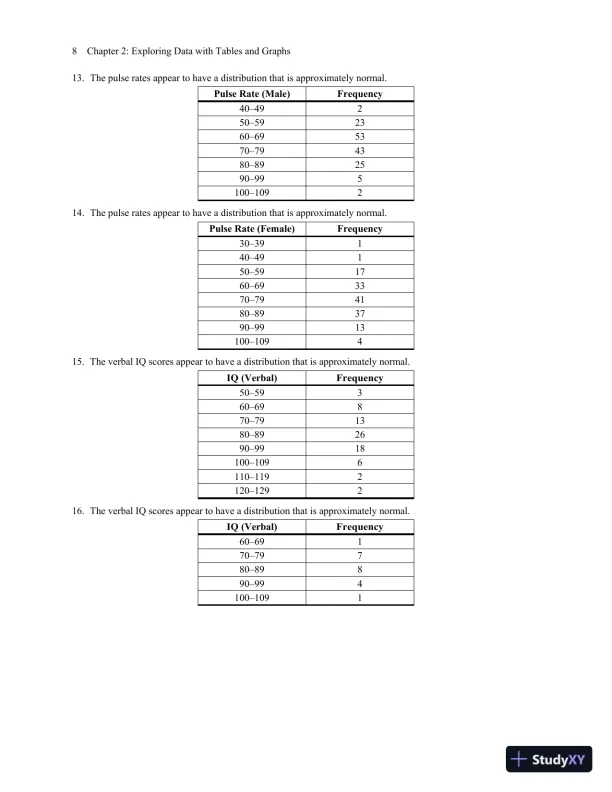
8Chapter 2: Exploring Data with Tables and Graphs13. The pulse rates appear to have a distribution that is approximately normal.Pulse Rate (Male)Frequency40–49250–592360–695370–794380–892590–995100–109214. The pulse rates appear to have a distribution that is approximately normal.Pulse Rate (Female)Frequency30–39140–49150–591760–693370–794180–893790–9913100–109415. The verbal IQ scores appear to have a distribution that is approximately normal.IQ (Verbal)Frequency50–59360–69870–791380–892690–9918100–1096110–1192120–129216. The verbal IQ scores appear to have a distribution that is approximately normal.IQ (Verbal)Frequency60–69170–79780–89890–994100–1091

Page 14

Solution Manual for Biostatistics for the Biological and Health Sciences, 2nd Edition - Page 14 preview image

Loading page image...

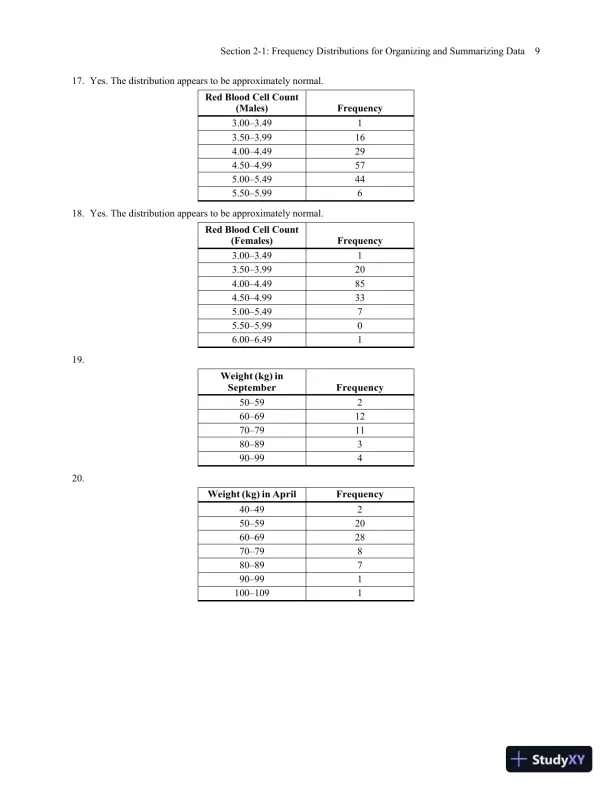
Section 2-1: Frequency Distributions for Organizing and Summarizing Data917. Yes. The distribution appears to be approximately normal.Red Blood Cell Count(Males)Frequency3.00–3.4913.50–3.99164.00–4.49294.50–4.99575.00–5.49445.50–5.99618. Yes. The distribution appears to be approximately normal.Red Blood Cell Count(Females)Frequency3.00–3.4913.50–3.99204.00–4.49854.50–4.99335.00–5.4975.50–5.9906.00–6.49119.Weight (kg) inSeptemberFrequency50–59260–691270–791180–89390–99420.Weight (kg) in AprilFrequency40–49250–592060–692870–79880–89790–991100–1091

Page 15

Solution Manual for Biostatistics for the Biological and Health Sciences, 2nd Edition - Page 15 preview image

Loading page image...

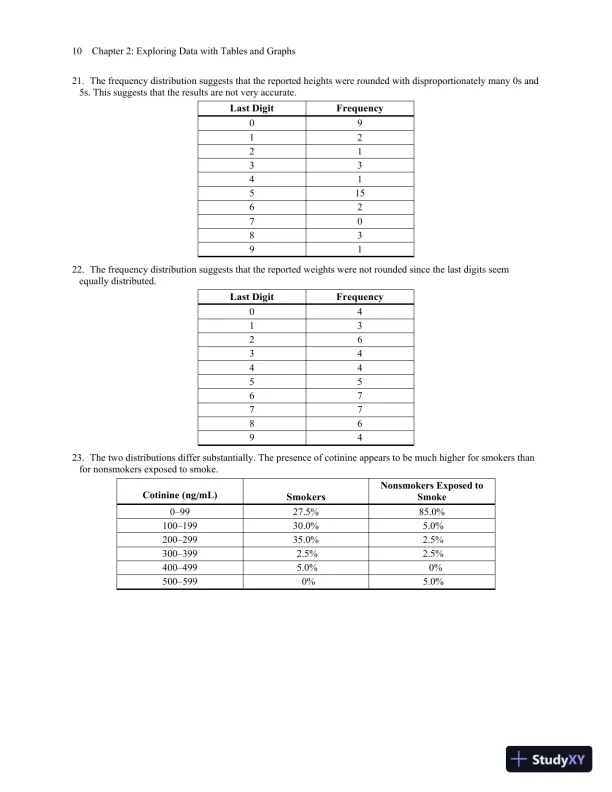
10Chapter 2: Exploring Data with Tables and Graphs21. The frequency distribution suggests that the reported heights were rounded with disproportionately many 0s and5s. This suggests that the results are not very accurate.Last DigitFrequency09122133415156270839122. The frequency distribution suggests that the reported weights were not rounded since the last digits seemequally distributed.Last DigitFrequency0413263444556777869423. The two distributions differ substantially. The presence of cotinine appears to be much higher for smokers thanfor nonsmokers exposed to smoke.Cotinine (ng/mL)SmokersNonsmokers Exposed toSmoke0–9927.5%85.0%100–19930.0%5.0%200–29935.0%2.5%300–3992.5%2.5%400–4995.0%0%500–5990%5.0%

Page 16

Solution Manual for Biostatistics for the Biological and Health Sciences, 2nd Edition - Page 16 preview image

Loading page image...

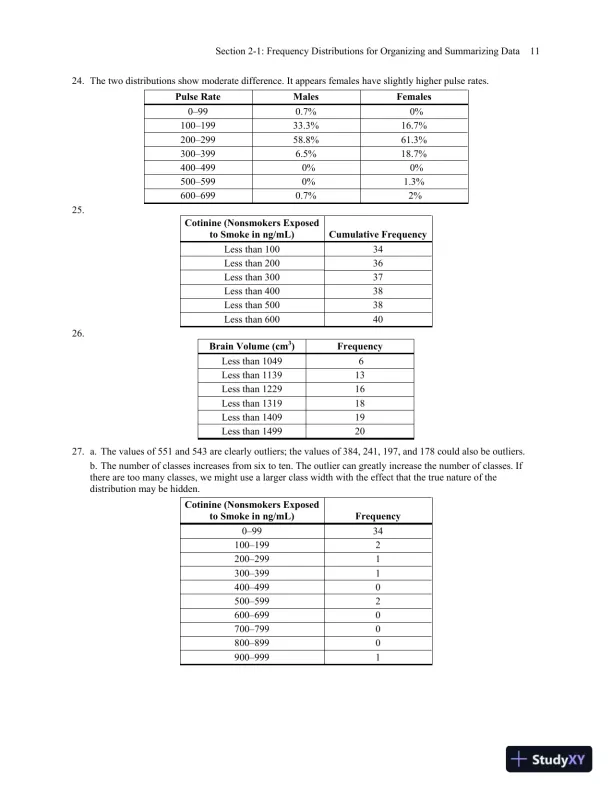
Section 2-1: Frequency Distributions for Organizing and Summarizing Data1124. The two distributions show moderate difference. It appears females have slightly higher pulse rates.Pulse RateMalesFemales0–990.7%0%100–19933.3%16.7%200–29958.8%61.3%300–3996.5%18.7%400–4990%0%500–5990%1.3%600–6990.7%2%25.Cotinine (Nonsmokers Exposedto Smoke in ng/mL)Cumulative FrequencyLess than 10034Less than 20036Less than 30037Less than 40038Less than 50038Less than 6004026.Brain Volume (cm3)FrequencyLess than 10496Less than 113913Less than 122916Less than 131918Less than 140919Less than 14992027. a. The values of 551 and 543 are clearly outliers; the values of 384, 241, 197, and 178 could also be outliers.b. The number of classes increases from six to ten. The outlier can greatly increase the number of classes. Ifthere are too many classes, we might use a larger class width with the effect that the true nature of thedistribution may be hidden.Cotinine (Nonsmokers Exposedto Smoke in ng/mL)Frequency0–9934100–1992200–2991300–3991400–4990500–5992600–6990700–7990800–8990900–9991
Preview Mode

This document has 204 pages. Sign in to access the full document!

Study Now!

XY-Copilot AI
Unlimited Access
Secure Payment
Instant Access
24/7 Support
Document Chat

Related Documents

View all