Test Bank for Biostatistics for the Biological and Health Sciences , 2nd Edition

Test Bank for Biostatistics for the Biological and Health Sciences , 2nd Edition makes exam preparation simple with structured and comprehensive questions.

Charlotte Garcia
Contributor
4.5
161
9 months ago
Preview (31 of 182 Pages)
100%
Purchase to unlock

Page 1

Test Bank for Biostatistics for the Biological and Health Sciences , 2nd Edition - Page 1 preview image

Loading page image...

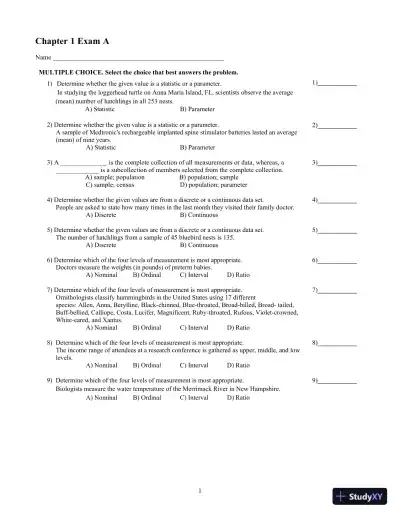
1Chapter 1 ExamANameMULTIPLE CHOICE. Select the choice that best answers the problem.1)Determine whether the given value is a statistic or a parameter.In studying the loggerhead turtle on Anna Maria Island, FL, scientists observe the average(mean) number of hatchlings in all 253 nests.A) StatisticB) Parameter1)____________2) Determine whether the given value is a statistic or a parameter.A sample of Medtronic's rechargeable implanted spine stimulator batteries lasted an average(mean) of nine years.A) StatisticB) Parameter2)____________3) A ______________ is the complete collection of all measurements or data, whereas, a_____________ is a subcollection of members selected from the complete collection.A) sample; populationB) population; sampleC) sample; censusD) population; parameter3)____________4) Determine whether the given values are from a discrete or a continuous data set.People are asked to state how many times in the last month they visited their family doctor.A) DiscreteB) Continuous4)____________5) Determine whether the given values are from a discrete or a continuous data set.The number of hatchlings from a sample of 45 bluebird nests is 135.A) DiscreteB) Continuous5)____________6) Determine which of the four levels of measurement is most appropriate.Doctors measure the weights (in pounds) of preterm babies.A) NominalB) OrdinalC) IntervalD) Ratio6)____________7) Determine which of the four levels of measurement is most appropriate.Ornithologists classify hummingbirds in the United States using 17 differentspecies: Allen, Anna, Berylline, Black-chinned, Blue-throated, Broad-billed, Broad- tailed,Buff-bellied, Calliope, Costa, Lucifer, Magnificent, Ruby-throated, Rufous, Violet-crowned,White-eared, and Xantus.A) NominalB) OrdinalC) IntervalD) Ratio7)____________8) Determine which of the four levels of measurement is most appropriate.The income range of attendees at a research conference is gathered as upper, middle, and lowlevels.A) NominalB) OrdinalC) IntervalD) Ratio8)____________9) Determine which of the four levels of measurement is most appropriate.Biologists measure the water temperature of the Merrimack River in New Hampshire.A) NominalB) OrdinalC) IntervalD) Ratio9)____________

Page 2

Test Bank for Biostatistics for the Biological and Health Sciences , 2nd Edition - Page 2 preview image

Loading page image...

Page 3

Test Bank for Biostatistics for the Biological and Health Sciences , 2nd Edition - Page 3 preview image

Loading page image...

210) Identify the population.A graduate student conducts a research study on undergraduate student smoking habits. Shebegins with a survey to 500 randomly selected undergraduate students from 10 randomlyselected U.S. universities.A) 500 undergraduate students from 10 U.S. universitiesB) Undergraduate students from U.S. universitiesC) Graduate students from U.S. universitiesD) Smokers in the U.S.10)___________11) Determine whether the given description corresponds to an observational study or anexperiment.In a study of cold symptoms, the body temperatures of study participants were taken.A) Observational studyB) Experiment11)___________12) Determine whether the given description corresponds to an observational study or anexperiment.Children with attention deficit hyperactivity disorder are randomly divided into four treatmentgroups (the Tomatis Method, the Dore Method, the Brain Gym, and a control group) tocompare differences in focus and concentration.A) Observational studyB) Experiment12)___________13) Identify the type of observational study: cross-sectional, retrospective, or prospective.A researcher from the department of defense is studying the psychology of trauma.He plans to follow the children of service members who died in Afghanistan for the next 20years.A) Cross-sectionalB) RetrospectiveC) Prospective13)___________14) Identify the type of observational study: cross-sectional, retrospective, or prospective.Scientists studying the migration habits of Aleutian geese collect data from reports measuringthe number of geese during "fly-offs" over the past 15 years.A) Cross-sectionalB) RetrospectiveC) Prospective14)___________15) Determine the type of sampling used: systematic, convenience, stratified, or cluster.To conduct a study of hospital admittance procedures, a list of hospital locations according tocounty is compiled. All the hospitals from 20 randomly selected counties are selected to besurveyed.A) SystematicB) ConvenienceC) StratifiedD) Cluster15)___________16) Determine the type of sampling used: systematic, convenience, stratified, or cluster.A county water quality control officer obtains a list of all residential addresses in the countyand constructs a sample of homes to monitor by selecting every 200th home on the list.A) SystematicB) ConvenienceC) StratifiedD) Cluster16)___________17) Determine the type of sampling used: systematic, convenience, stratified, or cluster.To obtain a sample of pregnant women, a researcher contacts her son's preschool teacher for alist of names.A) SystematicB) ConvenienceC) StratifiedD) Cluster17)___________

Page 4

Test Bank for Biostatistics for the Biological and Health Sciences , 2nd Edition - Page 4 preview image

Loading page image...

318) Determine the type of sampling used: systematic, convenience, stratified, or cluster.Biologists divide the regions where Red foxes are found into the Nearctic, Palearctic, Oriental,Ethiopian, and the Australian region. They plan to follow 100 female foxes from each region tofind the average (mean) number of their offspring.A) SystematicB) ConvenienceC) StratifiedD) Cluster18)___________19) To assess the variation in measurement (in cubic centimeters) of pre-filled syringes containingexperimental cervical cancer vaccine, manufacturers select every 200th syringe beginning at arandom moment. Does this sampling plan result in a random sample? Simple random sample?A) Yes; yesB) Yes; noC) No; yesD) No; no19)___________20) To monitor levels of the giardia parasite in the Rio Grande, aquatic biologists collect test tubesamples at various locations determined by a computer randomization program. Does thissampling plan result in a random sample? Simple random sample?A) Yes; yesB) Yes; noC) No; yesD) No; no20)___________

Page 5

Test Bank for Biostatistics for the Biological and Health Sciences , 2nd Edition - Page 5 preview image

Loading page image...

4Answer KeyTestname: CHAPTER 1 EXAM A1) B2) A3) B4) A5) A6) D7) A8) B9) C10) B11) A12) B13) C14) B15) D16) A17) B18) C19) B20) A

Page 6

Test Bank for Biostatistics for the Biological and Health Sciences , 2nd Edition - Page 6 preview image

Loading page image...

5Chapter 1 ExamBNameMULTIPLE CHOICE. Select the choice that best answers the problem.1) Determine whether the given value is a statistic or a parameter.Nurses measure and calculate the average (mean) body temperature for all 187 patients at aregional hospital.A) StatisticB) Parameter1)____________2) Determine whether the given value is a statistic or a parameter.A sample of Sidewinder, or Horned, Rattlesnakes is found to have an average (mean) length of26 inches.A) StatisticB) Parameter2)____________3) Determine whether the given values are from a discrete or a continuous data set.A sample of male Bighorn sheep has an average (mean) horn base circumference of 43.2centimeters.A) DiscreteB) Continuous3)____________4) Determine whether the given values are from a discrete or a continuous data set.The Produce for Better Health Foundation manages the campaign advocating consumers to eat“5 Fruits and Vegetables A Day for Better Health” and gathers data on the number of servingsof fruit and vegetables that a sample of Americans ate yesterdayA) DiscreteB) Continuous4)____________5) Determine which of the four levels of measurement is most appropriate.Doctors measure the weights (in pounds) of pregnant women.A) NominalB) OrdinalC) IntervalD) Ratio5)____________6) Determine which of the four levels of measurement is most appropriate.Scientists classify the four major deserts in North America using different regions: the GreatBasin, the Mojave, the Sonoran, and the Chihuahuan.A) NominalB) OrdinalC) IntervalD) Ratio6)____________7) Determine which of the four levels of measurement is most appropriate.Physicians rank the severity of asthma using mild intermittent asthma, mild persistent asthma,moderate persistent asthma, severe persistent asthma, or brittle asthma.A) NominalB) OrdinalC) IntervalD) Ratio7)____________8) Determine which of the four levels of measurement is most appropriate.Biologists monitor the air temperature of the Biosphere 2 in Oracle, Arizona.A) NominalB) OrdinalC) IntervalD) Ratio8)____________9) A ______________ is the complete collection of all measurements or data, whereas, a_____________ is a subcollection of members selected from the complete collection.A) population; sampleB) sample; populationC) sample; censusD) population; parameter9)____________10) Determine whether the given description corresponds to an observational study or anexperiment.In a study of the Bald Eagle population, the number of breeding pairs is counted.A) Observational studyB) Experiment10)___________

Page 7

Test Bank for Biostatistics for the Biological and Health Sciences , 2nd Edition - Page 7 preview image

Loading page image...

611) Determine whether the given description corresponds to an observational study or anexperiment.Patients with severe heart failure were randomly assigned to two treatment groups to comparedeath and hospitalization rates. One group was treated with drug therapy while the othergroup was treated with a combination of drugs and an electrical device.A) Observational studyB) Experiment11)___________12) Identify the type of observational study: cross-sectional, retrospective, or prospective.Climatologists studying global warming record the average (mean) temperature ofthe Earth and the change in size of the ice caps during the next 50 years.A) Cross-sectionalB) RetrospectiveC) Prospective12)___________13) Identify the type of observational study: cross-sectional, retrospective, or prospective.Geneticists studying the biodiversity of roses collect data from reports classifying the numberof varieties during the past 30 years.A) Cross-sectionalB) RetrospectiveC) Prospective13)___________14) In a cross-sectional study, data are _____________.A) observed, measured, and collected at one point of timeB) observed, measure, and collected over a period of timeC) collected from a past time periodD) collected in the future from groups that share common factors14)___________15) Determine the type of sampling used: systematic, convenience, stratified, or cluster.Biologists studying the pH level of state waterways obtain a sample of streams from arandomly generated list by selecting every 5th stream on the list.A) SystematicB) ConvenienceC) StratifiedD) Cluster15)___________16) Determine the type of sampling used: systematic, convenience, stratified, or cluster.To conduct a survey of the interest of U.S. citizens in Yellowstone National Park, a list ofzipcodes is compiled. All citizens in 50 different zipcodes are selected to be mailed a survey.A) SystematicB) ConvenienceC) StratifiedD) Cluster16)___________17) Determine the type of sampling used: systematic, convenience, stratified, or cluster.To obtain a sample of diabetics, a graduate student contacts nearby hospitals for a list ofnames.A) SystematicB) ConvenienceC) StratifiedD) Cluster17)___________18) Determine the type of sampling used: systematic, convenience, stratified, or cluster.Medical researchers following living organ donors classify donors according to whether theydonated a kidney, a portion of the liver, a portion of the lung, bone marrow, or blood. Thegeneral health of 200 donors from each category is monitored for five years.A) SystematicB) ConvenienceC) StratifiedD) Cluster18)___________

Page 8

Test Bank for Biostatistics for the Biological and Health Sciences , 2nd Edition - Page 8 preview image

Loading page image...

719) To assess the variation in volume (in cubic centimeters) of different manufacturers’ pre-filledhormone injections, reproductive biologists select every 50th syringe beginning at a randommoment. Does this sampling plan result in a random sample? Simple random sample?A) Yes; yesB) Yes; noC) No; yesD) No; no19)___________20) To monitor the population of Herring in Manchester, New Hampshire, fisheries biologistscatch samples of the fish in a river at various locations determined by a computerrandomization program. Does this sampling plan result in a random sample? Simple randomsample?A) Yes; yesB) Yes; noC) No; yesD) No; no20)___________

Page 9

Test Bank for Biostatistics for the Biological and Health Sciences , 2nd Edition - Page 9 preview image

Loading page image...

8Answer KeyTestname: CHAPTER 1 EXAM B1) B2) A3) B4) A5) D6) A7) B8) C9) A10) A11) B12) C13) B14) A15) A16) D17) B18) C19) B20) A

Page 10

Test Bank for Biostatistics for the Biological and Health Sciences , 2nd Edition - Page 10 preview image

Loading page image...

9Chapter 1 ExamCNameSHORT ANSWER. Using the following information, write the word, phrase, or value that best answers theproblem.1) Determine whether the given value is a statistic or a parameter.Park rangers identified the average (mean) number of reported bear sightings in all 32 stateparks.1)____________2) Determine whether the given value is a statistic or a parameter.A sample of patients had kidney transplants that lasted an average (mean) of 15 years.2)____________3) Determine whether the given values are from a discrete or a continuous data set.The mean number of times that a sample of 50 adults have visited their dentist is 2.3 times.3)____________4) Determine whether the given values are from a discrete or a continuous data set.The number of caterpillars from a sample of 55 milkweed plants is 185.4)____________5) Determine which of the four levels of measurement (nominal, ordinal, interval, or ratio) is mostappropriate.Doctors measure the weights (in pounds) of diabetic patients.5)____________6) Determine which of the four levels of measurement (nominal, ordinal, interval, or ratio) is mostappropriate.Marine Biologists classify turtles in the state of Florida using 5 different species: Loggerhead,Green Turtle, Leatherback, Hawk’s Bill, and Kemp’s Ridley.6)____________7) Determine which of the four levels of measurement (nominal, ordinal, interval, or ratio) is mostappropriate.The cholesterol level for patients at a hospital is noted as optimal, borderline high, and high.7)____________8) Determine which of the four levels of measurement (nominal, ordinal, interval, or ratio) is mostappropriate.Biologists measure the water temperature of Lake Okeechobee8)____________9) Identify the sample.A graduate student conducts a research study on undergraduate student nutrition.She begins with a survey to 250 randomly selected undergraduate students from five randomlyselected U.S. universities.9)____________10) Identify the population.A researcher randomly selects 40 male prairie chickens at the Crane Meadows Nature Centerin Nebraska to study their mating rituals.10)___________11)Determine whether the given description corresponds to an observational study or anexperiment.A doctor gives a new medication to half of his patients with the flu and a placebo to the otherhalf of his patients with the flu.11)___________12) Would an observational study or an experiment be more appropriate to investigate theeffects on humans of a substance known to be toxic? Explain.12)___________13) Would an observational study or an experiment be more appropriate for investigating theeffects on fertilizer on plant growth? Explain.13)___________

Page 11

Test Bank for Biostatistics for the Biological and Health Sciences , 2nd Edition - Page 11 preview image

Loading page image...

1014) Determine whether the given description corresponds to an observational study or anexperiment.Felines with diabetes are randomly divided into three treatment groups (oral insulin, injectedinsulin, and a control group) to compare differences in glucose levels.14)___________15) Identify the type of observational study: cross-sectional, retrospective, or prospective.A researcher from the county school system is studying the effects of an intervention on thegrowth mindset on school performance. He plans to follow the children who participated inthis intervention for the next 5 years to see if performance differs for those who participatedfrom those who didn’t.15)___________16) Identify the type of observational study: cross-sectional, retrospective, or prospective.Scientists studying pelican injuries due to fishing line entanglement collect data fromreports measuring the number of injured pelicans over the past 12 years.16)___________17) Determine the type of sampling used: systematic, convenience, stratified, or cluster.A county water quality control officer obtains a list of all residential addresses in the countyand constructs a sample of homes to monitor by selecting every 200th home on the list.17)___________18) Explain the difference between stratified and cluster sampling.18)___________19) Determine the type of sampling used: systematic, convenience, stratified, or cluster.To obtain a sample of females with rotator cuff injuries, a researcher asks people she sees ather gym whether they have had such an injury.19)___________20) To assess the variation in measurement (in mL) of pre-filled vials containing Albuterol,manufacturers select every 100th vial beginning at a random moment. Does this samplingplan result in a random sample? Simple random sample?20)___________

Page 12

Test Bank for Biostatistics for the Biological and Health Sciences , 2nd Edition - Page 12 preview image

Loading page image...

11Answer KeyTestname: CHAPTER 1 EXAM C1)Parameter2)Statistic3)Discrete4)Discrete5)Ratio6)Nominal7)Ordinal8)Interval9)250 randomly selected undergraduate students from five randomly selected U.S. universities10)All the male prairie chickens at the Crane Meadows Nature Center in Nebraska11)Experiment12)Observation13)Experiment14)Experiment15)Prospective16)Retrospective17)Systematic18)In both cluster sampling and stratified sampling, sub -groups (clusters or strata) are formed. However, instratified sampling, all strata are used and a sample is selected from each strata. In cluster sampling, a sampleof the clusters is first selected, then all members of those clusters are selected.19)Convenience20)Yes; no

Page 13

Test Bank for Biostatistics for the Biological and Health Sciences , 2nd Edition - Page 13 preview image

Loading page image...

12Chapter 2 ExamANameMULTIPLE CHOICE. Select the choice that best answers the problem.Use the frequency distribution to answer the first four questions. A sample of 80 juvenile salmon is grouped intothe resulting frequency distribution based on their weights.Weight (in grams)Frequency100-14915150-19910200-24930250-299251) The distribution of the histogram for the weights of the juvenile salmon appears:A) NormalB) Skewed leftC) UniformD) Skewed right1)____________2) If a relative frequency distribution were constructed for the weights of the salmon, what wouldbe the relative frequency for the class weighing 150-199 grams?A) 12.5%B) 31.25%C) 18.75%D) 37.5%2)____________3) If a cumulative frequency distribution were constructed for the weights of the salmon, whatwould be the cumulative frequency for the class weighing less than 200 grams?A) 15B) 25C) 55D) 803)____________4) If a pie chart were constructed for the weights of the salmon, what would be the measure of thecentral angle for the class weighing 200-249 grams?A) 67.5°B) 112.5°C) 45°D) 135°4)____________

Page 14

Test Bank for Biostatistics for the Biological and Health Sciences , 2nd Edition - Page 14 preview image

Loading page image...

135)Which choice displays the best graphic display of the amount of nitrous oxide (NO) explainedby the amount of carbon monoxide (CO) emissions in million metric tons over a ten yearperiod in the United States? The data set is below:CO5638570858935807588159396024603259466022NO351349345339335335362371376384A)Nitrous Oxide (NO) and Carbon Monoxide (CO)B)Nitrous Oxide (NO) and Carbon Monoxide (CO)Emissions in the U.S. over Ten YearsEmissions in the U.S. over Ten YearsC)Nitrous Oxide (NO) and Carbon Monoxide(CO)D)Nitrous Oxide (NO) and Carbon Monoxide (CO)Emissions in the U.S. over Ten YearsEmissions in the U.S. over Ten Years5)____________500055006000650013579Emission in MillionMetric TonsYearCONO560057005800590060006100320340360380400CO Emission in MillionMetric TonsNO Emission in Million Metric Tons3203403603804005600580060006200NO Emission in MillionMetric TonsCO Emission in Million Metric Tons

Page 15

Test Bank for Biostatistics for the Biological and Health Sciences , 2nd Edition - Page 15 preview image

Loading page image...

146) A nurse measured the blood pressure of each person who visited her clinic. Following is arelative-frequency histogram for the systolic blood pressure readings for those people agedbetween 25 and 40 years. The blood pressure readings were given to the nearest whole number.Approximately what percentage of the people aged 25-40 had a systolic blood pressure readingbetween 110 and 119 mm Hg inclusive?Systolic Blood Pressure for People Aged 25 – 40 YearsA) 0.35%B) 3.5%C) 30%D) 35%6)____________7) A nurse measured the blood pressure of each person who visited her clinic. Following is arelative-frequency histogram for the systolic blood pressure readings for those people agedbetween 25 and 40 years. The blood pressure readings were given to the nearest whole number.Approximately what percentage of the people aged 25-40 had a systolic blood pressure readingbetween 110 and 139 mm Hg inclusive?Systolic Blood Pressure for People Aged 25 – 40 YearsA) 75%B) 89%C) 59%D) 39%7)____________

Page 16

Test Bank for Biostatistics for the Biological and Health Sciences , 2nd Edition - Page 16 preview image

Loading page image...

158) A researcher records the number of new loggerhead turtle nests she locates each day. The dataare as follows.1011814710101187Which of these choices displays the correct dotplot?8)____________9) The following data show the number of patients seen by a doctor in a day for twelve days.46 65 55 43 51 48 57 30 43 49 32 56Which of these choices displays the correct stemplot?A)B)30230243 3 6 8943 6 8951 5 6741 3 5 6765659)____________

Page 17

Test Bank for Biostatistics for the Biological and Health Sciences , 2nd Edition - Page 17 preview image

Loading page image...

1610) The scatterplot below displays the amount of nitrous oxide (NO) explained by the amount ofcarbon monoxide (CO) emissions in million metric tons over a ten year period in the UnitedStates. Select the choice that best describes any relationship between the variables.A) There is a negative linear association between NO and CO.B) There is a positive linear association between NO and CO.C) Overall, there is no noticeable relationship between NO and CO.D) NO can be explained by CO.10)___________11) The following frequency distribution represents the age at which Alzheimer’s was firstdiagnosed. Find the class midpoint for the interval 70-79.AgeNumber of Diagnoses50-59260-69470-79680-891590-995A) 75.0 yearsB) 70.5 yearsC) 74.5 yearsD) 79.5 years11)___________33034035036037038039056005650570057505800585059005950600060506100NO Emission in Million Metric TonsCO Emission in Million Metric TonsNitrous Oxide (NO) and Carbon Monoxide (CO) Emissionsin the U.S. for Ten Years

Page 18

Test Bank for Biostatistics for the Biological and Health Sciences , 2nd Edition - Page 18 preview image

Loading page image...

1712) The histogram below represents the number of digital thermometers per household for asample of U.S. households. What is the sample size?Number of Digital Thermometers Per U.S. HouseholdA) 100 householdsB) 5 householdsC) 50 householdsD) 90 households12)___________13) The weights (in pounds) of 22 members of the junior varsity football team are listed below.144 152 142 151 160 152 131 164 141 153 140144 175 156 147 133 172 159 135 159 148 171Which of these choices displays the correct stemplot?A)B)131 35131 35140 1 2 4 4 78141 2 2 3 6 99151 2 2 3 6 99150 1 2 4 4 7816041604171 25171 2513)___________14) The two key parts of a regression equation involve the ____________ and they-____________.A) slope; interceptB) asymptote; interceptC) slope; axisD) asymptote; axis14)___________15) Analysis of the data from 25 mothers indicates that an infant’s birth weight (g),y, can beestimated by a mother’s weight (kg),x, using the regression equation311501.yx=+Forevery _______ kg increase in a mother’s weight, the infant’s birth weight increases by_________ g.A) 31; 1501B) 1; 31C) 31; 1D) 1501; 3115)___________

Page 19

Test Bank for Biostatistics for the Biological and Health Sciences , 2nd Edition - Page 19 preview image

Loading page image...

1816) Analysis of the data from 25 mothers indicates that an infant’s birth weight (g),y, can beestimated by a mother’s weight (kg),x, using the regression equation311501.yx=+If amother’s weight is 70 kg, the infant’s birth weight can be estimated as _________ g.A) 48,701B) 1718C) 46D) 367116)___________17) Excessive drinking and the episodes of throat cancer have a high correlation, but it does notprove _________.A) correlationB) causationC) exponentiationD) a linear relationship17)___________18) The frequency distribution below summarizes employee years of service for a regionalhospital. Determine the width of each class.Years ofServiceFrequency1-556-102011-152516-201021-25526-303A) 5 yearsB) 6 yearsC) 4 yearsD) 10 years18)___________19) The frequency distribution below summarizes employee years of service for a regionalhospital. Determine the class boundary(ies) for the class 11 - 15.Years ofServiceFrequency1-556-102011-152516-201021-25526-303A) 25 yearsB) 11 and 15 yearsC) 10.5 and 15.5 yearsD) 10 and 16 years19)___________20) A quality control manager wants to monitor the production of its pills to be sure that the meanamount of medication does not change over time. Which of the following graphs is mosthelpful for that purposeA) Time-series graphB) Pareto chartC) Pie chartD) Histogram20)___________

Page 20

Test Bank for Biostatistics for the Biological and Health Sciences , 2nd Edition - Page 20 preview image

Loading page image...

19Answer KeyTestname: CHAPTER 2 EXAM A1)B2)A3)B4)D5)D6)D7)A8)A9)A10)C11)C12)A13)A14)A15)B16)D17)B18)A19)C20)A

Page 21

Test Bank for Biostatistics for the Biological and Health Sciences , 2nd Edition - Page 21 preview image

Loading page image...

20Chapter 2 ExamBNameMULTIPLE CHOICE. Select the choice that best answers the problem.Use the frequency distribution to answer the next eight questions. A sample of 272 log jams found in riverchannels in the Northwest U.S. is grouped into the resulting frequency distribution based on the width of thechannel in which the log jams were found.Width of ChannelFrequency of Log Jams0-4m1035-9m8210-14m4915-19m1620-24m1625-29m61) The distribution of the histogram for the width of the channels appears ______________.A) NormalB) Skewed leftC) UniformD) Skewed right1)____________2) If a relative frequency distribution were constructed for the width of the channels, what wouldbe the relative frequency for the class with a width of 20-24m?A) 5.9%B) 18%C) 2.2%D) 30.1%2)____________3) If a cumulative frequency distribution were constructed for the width of the channels, whatwould be the cumulative frequency for the class width less than 10m?A) 103B) 234C) 185D) 2503)____________4) If a pie chart were constructed for the width of the channels, what would be the measure of thecentral angle for the class width 10-14m?A) 21.2°B) 136.3°C) 108.5°D) 64.9°4)____________5) The histogram below represents the number of digital thermometers per household for a sampleof U.S. households. What is the sample size?Number of Digital Thermometers Per U.S. HouseholdA) 5B) 50C) 90D) 1005)____________

Page 22

Test Bank for Biostatistics for the Biological and Health Sciences , 2nd Edition - Page 22 preview image

Loading page image...

216) The following data consists of the weights (in pounds) of 15 randomly selected women and theweights of 15 randomly selected men. Which of these choices displays the correct back-to-back stemplot?Women:128150118166142122137110175152145126139111170Men:140153199186169136176162196155173190141166153A)B)6)____________7) According toUSA Today, the largest categories of sports equipment sales are as follows: fishing($2.0 billion); firearms and hunting ($3.1 billion); camping ($1.7 billion); and golf ($2.5billion). What type of graph would depict these different categories and their relative amountsthe best?A) A pie chartB) A bar chartC) A column chartD) A Pareto chart7)____________8) The frequency distribution below summarizes the home sale prices in the city of Summerhill forthe month of June. Determine the width of each class.Sale Price(in thousand $)Frequency80.0 - 110.92111.0 - 141.95142.0 – 172.97173.0 – 203.910204.0 – 234.93235.0 – 265.91A) 61B) 31C) 28D) 308)____________MenWomen6105 339 626369 601112131415161718190 182 68792502605MenWomen6105 339 62639696111213141516171819012 6879250 24605

Page 23

Test Bank for Biostatistics for the Biological and Health Sciences , 2nd Edition - Page 23 preview image

Loading page image...

229) A nurse measured the blood pressure of each person who visited her clinic. Following is arelative-frequency histogram for the systolic blood pressure readings for those people agedbetween 25 and 40 years. The blood pressure readings were given to the nearest whole number.Approximately what percentage of the people aged 25 -40 had a systolic blood pressurereading between 110 and 139 mm Hg inclusive?Systolic Blood Pressure for People Aged 25 – 40 YearsA) 59%B) 39%C) 89%D) 75%9)____________10) The following frequency distribution d ep ic ts the scores on a math test. Find the classmidpointofscores for the interval95-99.ScoresNumber of Students75-79280-84485-89690-941595-995A) 97.5B) 97.0C) 96.5D) 98.010)___________

Page 24

Test Bank for Biostatistics for the Biological and Health Sciences , 2nd Edition - Page 24 preview image

Loading page image...

2311) A nurse measured the blood pressure of each person who visited her clinic. Following is arelative-frequency histogram for the systolic blood pressure readings for those people agedbetween 25 and 40 years. The blood pressure readings were given to the nearest whole number.Approximately what percentage of the people aged 25 -40 had a systolic blood pressurereading between 110 and 119 mm Hg inclusive?Systolic Blood Pressure for People Aged 25 – 40 YearsA) 35%B) 0.35%C) 3.5%D) 30%11)___________12) The Kappa Iota Sigma Fraternity polled its members on the weekend party theme. The votewas as follows: six for toga, four for hayride, eight for luau, and two for masquerade. Whichof these choices displays the correct Pareto chart?12)___________

Page 25

Test Bank for Biostatistics for the Biological and Health Sciences , 2nd Edition - Page 25 preview image

Loading page image...

2413) The following data show the number of patients seen by a doctor in a day for 12 days.46 65 55 43 51 48 57 30 43 49 32 56Which of these choices displays the correct stemplot?A)B)30230243 3 6 8943 6 8951 5 6741 3 5 67656513)___________14) The following frequency distribution displays the scores on a math test. Find the classboundaries of scores interval 40-59.ScoresNumber ofstudents50-59260-69470-79680-891590-995A) 49.5, 59.5B) 50.5, 59.5C) 49.5, 58.5D) 50.5, 58.514)___________15) The following data represents the age at which a sample of patients had their first dentalimplant.383937374438413839354239433741Which of these choices displays the correct dotplot?15)___________

Page 26

Test Bank for Biostatistics for the Biological and Health Sciences , 2nd Edition - Page 26 preview image

Loading page image...

2516) A pharmaceutical company is always trying to create new flavors of children’s cough medicine.They are market testing three kinds to find out which one has the best chance of beingconsumed. They give small samples of each to 20 children at a pediatrician’s office. Four tasterspreferred the Strawberry Cream, 12 preferred Choco-Nuts, and four loved the Orange Mint.Construct a Pareto chart to represent these preferences. Choose the vertical scale so that therelative frequencies are represented.16)___________

Page 27

Test Bank for Biostatistics for the Biological and Health Sciences , 2nd Edition - Page 27 preview image

Loading page image...

2617) The frequency distribution below summarizes the home sale prices in the city of Summerhillfor the month of June. Determine the class midpoint (in thousand $) for the class 235.0 -265.9.Sale Price (in thousand$) Frequency80.0 -110.92111.0 -141.95142.0 -172.97173.0 -203.910204.0 -234.93235.0 -265.91A) 250.4B) 250.55C) 250.45D) 250.517)___________18) Identify the cumulative frequency distribution that corresponds to the given frequencydistribution.Age at DeathFrequency0-29430-591660-896090-11920A)B)Age at DeathCumulativeFrequencyAge at DeathCumulativeFrequencyLess than 300.04Less than 304Less than 600.20Less than 6020Less than 900.80Less than 9080Less than 1201.00Less than 120100C)D)Age at DeathCumulativeFrequencyAge at DeathCumulativeFrequency0-294Less than 3010030-5920Less than 608060-8980Less than 908290-119100Less than 120418)___________19) The linear __________ coefficient denoted byrmeasures the __________ of the linearassociation between two variables.A) correlation; strengthB) probability; likelihoodC) exponential; exponentD) squares; weakness19)___________20) Smoking and the episodes of lung cancer have a high correlation, but it does not prove_________.A) causationB) correlationC) exponentiationD) a linear relationship20)___________

Page 28

Test Bank for Biostatistics for the Biological and Health Sciences , 2nd Edition - Page 28 preview image

Loading page image...

27Answer KeyTestname: CHAPTER 2 EXAM B1)D2)A3)C4)D5)D6)A7)D8)B9)D10)B11)A12)A13)A14)A15)D16)A17)C18)B19)A20)A

Page 29

Test Bank for Biostatistics for the Biological and Health Sciences , 2nd Edition - Page 29 preview image

Loading page image...

28Chapter 2 ExamCNameSHORT ANSWER. Using the following information, write the word, phrase, or value that best answers theproblem.1) A study of physical fitness tests for 12 randomly selected Pre-Medical students measured theirexercise capacity (in minutes). The following data resulted:341933304336324131313718Construct a stem and leaf plot of the students' exercise capacity.1)____________Use the frequency distribution to answer the next six questions. A sample of 80 juvenile salmon is grouped into theresulting frequency distribution based on their weights.Weight (in grams)Frequency100-14915150-19910200-24930250-299252) Identify the class width, the class midpoints, and the class boundaries for the class 150 – 199.2)____________3) Construct a corresponding histogram for the weights of the juvenile salmon.3)____________4) Describe the shape of the distribution of the histogram for the weights of the juvenile salmon.4)____________5)If a relative frequency distribution were constructed for the weights of the salmon, what wouldbe the relative frequency for the class weighing 200-249 grams?5)____________6) If a cumulative frequency distribution were constructed for the weights of the salmon, whatwould be the cumulative frequency for the class weighing less than 250 grams?6)____________7) If a pie chart were constructed for the weights of the salmon, what would be the measure of thecentral angle for the class weighing 150-199 grams?7)____________8) A bar chart and a Pareto chart both use bars to show frequencies of categories of categoricaldata. What characteristic distinguishes a Pareto chart from a bar chart and how does thatcharacteristic help us in understanding the data?8)____________9) A medical school performed a study to find the main causes leading to its studentsdropping out of school. Thirty cases were analyzed, and a primary cause was assigned toeach case. The causes included unexcused absences (U), illness (I), family problems (F), andother causes (O). The results for the thirty cases are listed below:UUUIFOOUIFFOUIIFIIOUIFFUUIIOFUConstruct a table summarizing the frequency distribution of the primary causes leading tostudent dropout.9)____________

Page 30

Test Bank for Biostatistics for the Biological and Health Sciences , 2nd Edition - Page 30 preview image

Loading page image...

2910) Use the high closing values of Statstar Inc. stock from the years 2005 - 2016 to construct atime-series graph. (Letx= 0 represent 2005 and so on.) Identify a trend.YearHighYearHigh20052006200720082009201048534755586120112012201320142015201662606842517810)___________11)Describeatleasttwoadvantagestousingstemplotsratherthanfrequencydistributions.11)___________12) The following data set represents the systolic blood pressure (in mm Hg) for 24 adults asmeasured at their annual physical.10512511098102115110 123 118 10195 128110105122107118107117 125 116 110101 107Construct a frequency distribution with 4 classes, a class width of 2 hours, and a lower limitof 100 for class 1.12)___________13) The graph below shows the number of car accidents occurring in one city in each of theyears 2011 through 2016. The number of accidents dropped in 2013 after a new speed limitwas imposed. Does the graph distort the data? How would you redesign the graph to be lessmisleading?Number of Car Accidents for 2011 – 201613)___________14) Upon entering a medical exam, 26 patients were asked their ages. The results are shownbelow. Construct a histogram to represent the data (with 5 classes beginning with a lowerclass limit of 19.5 and a class width of 10). What is the approximate age at the center?435628636766524837514060626645213549325361536931485914)___________15) Suppose that a data set has a minimum value of 24 and a maximum of 79 and that youwant 5 classes. Explain how to find the class width for this frequency table. What happens ifyou mistakenly use a class width of 11 instead of 12?15)___________

Page 31

Test Bank for Biostatistics for the Biological and Health Sciences , 2nd Edition - Page 31 preview image

Loading page image...

3016) Describe the differences between a histogram and a stemplot and discuss the advantages anddisadvantages of each.16)___________17) The frequency table below shows the amount of weight loss during the first month of adiet program for a group of men. Construct a frequency polygon. Applying a looseinterpretation of the requirements for a normal distribution, do the pounds of weight lossappear to be normally distributed? Why or why not?Weight(lb)Frequency5-728-10911-131814-161317-19420-22117)___________18)Define the difference between a relative frequency distribution and a cumulative frequencydistribution.18)___________19) Graphs should be constructed in a way that is fair and objective. A common deceptive graphalters the axes of the graph in what way?19)___________20)Describe how a data point labeled as an outlier can affect the analysis of a data set in afrequency distribution or histogram.20)___________
Preview Mode

This document has 182 pages. Sign in to access the full document!

Study Now!

XY-Copilot AI
Unlimited Access
Secure Payment
Instant Access
24/7 Support
Document Chat

Related Documents

View all