Solution Manual for Macroeconomics, 2nd Edition

Solution Manual for Macroeconomics, 2nd Edition offers step-by-step solutions to help you understand tough concepts with ease.

Seller Steve
Contributor
4.1
53
8 months ago
Preview (31 of 210 Pages)
100%
Purchase to unlock

Page 1

Solution Manual for Macroeconomics, 2nd Edition - Page 1 preview image

Loading page image...

MicroeconomicsSecondEditionDaron AcemogluDavid LaibsonJohn ListSolutions ManualScott OgawaNorthwestern University

Page 2

Solution Manual for Macroeconomics, 2nd Edition - Page 2 preview image

Loading page image...

Page 3

Solution Manual for Macroeconomics, 2nd Edition - Page 3 preview image

Loading page image...

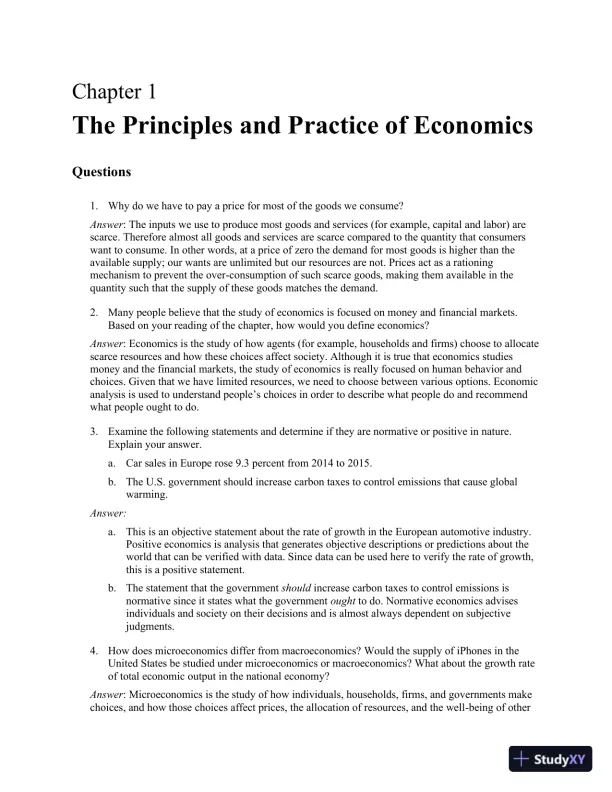
Chapter 1The Principles and Practice of EconomicsQuestions1.Why do we have to pay a price for most of the goods we consume?Answer: The inputs we use to produce most goods and services (for example, capital and labor) arescarce. Therefore almost all goods and services are scarce compared to the quantity that consumerswant to consume. In other words, at a price of zero the demand for most goods is higher than theavailable supply; our wants are unlimited but our resources are not. Prices act as a rationingmechanism to prevent the over-consumption of such scarce goods, making them available in thequantity such that the supply of these goods matches the demand.2.Many people believe that the study of economics is focused on money and financial markets.Based on your reading of the chapter, how would you define economics?Answer: Economics is the study of how agents (for example, households and firms) choose to allocatescarce resources and how these choices affect society. Although it is true that economics studiesmoney and the financial markets, the study of economics is really focused on human behavior andchoices. Given that we have limited resources, we need to choose between various options. Economicanalysis is used to understand people’s choices in order to describe what people do and recommendwhat people ought to do.3.Examine the following statements and determine if they are normative or positive in nature.Explain your answer.a.Car sales in Europe rose 9.3 percent from 2014 to 2015.b.The U.S. government should increase carbon taxes to control emissions that cause globalwarming.Answer:a.This is an objective statement about the rate of growth in the Europeanautomotive industry.Positive economics is analysis that generates objective descriptions or predictions about theworld that can be verified with data. Since data can be used here to verify the rate of growth,this is a positive statement.b.The statement that the governmentshouldincrease carbon taxes to control emissions isnormative since it states what the governmentoughtto do. Normative economics advisesindividuals and society on their decisions and is almost always dependent on subjectivejudgments.4.How does microeconomics differ from macroeconomics? Would the supply of iPhones in theUnited States be studied under microeconomics or macroeconomics? What about the growth rateof total economic output in the national economy?Answer: Microeconomics is the study of how individuals, households, firms, and governments makechoices, and how those choices affect prices, the allocation of resources, and the well-being of other

Page 4

Solution Manual for Macroeconomics, 2nd Edition - Page 4 preview image

Loading page image...

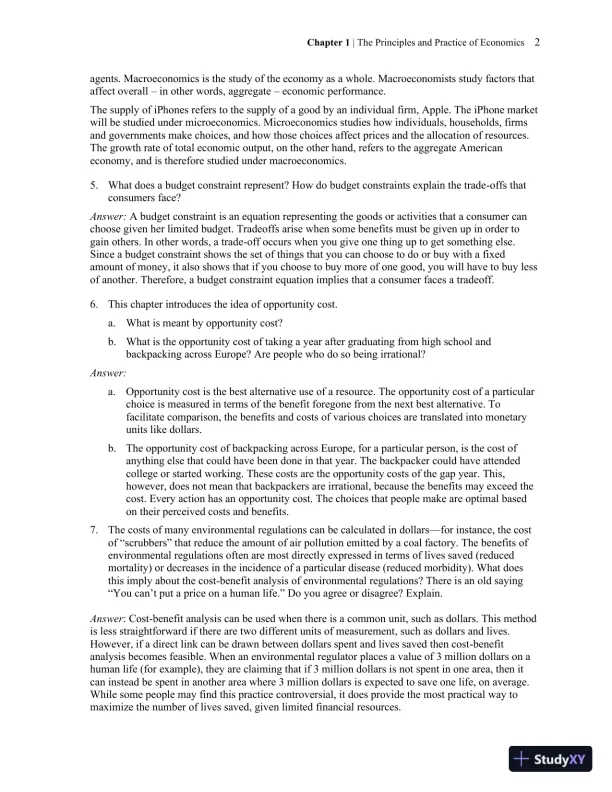
Chapter 1| The Principles and Practice of Economics2agents. Macroeconomics is the study of the economy as a whole. Macroeconomists study factors thataffect overallin other words, aggregateeconomic performance.The supply of iPhones refers to the supply of a good by an individual firm, Apple. The iPhone marketwill be studied under microeconomics. Microeconomics studies how individuals, households, firmsand governments make choices, and how those choices affect prices and the allocation of resources.The growth rate of total economic output, on the other hand, refers to the aggregate Americaneconomy, and is therefore studied under macroeconomics.5.What does a budget constraint represent? How do budget constraints explain the trade-offs thatconsumers face?Answer:A budget constraint is an equation representing the goods or activities that a consumer canchoose given her limited budget. Tradeoffs arise when some benefits must be given up in order togain others. In other words, a trade-off occurs when you give one thing up to get something else.Since a budget constraint shows the set of things that you can choose to do or buy with a fixedamount of money, it also shows that if you choose to buy more of one good, you will have to buy lessof another. Therefore, a budget constraint equation implies that a consumer faces a tradeoff.6.This chapter introduces the idea of opportunity cost.a.What is meant by opportunity cost?b.What is the opportunity cost of taking a year after graduating from high school andbackpacking across Europe? Are people who do so being irrational?Answer:a.Opportunity cost is the best alternative use of a resource. The opportunity cost of a particularchoice is measured in terms of the benefit foregone from the next best alternative. Tofacilitate comparison, the benefits and costs of various choices are translated into monetaryunits like dollars.b.The opportunity cost of backpacking across Europe, for a particular person, is the cost ofanything else that could have been done in that year. The backpacker could have attendedcollege or started working. These costs are the opportunity costs of the gap year. This,however, does not mean that backpackers are irrational, because the benefits may exceed thecost. Every action has an opportunity cost. The choices that people make are optimal basedon their perceived costs and benefits.7.The costs of many environmental regulations can be calculated in dollarsfor instance, the costof “scrubbers” that reduce the amount of air pollution emitted by a coal factory. The benefits ofenvironmental regulations often are most directly expressed in terms of lives saved (reducedmortality) or decreases in the incidence of a particular disease (reduced morbidity). What doesthis imply about the cost-benefit analysis of environmental regulations? There is an old saying“You can’t put a price on a human life.” Do you agree or disagree? Explain.Answer: Cost-benefit analysiscan be used when there is a common unit, such as dollars.Thismethodis less straightforward if there are two different units of measurement, such as dollars and lives.However, if a direct link can be drawn between dollars spent and lives saved then cost-benefitanalysis becomes feasible. When an environmental regulator places a value of 3 million dollars on ahuman life (for example), they are claiming that if 3 million dollars is not spent in one area, then itcan instead be spent in another area where 3 million dollars is expected tosave one life, on average.While some people may find this practicecontroversial, it does provide the most practical way tomaximize the number of lives saved, given limited financial resources.

Page 5

Solution Manual for Macroeconomics, 2nd Edition - Page 5 preview image

Loading page image...

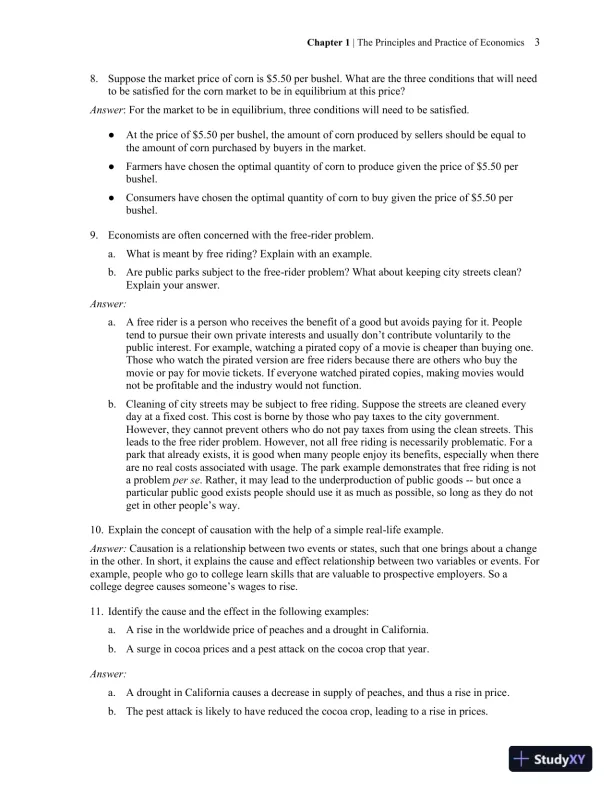
Chapter 1| The Principles and Practice of Economics38.Suppose the market price of corn is $5.50 per bushel. What are the three conditions that will needto be satisfied for the corn market to be in equilibrium at this price?Answer: For the market to be in equilibrium, three conditions will need to be satisfied.At the price of $5.50 per bushel, the amount of corn produced by sellers should be equal tothe amount of corn purchased by buyers in the market.Farmers have chosen theoptimal quantity of corn to produce given the price of $5.50 perbushel.Consumers have chosen the optimal quantity of corn to buy given the price of $5.50 perbushel.9.Economists are often concerned with the free-rider problem.a.What is meant byfree riding? Explain with an example.b.Are public parks subject to the free-rider problem? What about keeping city streets clean?Explain your answer.Answer:a.A free rider is a person who receives the benefit of a good but avoids paying for it. Peopletend to pursue their own private interests and usually don’t contribute voluntarily to thepublic interest. For example, watching a pirated copy of a movie is cheaper than buying one.Those who watch thepirated version arefree riders because there are others who buy themovie or pay for movie tickets. If everyone watched pirated copies, making movies wouldnot be profitable and the industry would not function.b.Cleaning of city streets may be subject to free riding. Suppose the streets are cleaned everyday at a fixed cost. This cost is borne by those who pay taxes to the city government.However, they cannot prevent others who do not pay taxes from using the clean streets. Thisleads to the free rider problem. However, not all freeridingis necessarily problematic. For apark that already exists, it isgood when many people enjoy its benefits, especially when thereare no real costs associated with usage. The parkexample demonstrates that freeriding is nota problemper se. Rather, it may lead to the underproduction of public goods--but once aparticular public good exists people should use it as much as possible, so long as they do notget in other people’s way.10.Explain the concept of causation with the help of a simple real-life example.Answer:Causation is a relationship between two events or states, such that one brings about a changein the other. In short, it explains the cause and effect relationship between two variables or events. Forexample, people who go to college learn skills that are valuable to prospective employers. So acollegedegree causes someone’s wages to rise.11.Identify the cause and the effect in the following examples:a.A rise in the worldwide price of peaches and a droughtin California.b.A surge in cocoa prices and a pest attack on the cocoa crop that year.Answer:a.A droughtin California causes a decrease in supply of peaches, and thus a rise in price.b.The pest attack is likely to have reduced the cocoa crop, leading to a rise in prices.

Page 6

Solution Manual for Macroeconomics, 2nd Edition - Page 6 preview image

Loading page image...

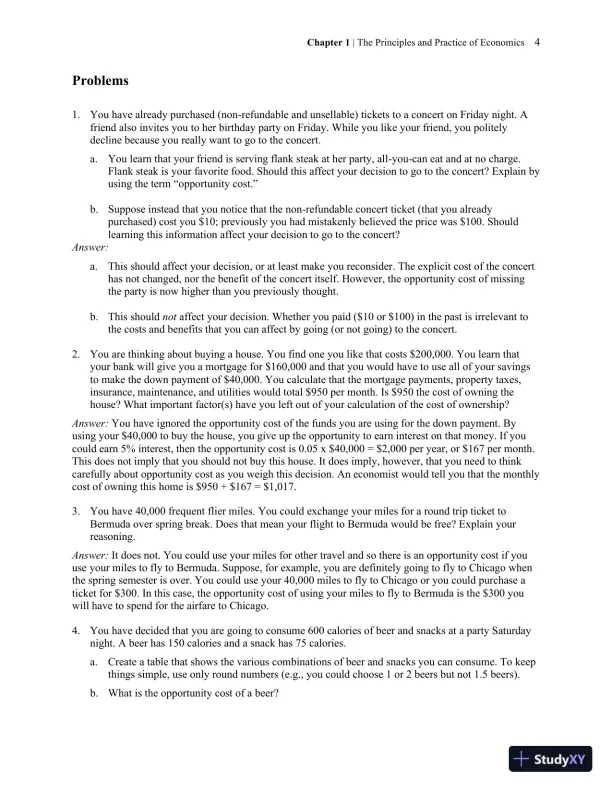
Chapter 1| The Principles and Practice of Economics4Problems1.You have already purchased (non-refundable and unsellable) tickets to a concert on Friday night. Afriend also invites you to her birthday party onFriday. While you like your friend, you politelydecline because you really want to go to the concert.a.You learn that your friend is serving flank steak at her party, all-you-can eat and at no charge.Flank steak is your favorite food. Should this affect your decision to go to the concert? Explain byusing the term “opportunity cost.”b.Suppose instead that you notice that the non-refundable concert ticket (that you alreadypurchased) cost you $10; previously you had mistakenly believed the price was $100. Shouldlearning this information affect your decision to go to the concert?Answer:a.This should affect your decision,or at least make you reconsider. The explicit cost of the concerthas not changed, nor the benefit of the concert itself. However, theopportunity cost of missingthe party is now higher than you previously thought.b.This shouldnotaffect your decision. Whether you paid ($10 or $100) in the past is irrelevant tothe costs and benefits that you can affect by going (or not going) to the concert.2.You are thinking about buying a house. You find one you like that costs $200,000. You learn thatyour bank will give you a mortgage for $160,000 and that you would have to use all of your savingsto make the down payment of $40,000. You calculate that the mortgage payments, property taxes,insurance, maintenance, and utilities would total $950 per month. Is $950 the cost of owning thehouse? What important factor(s) have you left out of your calculation of the cost of ownership?Answer:You have ignored the opportunity cost of the funds you are using for the down payment. Byusing your $40,000 to buy the house, you give up the opportunity to earn interest on that money. If youcould earn 5% interest, then the opportunity cost is 0.05 x $40,000 = $2,000 per year, or $167 per month.This does not imply that you should not buy this house. It does imply, however, that you need to thinkcarefully about opportunity cost as you weigh this decision. An economist would tell you that the monthlycost of owning this home is $950 + $167 = $1,017.3.You have 40,000 frequent flier miles. You could exchange your miles for a round trip ticket toBermuda over spring break. Does that mean your flight to Bermuda would be free? Explain yourreasoning.Answer:It does not. You could use your miles for other travel and so there is an opportunity cost if youuse your miles to fly to Bermuda. Suppose, for example, you are definitely going to fly to Chicago whenthe spring semester is over. You could use your 40,000 miles to fly to Chicago or you could purchase aticket for $300. In this case, the opportunity cost of using your miles to fly to Bermuda is the $300 youwill have to spend for the airfare to Chicago.4.You have decided that you are going to consume 600 calories of beer and snacks at a party Saturdaynight. A beer has 150 calories and a snack has 75 calories.a.Create a table that shows the various combinations of beer and snacks you can consume. To keepthings simple, use only round numbers (e.g., you could choose 1 or 2 beers but not 1.5 beers).b.What is the opportunity cost of a beer?

Page 7

Solution Manual for Macroeconomics, 2nd Edition - Page 7 preview image

Loading page image...

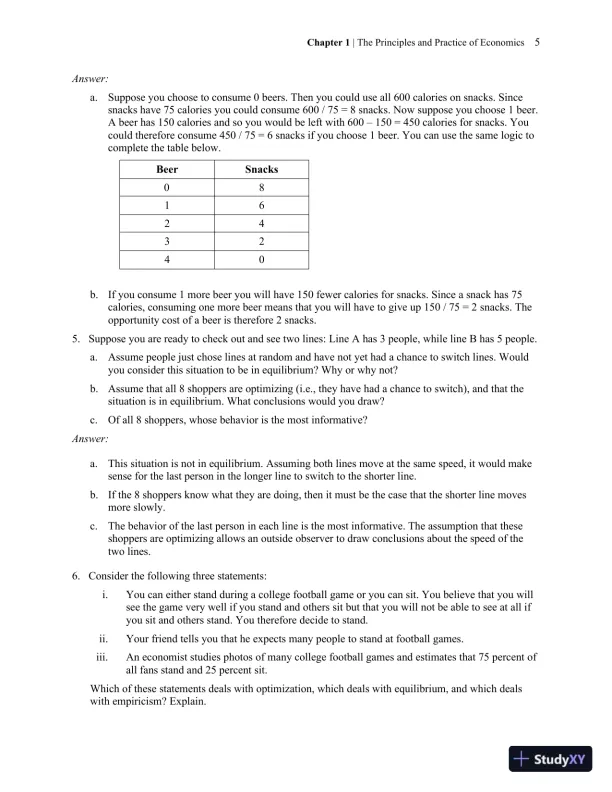
Chapter 1| The Principles and Practice of Economics5Answer:a.Suppose you choose to consume 0 beers. Then you could use all 600 calories on snacks. Sincesnacks have 75 calories you could consume 600 / 75 = 8 snacks. Now suppose you choose 1 beer.A beer has 150 calories and so you would be left with 600150 = 450 calories for snacks. Youcould therefore consume 450 / 75 = 6 snacks if you choose 1 beer. You can use the same logic tocomplete the table below.BeerSnacks0816243240b.If you consume 1 more beer you will have 150 fewer calories for snacks. Since a snack has 75calories, consuming one more beer means that you will have to give up 150 / 75 = 2snacks. Theopportunity cost of a beer is therefore 2 snacks.5.Suppose you are ready to check out and see two lines: Line A has 3 people, while line B has 5 people.a.Assume people just chose lines at random and have not yet had a chance to switch lines. Wouldyou consider this situation to be in equilibrium? Why or why not?b.Assume that all 8 shoppers are optimizing (i.e., they have had a chance to switch), and that thesituation is in equilibrium. What conclusions would you draw?c.Of all 8 shoppers, whose behavior is the most informative?Answer:a.This situation is not in equilibrium. Assuming both lines move at the same speed, it would makesense for the last person in the longer line to switch to the shorter line.b.If the 8 shoppers know what they are doing, then it must be the case that the shorter line movesmore slowly.c.The behavior of the last personin each lineis the most informative. The assumption that theseshoppers areoptimizing allows an outside observer to draw conclusions about the speed of thetwo lines.6.Consider the following three statements:i.You can either stand during a college football game or you can sit. You believe that you willsee the game very well if you stand and others sit but that you will not be able to see at all ifyou sit and others stand. You therefore decide to stand.ii.Your friend tells you that he expects many people to stand at football games.iii.An economist studies photos of many college football games and estimates that 75 percent ofall fans stand and 25 percent sit.Which of these statements deals with optimization, which deals with equilibrium, and which dealswith empiricism? Explain.

Page 8

Solution Manual for Macroeconomics, 2nd Edition - Page 8 preview image

Loading page image...

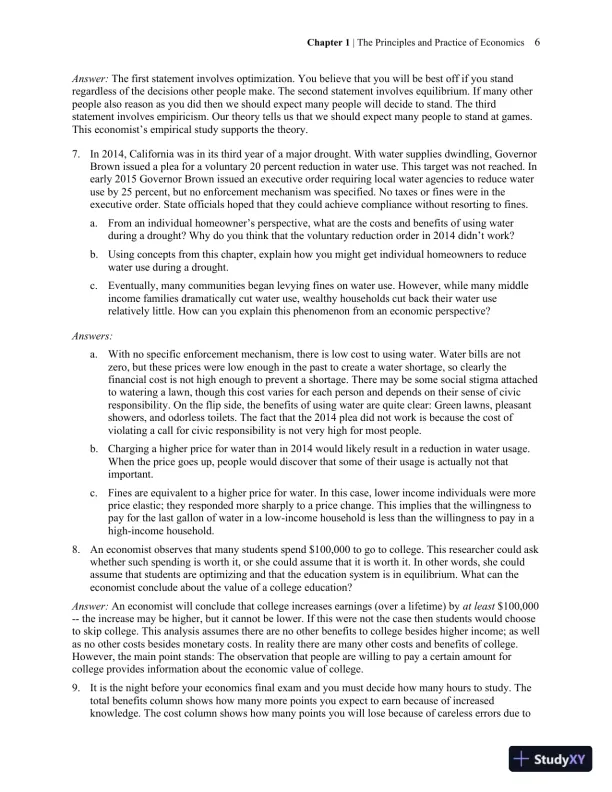
Chapter 1| The Principles and Practice of Economics6Answer:The first statement involves optimization. You believe that you will be best off if you standregardless of the decisions other people make. The secondstatement involves equilibrium. If many otherpeople also reason as you did then we should expect many people will decide to stand. The thirdstatement involves empiricism. Our theory tells us that we should expect many people to stand at games.This economist’s empirical study supports the theory.7.In 2014, California was in its third year of a major drought. With water supplies dwindling, GovernorBrown issued a plea for a voluntary 20 percent reduction in water use. This target was not reached. Inearly 2015 Governor Brown issued an executive order requiring local water agencies to reduce wateruse by 25 percent, but no enforcement mechanism was specified. No taxes or fines were in theexecutive order. State officials hoped that they could achieve compliance without resorting to fines.a.From an individual homeowner’s perspective, what are the costs and benefits of using waterduring a drought? Why do you think that the voluntary reduction order in 2014 didn’t work?b.Using concepts from this chapter, explain how you might get individual homeowners to reducewater use during a drought.c.Eventually, many communities began levying fines on water use. However, while many middleincome families dramatically cut water use, wealthy households cut back their water userelatively little.How can you explain this phenomenon from an economic perspective?Answers:a.With no specific enforcement mechanism, there is low cost to using water. Water bills are notzero, but these prices were low enough in the past to create a water shortage, so clearly thefinancial cost is not high enough to prevent a shortage. There may be some social stigma attachedto watering a lawn, though this cost varies for each person and depends on their sense of civicresponsibility. On the flip side, the benefits of using water are quite clear: Green lawns, pleasantshowers, and odorless toilets. The fact that the 2014 plea did not work is because the cost ofviolating a call for civic responsibility is not very high for most people.b.Charging a higher price for water than in 2014 would likely result in a reduction in water usage.When the price goes up, people would discover that some of their usage is actually not thatimportant.c.Fines are equivalent to a higher price forwater. In this case, lower income individuals were moreprice elastic; they responded more sharply to a price change. This implies that the willingness topay for the last gallon of water in a low-income household is less than the willingness to pay in ahigh-income household.8.An economist observes that many students spend $100,000 to go to college. This researcher could askwhether such spending is worth it, or she could assume that it is worth it. In other words, she couldassume that students are optimizing and that the education system is in equilibrium. What can theeconomist conclude about the value of a college education?Answer:An economist will conclude that college increases earnings (over a lifetime) byat least$100,000--the increase may be higher, but it cannot be lower. If this were not the case then students would chooseto skip college. This analysis assumes there are no other benefits to college besides higher income; as wellas no other costs besides monetary costs. In reality there are many other costs and benefits of college.However, the main point stands: The observation that people are willing to pay a certain amount forcollege provides information about the economic value of college.9.It is the night before your economics final exam and you must decide how many hours to study. Thetotal benefits column shows how many more points you expect to earn because of increasedknowledge. The cost column shows how many points you will lose because of careless errors due to

Page 9

Solution Manual for Macroeconomics, 2nd Edition - Page 9 preview image

Loading page image...

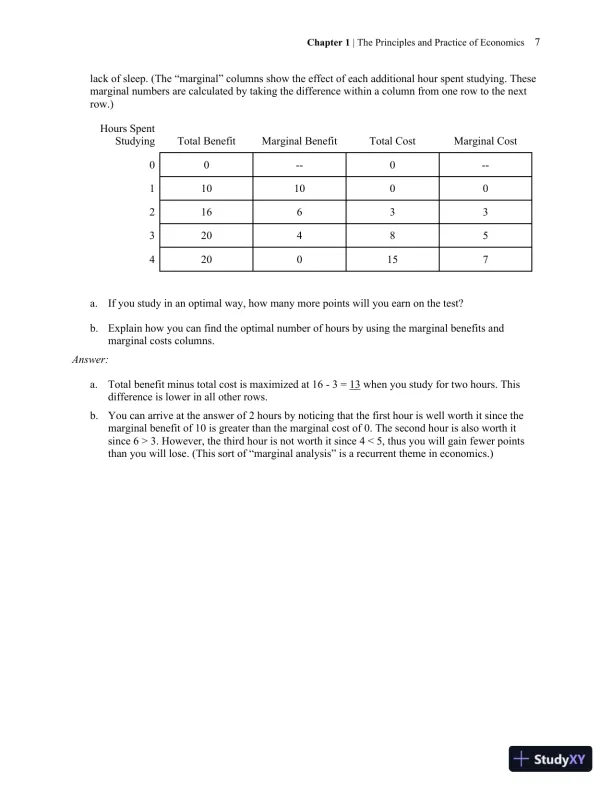
Chapter 1| The Principles and Practice of Economics7lack of sleep. (The “marginal” columns show the effect of each additional hour spent studying. Thesemarginal numbers are calculated by taking the difference within a column from one row to the nextrow.)Hours SpentStudyingTotal BenefitMarginal BenefitTotalCostMarginal Cost00--0--11010002166333204854200157a.If you study in an optimal way, how many more points will you earn on the test?b.Explain how you can find the optimal number of hours by using the marginal benefits andmarginal costs columns.Answer:a.Total benefit minus total cost is maximized at 16-3 =13when you study for two hours. Thisdifference is lower in all other rows.b.You can arriveat the answer of2 hours by noticing that the first hour is well worth it since themarginal benefit of 10 is greater than the marginal cost of 0. The second hour is also worth itsince 6 > 3. However, the third hour is not worth it since 4 < 5, thus you will gainfewer pointsthanyou will lose. (This sort of “marginal analysis” is a recurrent theme in economics.)

Page 10

Solution Manual for Macroeconomics, 2nd Edition - Page 10 preview image

Loading page image...

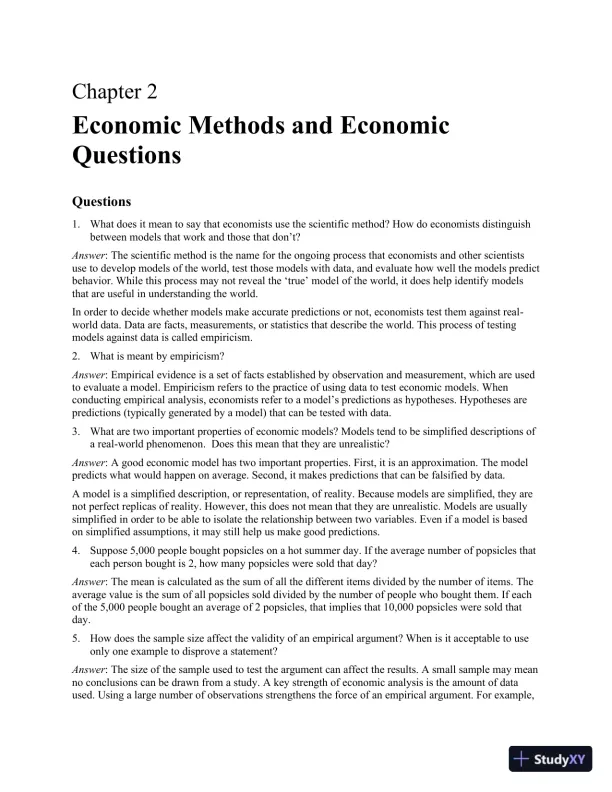
Chapter 2Economic Methods and EconomicQuestionsQuestions1.What does it mean to say that economists use the scientific method? How do economists distinguishbetween models that work and those that don’t?Answer: The scientific method is the name forthe ongoing process that economists and other scientistsuse to develop models of the world, test those models with data, and evaluate how well the modelspredictbehavior. While this process may not reveal the ‘true’ model of the world, it does help identifymodelsthat are useful in understanding the world.In order to decide whether models make accurate predictions or not, economists test them against real-world data. Data are facts, measurements, or statistics that describe the world. This process of testingmodels against data is called empiricism.2.What is meant by empiricism?Answer: Empirical evidence is a set of facts established by observation and measurement, which are usedto evaluate a model. Empiricism refers to the practice of using data to test economic models. Whenconducting empirical analysis, economists refer to a model’s predictions as hypotheses. Hypotheses arepredictions (typically generated by a model) that can be tested with data.3.What are two important properties of economic models? Models tend to be simplified descriptions ofa real-world phenomenon. Does this mean that they are unrealistic?Answer: A good economic model has two important properties. First, it is an approximation. The modelpredicts what would happen on average. Second, it makes predictions that can befalsified by data.A model is a simplified description, or representation, of reality. Because models are simplified, they arenot perfect replicas of reality. However, this does not mean that they are unrealistic. Models are usuallysimplified in order to be able to isolate the relationship between two variables. Even if a model is basedon simplified assumptions, it may still helpus make good predictions.4.Suppose 5,000 people bought popsicles on a hot summer day. If the average number of popsicles thateach person bought is 2, how many popsicles were sold that day?Answer: The mean is calculated as the sum of all the different items divided by the number of items.Theaverage value is the sum of all popsicles sold divided by the number of people who bought them. If eachof the 5,000 people bought an average of 2 popsicles, that implies that 10,000 popsicles were sold thatday.5.How does the sample size affect the validity of an empirical argument? When is it acceptable to useonly one example to disprove a statement?Answer: The size of the sample used to test the argument can affect the results. A small sample may meanno conclusions can be drawn from a study. A key strength of economic analysis is the amount of dataused. Using a large number of observations strengthens the force of an empirical argument. For example,

Page 11

Solution Manual for Macroeconomics, 2nd Edition - Page 11 preview image

Loading page image...

Chapter 2| Economic Methods and Economic Questions10if you collect information on consumption from 20,000 people as opposed to 20 people, you are likely toget a more representative result. However, a single example can be used to contradict a statement.6.Explain why correlation does not always imply causation. Does causation always implypositivecorrelation? Explain your answer.Answer: Correlation means that there is a relationship between two variables; as one variable changes,another variable changes. Causation occurs when one variable directly affects another through a cause-and-effect relationship. Correlation suggests that there is some kind of connection, but not necessarily acause and an effect. For example, number of storks in a region might be correlated with the number ofbabies born in the region. But this doesn’t mean that storks bring babies.Positive correlation implies that two variables tend to move in the same direction. However, causationneed not only imply positive correlation. For example, sleeping an extra hour per night may improve yourenergy level at work. However, this positive relationship is swamped by the fact that people who sleep aton tend to be low energy; thus hours of sleep and energy will be negatively correlated even though thereis a positive causal link.7.Give an example of a pair of variables that have a positive correlation, a pair of variables that have anegative correlation, and a pair of variables that have zero correlation.Answer: A person’s IQ and his or her telephone number are likely to show zero correlation. The numberof winter coats sold and the average temperature in a region are likely to show a negative correlation. Thequantity of fertilizers used and crop yield (e.g., the number of bushels of wheat grown per acre) are likelyto have a positive correlation.8.What is meant by randomization? How does randomization affect the results of an experiment?Answer: Randomization is the assignment of subjects by chance, rather than by choice, to the effect of atreatment. Assigning participants randomly will ensure that the result of the experiment is not biased.When randomization is employed, correlationdoesimply causation: How else can a positive correlationbe explained? There is no other way (assuming perfect random assignment) except with a causal linkbetween the treatment and the outcome.9.This chapter discussed natural and randomized experiments. How does a natural experiment differfrom a randomized one?Answer: A natural experiment is an empirical study in which some processout of the control of theexperimenterhas assigned subjects to control and test groups in a random or nearly random way. Theprocess of randomization involves the assignment of subjects by chance, rather than by choice, to a testgroup or control group.10.Suppose you had to find the effect of seat belt rules on road accident fatalities. Would you choose torun a randomized experiment or would it make sense to use natural experiments here? Explain.Answer:It would be difficult (and, in many people’s view, unethical) to conduct a randomizedexperiment. Instead, the study should use a natural experiment. You can study data on the causes of roadaccident fatalities in cities where seat belt rules were not enforced, or in cities that have recently adoptednew, more stringent seat belt laws. Controlling for other factors like an increase in the number of cars,etc., you can then look at similar data when seat belt rules have been implemented.Problems1.Although the mean and median are closely related, the difference between the mean and the median issometimes of interest.

Page 12

Solution Manual for Macroeconomics, 2nd Edition - Page 12 preview image

Loading page image...

Chapter 2| Economic Methods and Economic Questions11a.Suppose country A has five families. Their incomes are $10,000, $20,000, $30,000, $40,000, and$50,000. What is the median family income in A? What is the mean income?b.Country B also has five families. Their incomes are $10,000, $20,000, $30,000, $40,000, and$150,000. What is the median family income in B? What is the mean income?c.In which country is income inequality greater, A or B?d.Suppose you thought income inequality in the US had increased over time. Based on youranswers to this question, would you expect that the ratio of the mean income in the US to themedian income has risen or fallen? Explain.Answer:a.We can find the mean by summing the observations and dividing by the number of observations.So the mean income in Country A is ($10,000 + $20,000 + $30,000 + $40,000 + $50,000) / 5 =$30,000. The median income is the income of the family in the middle of the income distribution.The median income in Country A is $30,000. Two families have income below $30,000 and twohave income above $30,000.b.A similar argument shows that the mean income in Country B is ($10,000 + $20,000 + $30,000 +$40,000 + $150,000) / 5 = $50,000. Median income in B is $30,000; as in Country A, twofamilies have income below $30,000 and two have income above $30,000.c.Income inequality is higher in Country B. The highest income family in Country B earns$150,000, 60% of the total income in that country. The highest income family in A earns$50,000, just 33% of total income in A. We found that the median income in the two countrieswas the same but the mean income was very different. Means will be heavily influenced byextreme values such as the incomes of the very wealthy; median income is less sensitive toextremes. Economists sometimes use the ratio of the mean to median income in a country as arough measure of income inequality; higher values of this ratio reflect greater inequality.d.You should expect to find that the ratio of the mean to median income has risen. As we arguedabove, the mean is more sensitive than the median to the incomes of the very wealthy.2.Consider the following situation: your math professor tells your class (of five students) that the meanscore on the final exam is 80 but the median is 100. How is that possible? Explain.Answer: Typically, when the mean is lower than the median there is a skew in the data: The test scoresthat were below the median were way below the median. For example, with only five tests, the medianmay be 100 because three out of five people scored 100. If the lower scorers received scores of 40 and 60then the average (i.e. the mean) will be (40+60+100+100+100)/5 = 80.3.Suppose you come across a study that has discovered a correlation between reading books and lifeexpectancy: People who read more books live longer. Come up with at least one plausible way thatthis correlation exists even though there is no direct causal link.Answer:One possibility is that wealthier individuals can afford to spend more time reading; they also canafford better medical care. Another possibility is that sitting in a quiet place is good for health, andreading just happens to be one way to sit in a quiet place. Also, if you live longer you have more time toread more books (reverse causality), though any reasonable study would account for this effect beforedrawing conclusions.4.Some studies have found that people who owned guns were more likely to be killed with a gun. Doyou think this study is strong evidence in favor of stricter gun control laws? Explain.Answer: Not necessarily. It is quite possible that people who thought they were at risk (perhaps because

Page 13

Solution Manual for Macroeconomics, 2nd Edition - Page 13 preview image

Loading page image...

Chapter 2| Economic Methods and Economic Questions12they live in dangerous neighborhoods) were more likely to buy a gun for self-protection. This is anexample of a case where correlation may not imply causation. There has been a good deal of research onthis question. See, for example, a Harvard School of Public Health 2011 interview with David Hemenway(http://www.hsph.harvard.edu/news/features/review-guns-politics-hemenway).5.As the text explains, it can sometimes be very difficult to sort out the direction of causality.a.Why might you think more police officers would lead to lower crime rates? Why might you thinkthat higher crime rates would lead to more police officers?b.In 2012, theNew England Journal of Medicinepublished research that showed a strongcorrelation between the consumption of chocolate in a country and the number of Nobel Prizewinners in that country. Do you think countries that want to encourage their citizens to win NobelPrizes should increase their consumption of chocolate?c.A recent article in the Journal of Applied Physiology found that elderly runners had healthiermuscles than a comparison group of the same age. Although the members of the comparisongroup were all still living independently, they had lower muscle mass and muscle strength thanthe athletes. The popular press framed the article as proof that exercise causes people to behealthier. Is that the only way to interpret causality in this example?Answer:a.There is a great deal of evidence that increasing the number of police officers in a neighborhoodcan drive down crime. The police, for example, will deter criminals who realize the chances theywill be caught have gone up and the police may be able to head off conflicts between gangs.Therefore more police could lead to less crime. Cities strategically assign more police to highcrime areas (since by definition, those are the areas where crimes are more likely to occur).Therefore, more crime can lead to more police.b.Correlation does not necessarily imply causation. A strong positive correlation between chocolateconsumption and Nobel Prize winners does not, by itself, suggest causation. It is possible that thisis a chance correlation. It may also be case that certain variables that could explain thisrelationship have been omitted from the study.c.Another quite likely story that would generate the same correlation between running and musclemass: Elderly people with enough muscle to go outside for a run are more likely to go outside fora run! It is likely some people who lose muscle mass and respond by not running as much; in fact,this almost surely happens. This argument is not definitive proof that the causal link from runningto muscle mass is false, but the study is also not definitive proof that the causal link is true.See the June 11, 2013 New York Times article “Chicago Tactics Put Major Dent in Killing Trend”(http://www.nytimes.com/2013/06/11/us/chicago-homicides-fall-by-34-percent-so-far-this-year.html?hp) on the relationship between police and crime rates. Seehttp://www.reuters.com/article/2012/10/10/us-eat-chocolate-win-the-nobel-prize-idUSBRE8991MS20121010 on the effects of eating chocolate.6.The chapter shows that as a general rule people with more education earn higher salaries. Economistshave offered two explanations of this relationship. The human capital argument says that high schoolsand colleges teach people valuable skills and employers are willing to pay higher salaries to attractpeople with those skills. The signaling argument says that college graduates earn more because acollege degree is a signal to employers that a job applicant is diligent, intelligent, and persevering.How might you use data on people with 2, 3, and 4 years of college education to shed light on thiscontroversy?

Page 14

Solution Manual for Macroeconomics, 2nd Edition - Page 14 preview image

Loading page image...

Chapter 2| Economic Methods and Economic Questions13Answer: If the human capital explanation is correct, then we might expect to find that people who attendcollege but do not graduate earn salaries that are close to what college graduates earn. Consider theextreme case of people who drop out of college the week before graduation. It is very unlikely that theywould have improved their job skills much in that last week. The human capital school of thought wouldsuggest that they should therefore earn roughly the same salaries as college graduates. On the other hand,the signaling school of thought would argue that these people should earn significantly less than collegegraduates. Employers would interpret their failure to graduate as a signal they are not as diligent orpersevering as people who see their college educations through to the end. There is substantial literatureon what is often called the “sheepskin effect” (college diplomas used to be written on sheepskin; NotreDame continued to use sheepskin until 2012). That literature suggests that human capital and signalingboth contribute to the returns to education that we observe in the data.For recent evidence, see the Michael Greenstone and Adam Looney 2013 Brookings Institution studyIsStarting College and Not Finishing Really That Bad?”(http://www.brookings.edu/blogs/jobs/posts/2013/06/07-return-to-some-college-greenstone-looney). Theyfind that people with some college education but who do not graduate from college earn an average of$8,000 more per year than high school graduates who never attend college.7.You decide to run an experiment. You invite 50 friends to a party. You randomly select 25 friendsand tell them that there will be free food; most of them show up to your party. For the other 25 friendsyou do not mention the free food; none of these friends show up. Based on the correlation in yourdata, you conclude that free food causes people to come to parties. A buddy points out “be careful,correlation does not imply causation.” How should you respond?Answer:Assuming you really did choose the two groups randomly, then thecorrelation does in fact implycausation. If your friend challenges you, ask him “what else could it be?” Given randomization, therelationship is not due to omitted variables, nor is it due to reverse causality. (It is possible that due to asmall sample you just happened to get a spurious correlation, but this is another matter related tostatistical inference, not correlation vs causation.)8.Oregon expanded its Medicaid coverage in 2008. Roughly 90,000 people applied but the state hadfunds to cover only an additional 30,000 people (who were randomly chosen from the total applicantpool of 90,000). How could you use the Oregon experience to estimate the impact of increased accessto health care on health outcomes?Answer: The Oregon experience is a natural experiment. The state chose people randomly from the poolof applicants, and so on average the new Medicaid recipients were very similar to the people who appliedbut were turned down. By tracking the health outcomes of people in these two groups we can study theeffect of better access to health care.See “Medicaid Access Increases Use of Care, Study Finds,” New York Times, May 1, 2013(http://www.nytimes.com/2013/05/02/business/study-finds-health-care-use-rises-with-expanded-medicaid.html?_r=0).9.A simple economic model predicts that a fall in the price of bus tickets means that more people willtake the bus. However, you observe that some people still do not take the bus even after the price of aticket fell.a.Is the model incorrect?b.How would you test this model?Answer:a.The model is not necessarily incorrect. Models are only approximations of real-life behavior.Even very good models make predictions that are often correct. So, on average, more people will

Page 15

Solution Manual for Macroeconomics, 2nd Edition - Page 15 preview image

Loading page image...

Chapter 2| Economic Methods and Economic Questions14take the bus. The model is also likely to have made some assumptions, such as no change in costsof other types of transport, or that people have no specific preferences and cost is the onlydeterminant of the mode of transport used. In reality, some of these assumptions may be violatedwhich could explain why a fall in the price of bus tickets does not induce everyone to take thebus. That does not imply that the model’s conclusion is incorrect. In situations where theassumptions it makes are satisfied, its prediction will often be correct.b.The hypothesis here states that as bus prices fall, the number of passengers who take the bus willincrease. A natural experiment can be used to test this model. You can use data on price changesand changes in revenues earned from tickets to see whether the model is accurate.

Page 16

Solution Manual for Macroeconomics, 2nd Edition - Page 16 preview image

Loading page image...

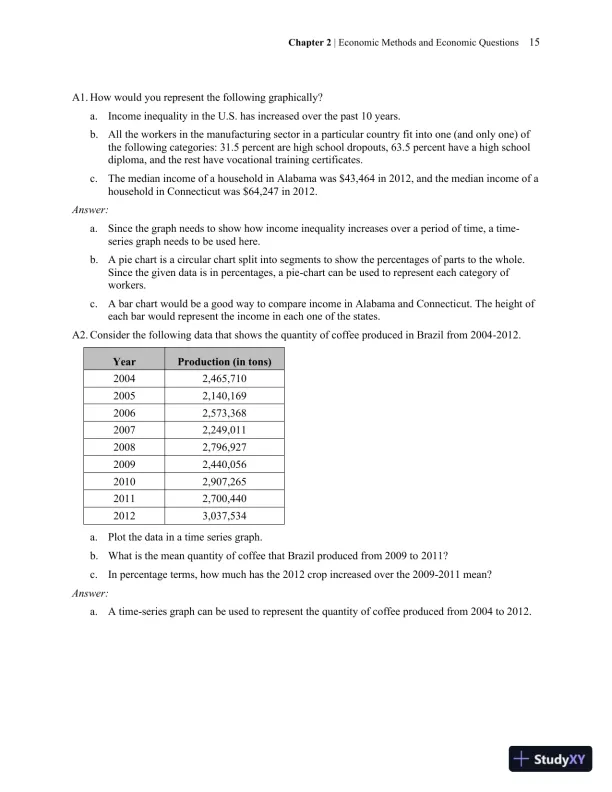
Chapter 2| Economic Methods and Economic Questions15A1.How would you represent the following graphically?a.Income inequality in the U.S. has increased over the past 10 years.b.All the workers in the manufacturing sector in a particular country fit into one (and only one) ofthe following categories: 31.5 percent are high school dropouts, 63.5 percent have a high schooldiploma, and the rest have vocational training certificates.c.The median income of a household in Alabama was $43,464 in 2012, and the median income of ahousehold in Connecticut was $64,247 in 2012.Answer:a.Since the graph needs to show how income inequality increases over a period of time, a time-series graph needs to be used here.b.A pie chart is a circular chart split into segments to show the percentages of parts to the whole.Since the given data is in percentages, a pie-chart can be used to represent each category ofworkers.c.A bar chart would be a good way to compare income in Alabama and Connecticut. The height ofeach bar would represent the income in each one of the states.A2.Consider the following data that shows the quantity of coffee produced in Brazil from 2004-2012.YearProduction (in tons)20042,465,71020052,140,16920062,573,36820072,249,01120082,796,92720092,440,05620102,907,26520112,700,44020123,037,534a.Plot the data in a time series graph.b.What is the mean quantity of coffee that Brazil produced from 2009 to 2011?c.In percentage terms, how much has the 2012 crop increased over the 2009-2011 mean?Answer:a.A time-series graph can be used to represent the quantity of coffee produced from 2004 to 2012.

Page 17

Solution Manual for Macroeconomics, 2nd Edition - Page 17 preview image

Loading page image...

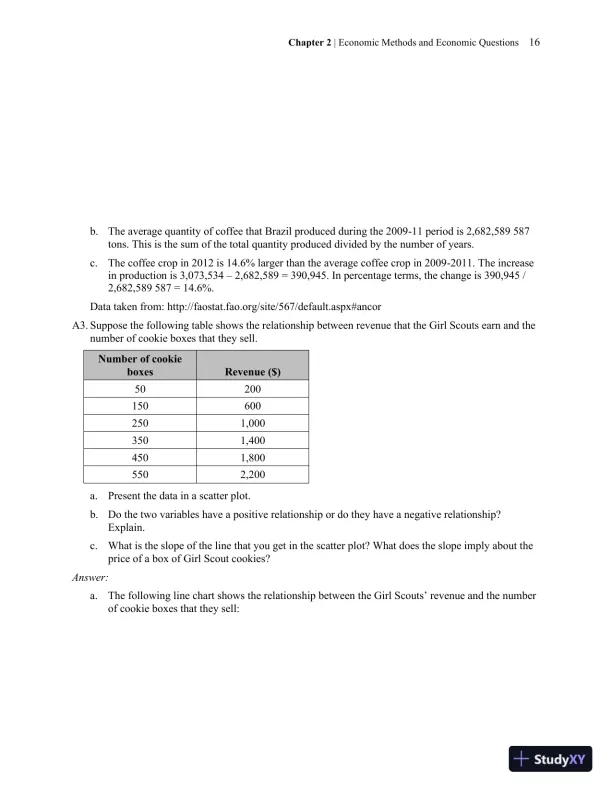
Chapter 2| Economic Methods and Economic Questions16b.The average quantity of coffee that Brazil produced during the 2009-11 period is 2,682,589 587tons. This is the sum of the total quantity produced divided by the number of years.c.The coffee crop in 2012 is 14.6% larger than the average coffee crop in 2009-2011. The increasein production is 3,073,5342,682,589 = 390,945. In percentage terms, the change is 390,945 /2,682,589 587 = 14.6%.Data taken from: http://faostat.fao.org/site/567/default.aspx#ancorA3.Suppose the following table shows the relationship between revenue that the Girl Scouts earn and thenumber of cookie boxes that they sell.Number of cookieboxesRevenue ($)502001506002501,0003501,4004501,8005502,200a.Present the data in a scatter plot.b.Do the two variables have a positive relationship or do they have a negative relationship?Explain.c.What is the slope of the line that you get in the scatter plot? What does the slope imply about theprice of a box of Girl Scout cookies?Answer:a.The following line chart shows the relationship between the Girl Scouts’ revenue and the numberof cookie boxes that they sell:

Page 18

Solution Manual for Macroeconomics, 2nd Edition - Page 18 preview image

Loading page image...

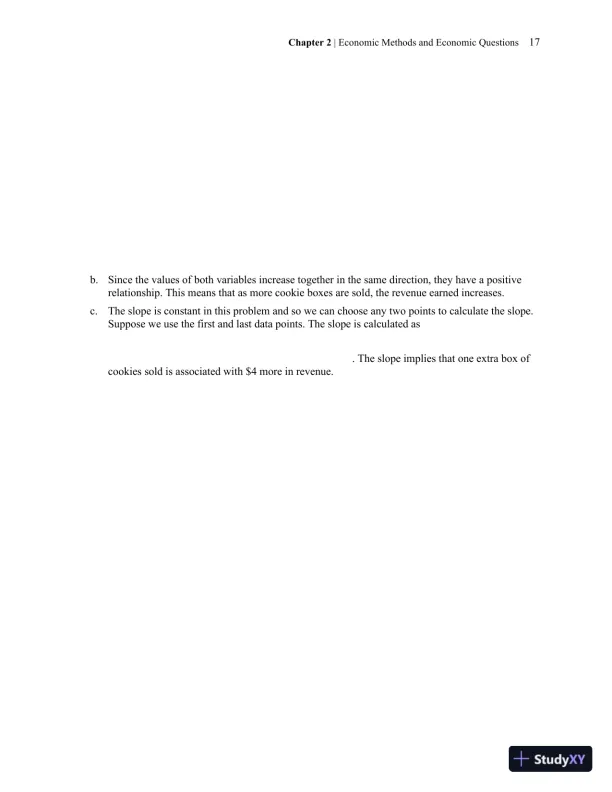
Chapter 2| Economic Methods and Economic Questions17b.Since the values of both variables increase together in the same direction, they have a positiverelationship. This means that as more cookie boxes are sold, the revenue earned increases.c.The slope is constant in this problem and so we can choose any two points to calculate the slope.Suppose we use the first and last data points. The slope is calculated as. The slope implies that one extra box ofcookies sold is associated with $4 more in revenue.

Page 19

Solution Manual for Macroeconomics, 2nd Edition - Page 19 preview image

Loading page image...

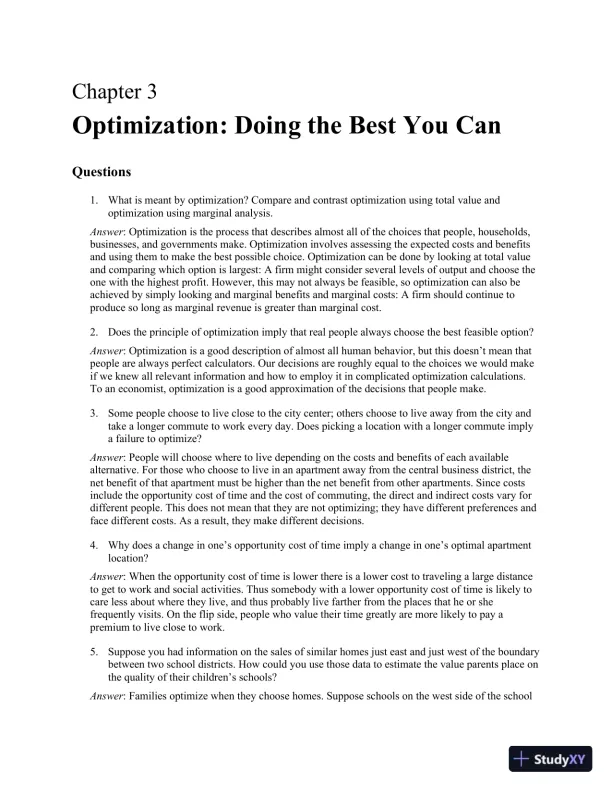
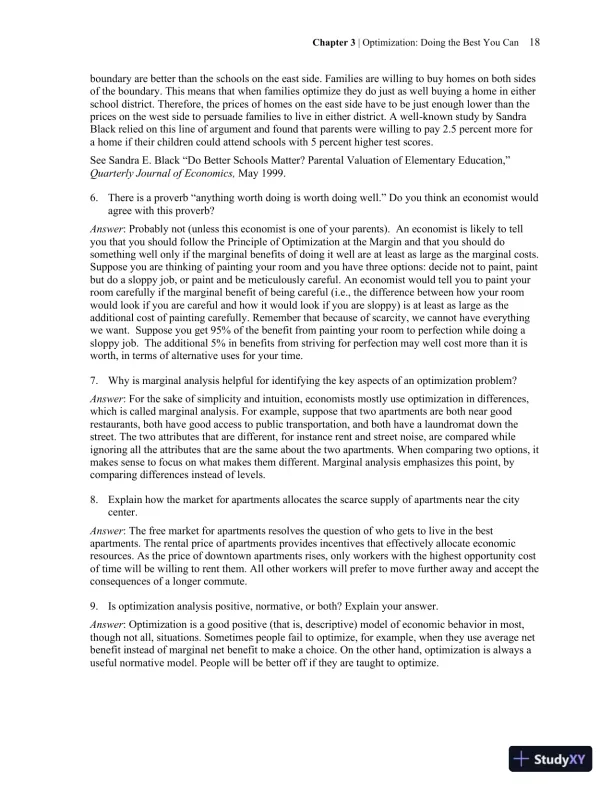
Chapter 3Optimization: Doing the Best You CanQuestions1.What is meant by optimization? Compare and contrast optimization using total value andoptimization using marginal analysis.Answer: Optimization is the process that describes almost all of the choices that people, households,businesses, and governments make. Optimization involvesassessing the expected costs and benefitsand using them to makethe best possible choice. Optimization can be done by looking at total valueand comparing which option is largest: A firm might consider several levels of output and choose theone with the highest profit. However, this may not always be feasible, so optimization can also beachieved by simply looking and marginal benefits andmarginal costs: A firm should continue toproduce so long as marginal revenue is greater than marginal cost.2.Does the principle of optimization imply that real people always choose the best feasible option?Answer: Optimization is a good description of almost all human behavior, but this doesn’t mean thatpeople are always perfect calculators. Our decisions are roughly equal to the choices we would makeif weknew all relevant information and how to employ it in complicated optimization calculations.To an economist, optimization is a good approximation of the decisions that people make.3.Some people choose to live close to the city center; others choose to live away from the city andtake a longer commute to work every day. Does picking a location with a longer commute implya failure to optimize?Answer: People will choose where to live depending on the costs and benefits of each availablealternative. For those who choose to live in an apartment away from the central business district, thenet benefit of that apartment must be higher than the net benefit from other apartments. Since costsinclude the opportunity cost of time and the cost of commuting, the direct and indirect costs vary fordifferent people. This does not mean that they are not optimizing; they have different preferences andface different costs. As a result, they make different decisions.4.Why does a change in one’s opportunity cost of time imply a change in one’s optimal apartmentlocation?Answer: When the opportunity cost of time is lower there is a lower cost to traveling a large distanceto get to work and social activities. Thus somebody with a lower opportunity cost of time is likely tocare less about where they live, and thus probably live farther from the places that he or shefrequently visits. On the flip side, people who value their time greatly are more likely to pay apremium to live close to work.5.Suppose you had information on the sales of similar homes just east and just west of the boundarybetween two school districts. How could you use those data to estimate the value parents place onthe quality of their children’s schools?Answer: Families optimize when they choose homes. Suppose schools on the west side of the school

Page 20

Solution Manual for Macroeconomics, 2nd Edition - Page 20 preview image

Loading page image...

Chapter 3| Optimization: Doing the Best You Can18boundary are better than the schools on the east side. Families are willing to buy homes on both sidesof the boundary. This means that when families optimize they do just as well buying a home in eitherschool district. Therefore, the prices of homes on the east side have to be just enough lower than theprices on the west side to persuade families to live in either district. A well-known study by SandraBlack relied on this line of argument and found that parents were willing to pay 2.5 percent more fora home if their children could attend schools with 5 percent higher test scores.See Sandra E. Black “Do Better Schools Matter? Parental Valuation of Elementary Education,”Quarterly Journal of Economics,May 1999.6.There is a proverb “anything worth doing is worth doing well.” Do you think an economist wouldagree with this proverb?Answer: Probably not (unless this economist is one of your parents). An economist is likely to tellyou that you should follow the Principle of Optimization at the Margin and that you should dosomething well only if the marginal benefits of doing it well are at least as large as the marginal costs.Suppose you are thinking of painting your room and you have three options: decide not to paint, paintbut do a sloppy job, or paint and be meticulously careful. An economist would tell you to paint yourroom carefully if the marginal benefit of being careful (i.e., the difference between how your roomwould look if you are careful and how it would look if you are sloppy) is at least as large as theadditional cost of painting carefully. Remember that because of scarcity, we cannot have everythingwe want. Suppose you get 95% of the benefit from painting your room to perfection while doing asloppy job. The additional 5% in benefits from striving for perfection may well cost more than it isworth, in terms of alternative uses for your time.7.Why is marginal analysis helpful for identifying the key aspects of an optimization problem?Answer: For the sake of simplicity and intuition, economists mostly use optimization in differences,which is called marginal analysis. For example, suppose that two apartments are both near goodrestaurants, both have good access to public transportation, and both have a laundromat down thestreet. The two attributes that are different, for instance rent and street noise, are compared whileignoring all the attributes that are the same about the two apartments. When comparing two options, itmakes sense to focus on what makes them different. Marginal analysis emphasizes this point, bycomparing differences instead of levels.8.Explain how the market for apartments allocates the scarce supply of apartments near the citycenter.Answer: The free market for apartments resolves the question of who gets to live in the bestapartments. The rental price of apartments provides incentives that effectively allocate economicresources. As the price of downtown apartments rises, only workers with the highest opportunity costof time will be willing to rent them. All other workers will prefer to move further away and accept theconsequences of a longer commute.9.Is optimization analysis positive, normative, or both? Explain your answer.Answer: Optimization is a good positive (that is, descriptive) model of economic behavior in most,though not all, situations. Sometimes people fail to optimize, for example, when they use average netbenefit instead of marginal net benefit to make a choice. On the other hand, optimization is always auseful normative model. People will be better off if they are taught to optimize.

Page 21

Solution Manual for Macroeconomics, 2nd Edition - Page 21 preview image

Loading page image...

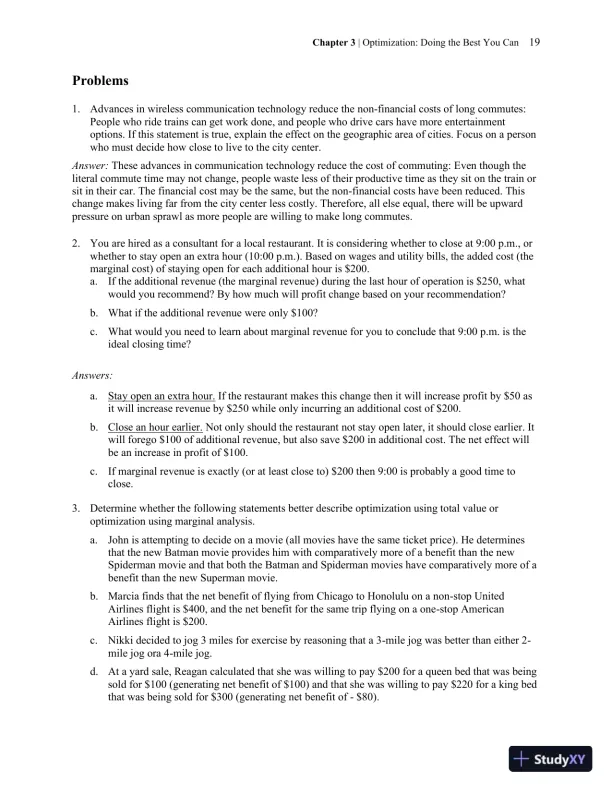
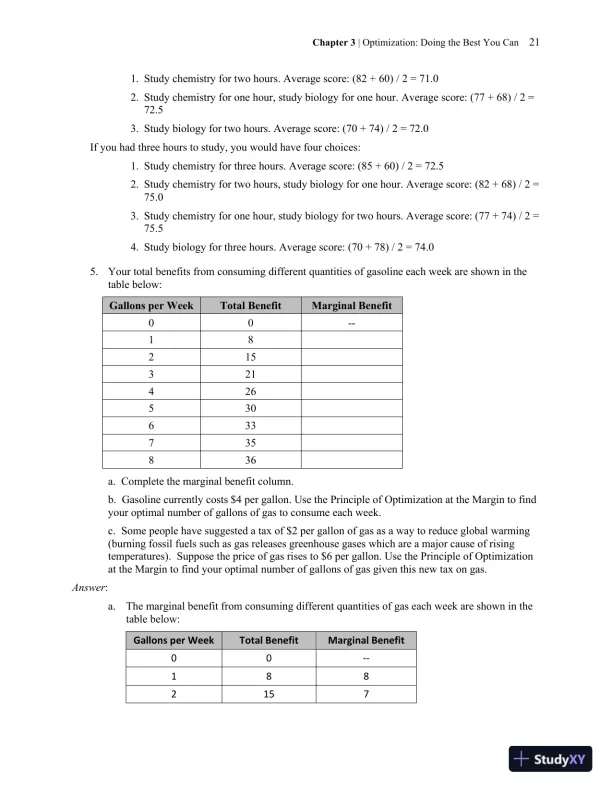
Chapter 3| Optimization: Doing the Best You Can19Problems1.Advances in wireless communication technology reduce the non-financial costs of long commutes:People who ride trains can get work done, and people who drive cars have more entertainmentoptions. If this statement is true, explain the effect on the geographic area of cities. Focus on a personwho must decide how close to live to the city center.Answer:These advances in communication technology reduce the cost of commuting: Even though theliteral commute time may not change, people waste less of their productive time as they sit on the train orsit in their car. The financial cost may be the same, but the non-financial costs have been reduced. Thischange makes living far from the city center less costly. Therefore, all else equal, there will be upwardpressure on urban sprawl as more people are willing to make long commutes.2.You are hired as a consultant for a local restaurant. It is considering whether to close at 9:00 p.m., orwhether to stay open an extra hour (10:00 p.m.). Based on wages and utility bills, the added cost (themarginal cost) of staying open for each additional hour is $200.a.If the additional revenue (the marginal revenue) during the last hour of operation is $250, whatwould you recommend? By how much will profit change based on your recommendation?b.What if the additional revenue were only $100?c.What would you need to learn about marginal revenue for you to conclude that 9:00 p.m. is theideal closing time?Answers:a.Stay open an extra hour. If the restaurant makes this change then it will increase profit by $50 asit will increase revenue by $250 while only incurring an additional cost of $200.b.Close an hour earlier. Not only should the restaurant not stay open later, it should close earlier. Itwill forego $100 of additional revenue, but also save $200 in additional cost. The net effect willbe an increase in profit of $100.c.If marginal revenue is exactly (or at least close to) $200 then 9:00 is probably a good time toclose.3.Determine whether the following statements better describe optimization using total value oroptimization using marginal analysis.a.John is attempting to decide on a movie (all movies have the same ticket price). He determinesthat the new Batman movie provides him with comparatively more of a benefit than the newSpiderman movie and that both the Batman and Spiderman movies have comparatively more of abenefit than the new Superman movie.b.Marcia finds that the net benefit of flying from Chicago to Honolulu on a non-stop UnitedAirlines flight is $400, and the net benefit for the same trip flying on a one-stop AmericanAirlines flight is $200.c.Nikki decided to jog 3 miles for exercise by reasoning that a 3-mile jog was better than either 2-mile jog ora 4-mile jog.d.At a yard sale, Reagan calculated that she was willing to pay $200 for a queen bed that was beingsold for $100 (generating net benefit of $100) and that she was willing to pay $220 for a king bedthat was being sold for $300 (generating net benefit of - $80).

Page 22

Solution Manual for Macroeconomics, 2nd Edition - Page 22 preview image

Loading page image...

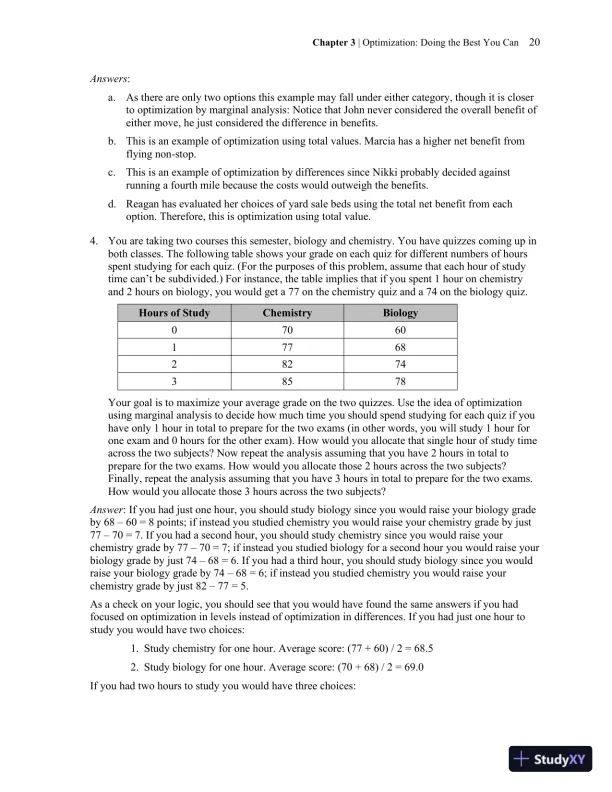
Chapter 3| Optimization: Doing the Best You Can20Answers:a.As there are only two options this example may fall under either category, though it is closerto optimization by marginal analysis: Notice that John never considered the overall benefit ofeither move, he just considered the difference in benefits.b.This is an example of optimization using total values. Marcia has a higher net benefit fromflying non-stop.c.This is an example of optimization by differences since Nikki probably decided againstrunning a fourth mile because the costs would outweigh the benefits.d.Reagan has evaluated her choices of yard sale beds using the total net benefit from eachoption. Therefore, this is optimization using total value.4.You are taking two courses this semester, biology and chemistry. You have quizzes coming up inboth classes. The following table shows your grade on each quiz for different numbers of hoursspent studying for each quiz. (For the purposes of this problem, assume that each hour of studytime can’t be subdivided.) For instance, the table implies that if you spent 1 hour on chemistryand 2 hours on biology, you would get a 77 on the chemistry quiz and a 74 on the biology quiz.Hours of StudyChemistryBiology07060177682827438578Your goal is to maximize your average grade on the two quizzes. Use the idea of optimizationusing marginal analysis to decide how much time you should spend studying for each quiz if youhave only 1 hour in total to prepare for the two exams (in other words, you will study 1 hour forone exam and 0 hours for the other exam). How would you allocate that single hour of study timeacross the two subjects? Now repeat the analysis assuming that you have 2 hours in total toprepare for the two exams. How would you allocate those 2 hours across the two subjects?Finally, repeat the analysis assuming that you have 3 hours in total to prepare for the two exams.How would you allocate those 3 hours across the two subjects?Answer: If you had just one hour, you should study biology since you would raise your biology gradeby 6860 = 8 points; if instead you studied chemistry you would raise your chemistry grade by just7770 = 7. If you had a second hour, you should study chemistry since you would raise yourchemistry grade by 7770 = 7; if instead you studied biology for a second hour you would raise yourbiology grade by just 7468 = 6. If you had a third hour, you should study biology since you wouldraise your biology grade by 7468 = 6; if instead you studied chemistry you would raise yourchemistry grade by just 8277 = 5.As a check on your logic, you should see that you would have found the same answers if you hadfocused on optimization in levels instead of optimization in differences. If you had just one hour tostudy you would have two choices:1.Study chemistry for one hour. Average score: (77 + 60) / 2 = 68.52.Study biology for one hour. Average score: (70 + 68) / 2 = 69.0If you had two hours to study you would have three choices:

Page 23

Solution Manual for Macroeconomics, 2nd Edition - Page 23 preview image

Loading page image...

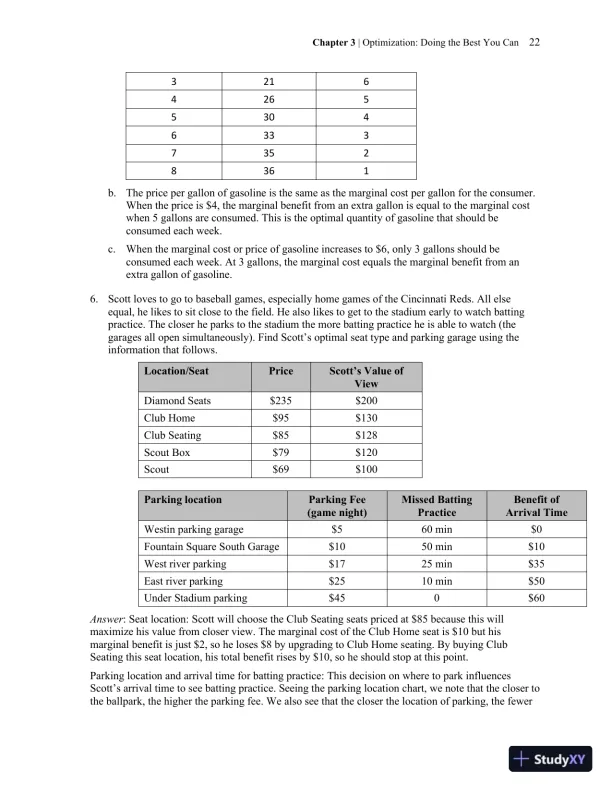
Chapter 3| Optimization: Doing the Best You Can211.Study chemistry for two hours. Average score: (82 + 60) / 2 = 71.02.Study chemistry for one hour, study biology for one hour. Average score: (77 + 68) / 2 =72.53.Study biology for two hours. Average score: (70 + 74) / 2 = 72.0If you had three hours to study, you would have four choices:1.Study chemistry for three hours. Average score: (85 + 60) / 2 = 72.52.Study chemistry for two hours, study biology for one hour. Average score: (82 + 68) / 2 =75.03.Study chemistry for one hour, study biology for two hours. Average score: (77 + 74) / 2 =75.54.Study biology for three hours. Average score: (70 + 78) / 2 = 74.05.Your total benefits from consuming different quantities of gasoline each week are shown in thetable below:Gallons per WeekTotal BenefitMarginal Benefit00--18215321426530633735836a. Complete the marginal benefit column.b. Gasoline currently costs $4 per gallon. Use the Principle of Optimization at the Margin to findyour optimal number of gallons of gas to consume each week.c. Some people have suggested a tax of $2 per gallon of gas as a way to reduce global warming(burning fossil fuels such as gas releases greenhouse gases which are a major cause of risingtemperatures). Suppose the price of gas rises to $6 per gallon. Use the Principle of Optimizationat the Margin to find your optimal number of gallons of gas given this new tax on gas.Answer:a.The marginal benefit from consuming different quantities of gas each week are shown in thetable below:Gallons per WeekTotal BenefitMarginal Benefit00--1882157

Page 24

Solution Manual for Macroeconomics, 2nd Edition - Page 24 preview image

Loading page image...

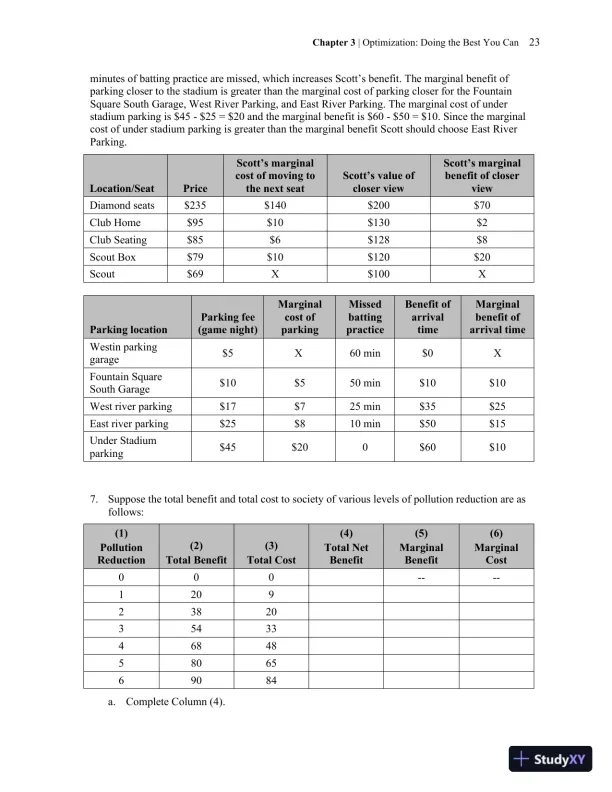
Chapter 3| Optimization: Doing the Best You Can22321642655304633373528361b.The price per gallon of gasoline is the same as the marginal cost per gallon for the consumer.When the price is $4, the marginal benefit from an extra gallon is equal to the marginal costwhen 5 gallons are consumed. This is the optimal quantity of gasoline that should beconsumed each week.c.When the marginal cost or price of gasoline increases to $6, only 3 gallons should beconsumed each week. At 3 gallons, the marginal cost equals the marginal benefit from anextra gallon of gasoline.6.Scott loves to go to baseball games, especially home games of the Cincinnati Reds. All elseequal, he likes to sit close to the field. He also likes to get to the stadium early to watch battingpractice. The closer he parks to the stadium the more batting practice he is able to watch (thegarages all open simultaneously). Find Scott’s optimal seat type and parking garage using theinformation that follows.Location/SeatPriceScott’s Value ofViewDiamond Seats$235$200Club Home$95$130Club Seating$85$128Scout Box$79$120Scout$69$100Parking locationParking Fee(game night)MissedBattingPracticeBenefit ofArrival TimeWestin parking garage$560 min$0Fountain Square South Garage$1050 min$10West river parking$1725 min$35East river parking$2510 min$50Under Stadium parking$450$60Answer: Seat location: Scott will choose the Club Seating seats priced at $85 because this willmaximize his value from closer view. The marginal cost of the Club Home seat is $10 but hismarginal benefit is just $2, so he loses $8 by upgrading to Club Home seating. By buying ClubSeating this seat location, his total benefit rises by $10, so he should stop at this point.Parking location and arrival time for batting practice: This decision on where to park influencesScott’s arrival time to see batting practice. Seeing the parking location chart, we note that the closer tothe ballpark, the higher the parking fee. We also see that the closer the location of parking, the fewer

Page 25

Solution Manual for Macroeconomics, 2nd Edition - Page 25 preview image

Loading page image...

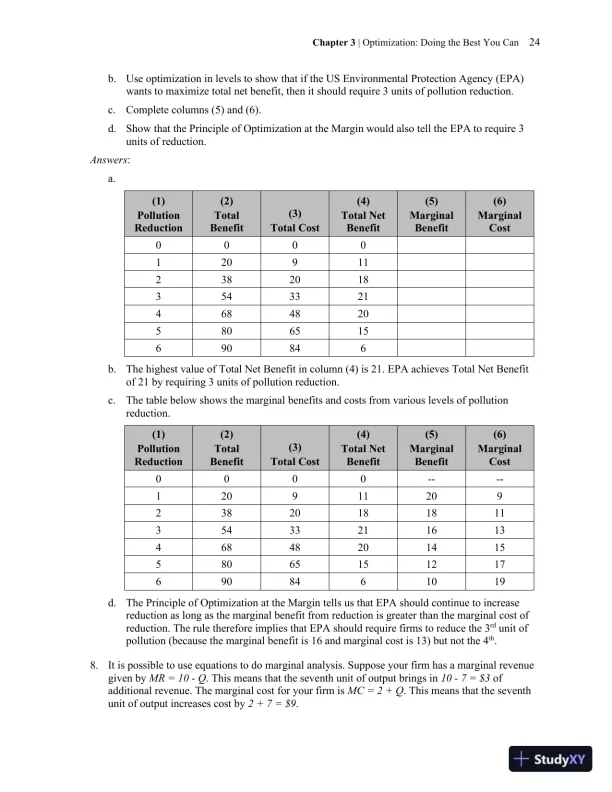
Chapter 3| Optimization: Doing the Best You Can23minutes of batting practice are missed, which increases Scott’s benefit. The marginal benefit ofparking closer to the stadium is greater than the marginal cost of parking closer for the FountainSquare South Garage, West River Parking, and East River Parking. The marginal cost of understadium parking is $45 - $25 = $20 and the marginal benefit is $60 - $50 = $10. Since the marginalcost of under stadium parking is greater than the marginal benefit Scott should choose East RiverParking.Location/SeatPriceScott’s marginalcost of moving tothe next seatScott’s value ofcloser viewScott’s marginalbenefit of closerviewDiamond seats$235$140$200$70Club Home$95$10$130$2Club Seating$85$6$128$8Scout Box$79$10$120$20Scout$69X$100XParking locationParking fee(game night)Marginalcost ofparkingMissedbattingpracticeBenefit ofarrivaltimeMarginalbenefit ofarrival timeWestin parkinggarage$5X60 min$0XFountain SquareSouth Garage$10$550 min$10$10West river parking$17$725 min$35$25East river parking$25$810 min$50$15Under Stadiumparking$45$200$60$107.Suppose the total benefit and total cost to society of various levels of pollution reduction are asfollows:(1)PollutionReduction(2)Total Benefit(3)Total Cost(4)Total NetBenefit(5)MarginalBenefit(6)MarginalCost000----12092382035433468485806569084a.Complete Column (4).

Page 26

Solution Manual for Macroeconomics, 2nd Edition - Page 26 preview image

Loading page image...

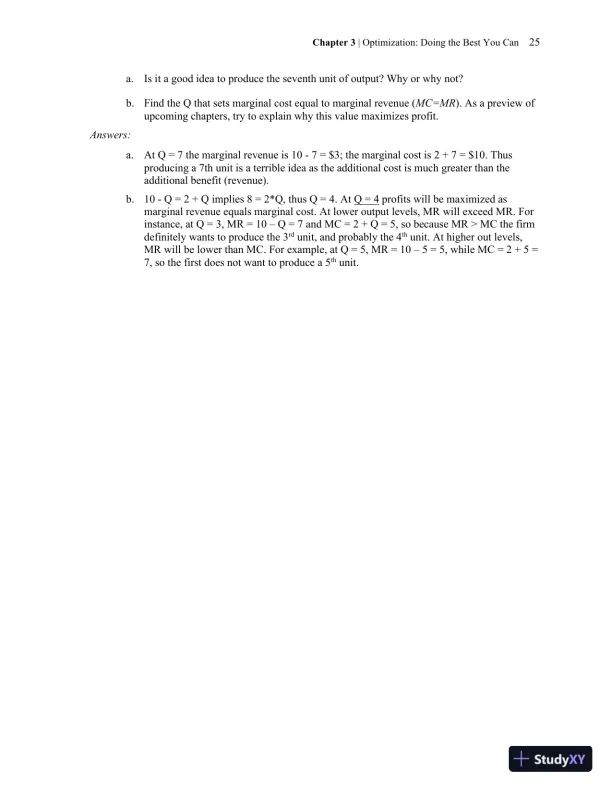
Chapter 3| Optimization: Doing the Best You Can24b.Use optimization in levels to show that if the US Environmental Protection Agency (EPA)wants to maximize total net benefit, then it should require 3 units of pollution reduction.c.Complete columns (5) and (6).d.Show that the Principle of Optimization at the Margin would also tell the EPA to require 3units of reduction.Answers:a.(1)PollutionReduction(2)TotalBenefit(3)Total Cost(4)Total NetBenefit(5)MarginalBenefit(6)MarginalCost00001209112382018354332146848205806515690846b.The highest value of Total Net Benefit in column (4) is 21. EPA achieves Total Net Benefitof 21 by requiring 3 units of pollution reduction.c.The table below shows the marginal benefits and costs from various levels of pollutionreduction.(1)PollutionReduction(2)TotalBenefit(3)Total Cost(4)Total NetBenefit(5)MarginalBenefit(6)MarginalCost0000----120911209238201818113543321161346848201415580651512176908461019d.The Principle of Optimization at the Margintells us that EPA should continue to increasereduction as long as the marginal benefit from reduction is greater than the marginal cost ofreduction. The rule therefore implies that EPA should require firms to reduce the 3rdunit ofpollution (because the marginal benefit is 16 and marginal cost is 13) but not the 4th.8.It is possible to use equations to do marginal analysis. Suppose your firm has a marginal revenuegiven byMR = 10-Q. This means that the seventh unit of output brings in10-7 = $3ofadditional revenue. The marginal cost for your firm isMC = 2+Q. This means that the seventhunit of output increases cost by2+7 = $9.

Page 27

Solution Manual for Macroeconomics, 2nd Edition - Page 27 preview image

Loading page image...

Chapter 3| Optimization: Doing the Best You Can25a.Is it a good idea to produce the seventh unit of output? Why or why not?b.Find the Q that sets marginal cost equal to marginal revenue (MC=MR). As a preview ofupcoming chapters, try to explain why this value maximizes profit.Answers:a.At Q = 7 the marginal revenue is 10 - 7 = $3; the marginal cost is 2 + 7 = $10. Thusproducing a 7th unit is a terrible idea as the additional cost is much greater than theadditional benefit (revenue).b.10 - Q = 2 + Q implies 8 = 2*Q, thus Q = 4. At Q = 4 profits will be maximized asmarginal revenue equals marginal cost. At lower output levels, MR will exceed MR. Forinstance, at Q = 3, MR = 10Q = 7 and MC = 2 + Q = 5, so because MR > MC the firmdefinitely wants to produce the 3rdunit, and probably the 4thunit. At higher out levels,MR will be lower than MC. For example, at Q = 5, MR = 105 = 5, while MC = 2 + 5 =7, so the first does not want to produce a 5thunit.

Page 28

Solution Manual for Macroeconomics, 2nd Edition - Page 28 preview image

Loading page image...

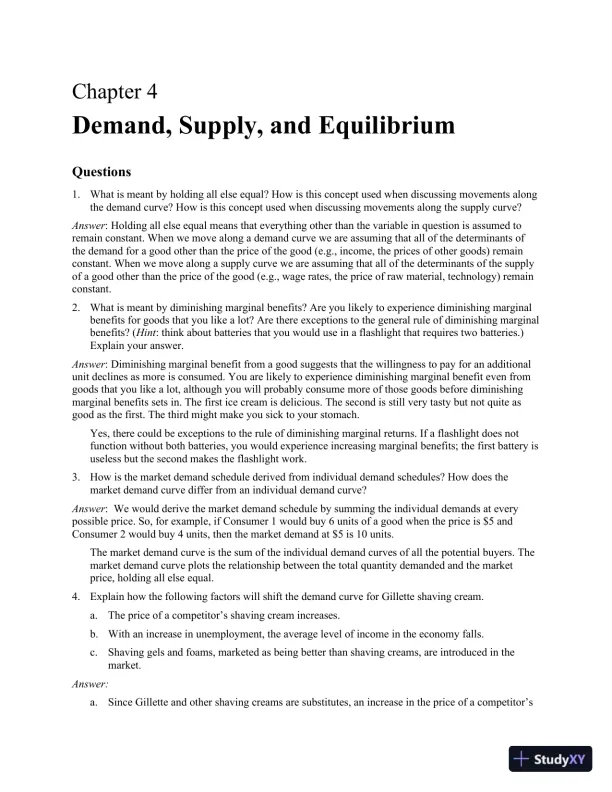
Chapter 4Demand, Supply, and EquilibriumQuestions1.What is meant byholding all else equal? How is this concept used when discussing movements alongthe demand curve? How is this concept used when discussing movements along the supply curve?Answer:Holding all else equal means that everything other than the variable in question is assumed toremain constant. When we move along a demand curve we are assuming that all of the determinants ofthe demand for a good other than the price of the good (e.g., income, the prices of other goods) remainconstant. When we move along a supply curve we are assuming that all of the determinants of the supplyof a good other than the price of the good (e.g., wage rates, the price of raw material, technology) remainconstant.2.What is meant by diminishing marginal benefits? Are you likely to experience diminishing marginalbenefits for goods that you like a lot? Are there exceptions to the general rule of diminishing marginalbenefits? (Hint: think about batteries that you would use in a flashlight that requires two batteries.)Explain your answer.Answer: Diminishing marginal benefit from a good suggests that the willingness to pay for an additionalunit declines as more is consumed. You are likely to experience diminishing marginal benefit even fromgoods that you like a lot, although you will probably consume more of those goods before diminishingmarginal benefits sets in. The first ice cream is delicious. The second is still very tasty but not quite asgood as the first. The third might make you sick to your stomach.Yes, there could be exceptions to the rule of diminishing marginal returns. If a flashlight does notfunction without both batteries, you would experience increasing marginal benefits; the first battery isuseless but the second makes the flashlight work.3.How is the market demand schedule derived from individual demand schedules? How does themarket demand curve differ from an individual demand curve?Answer: We would derive the market demand schedule by summing the individual demands at everypossible price. So, for example, if Consumer 1 would buy 6 units of a good when the price is $5 andConsumer 2 would buy 4 units, then the market demand at $5 is 10 units.The market demand curve is the sum of the individual demand curves of all the potential buyers. Themarket demand curve plots the relationship between the total quantity demanded and the marketprice, holding all else equal.4.Explain how the following factors will shift the demand curve for Gillette shaving cream.a.The price of a competitor’s shaving cream increases.b.With an increase in unemployment, the average level of income in the economy falls.c.Shaving gels and foams, marketed as being better than shaving creams, are introduced in themarket.Answer:a.Since Gillette and other shaving creams are substitutes, an increase in the price of a competitor’s

Page 29

Solution Manual for Macroeconomics, 2nd Edition - Page 29 preview image

Loading page image...

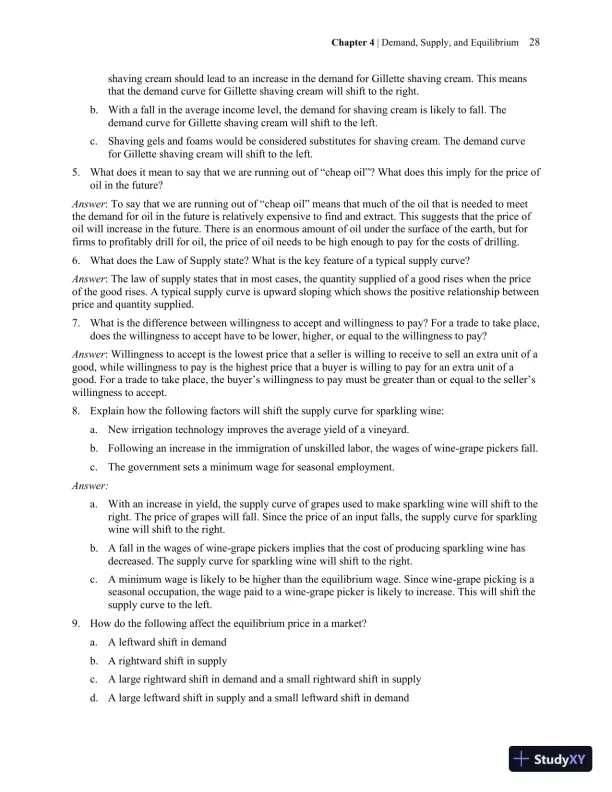
Chapter 4| Demand, Supply, and Equilibrium28shaving cream should lead to an increase in the demand for Gillette shaving cream. This meansthat the demand curve for Gillette shaving cream will shift to the right.b.With a fall in the average income level, the demand for shaving cream is likely to fall. Thedemand curve for Gillette shaving cream will shift to the left.c.Shaving gels and foams would be considered substitutes for shaving cream. The demand curvefor Gillette shaving cream will shift to the left.5.What does it mean to say that we are running out of “cheap oil”? What does this imply for the price ofoil in the future?Answer: To say that we are running out of “cheap oil” means that much of the oil that is needed to meetthe demand for oil in the future is relatively expensive to find and extract. This suggests that the price ofoil will increase in the future. There is an enormous amount of oil under the surface of the earth, but forfirms to profitably drill for oil, the price of oil needs to be high enough to pay for the costs of drilling.6.What does the Law of Supply state? What is the key feature of a typical supply curve?Answer: The law of supply states that in most cases, the quantity supplied of a good rises when the priceof the good rises. A typical supply curve is upward sloping which shows the positive relationship betweenprice and quantity supplied.7.What is the difference between willingness to accept and willingness to pay? For a trade to take place,does the willingness to accept have to be lower, higher, or equal to the willingness to pay?Answer: Willingness to accept is the lowest price that a seller is willing to receive to sell an extra unit of agood, while willingness to pay is the highest price that a buyer is willing to pay for an extra unit of agood. For a trade to take place, the buyer’s willingness to pay must be greater than or equal to the seller’swillingness to accept.8.Explain how the following factors will shift the supply curve for sparkling wine:a.New irrigation technology improves the average yield of a vineyard.b.Following an increase in the immigration of unskilled labor, the wages of wine-grape pickers fall.c.The government sets a minimum wage for seasonal employment.Answer:a.With an increase in yield, the supply curve of grapes used to make sparkling wine will shift to theright. The price of grapes will fall. Since the price of an input falls, the supply curve for sparklingwine will shift to the right.b.A fall in the wages of wine-grape pickers implies that the cost of producing sparkling wine hasdecreased. The supply curve for sparkling wine will shift to the right.c.A minimum wage is likely to be higher than the equilibrium wage. Since wine-grape picking is aseasonal occupation, the wage paid to a wine-grape picker is likely to increase. This will shift thesupply curve to the left.9.How do the following affect the equilibrium price in a market?a.A leftward shift in demandb.A rightward shift in supplyc.A large rightward shift in demand and a small rightward shift in supplyd.A large leftward shift in supply and a small leftward shift in demand

Page 30

Solution Manual for Macroeconomics, 2nd Edition - Page 30 preview image

Loading page image...

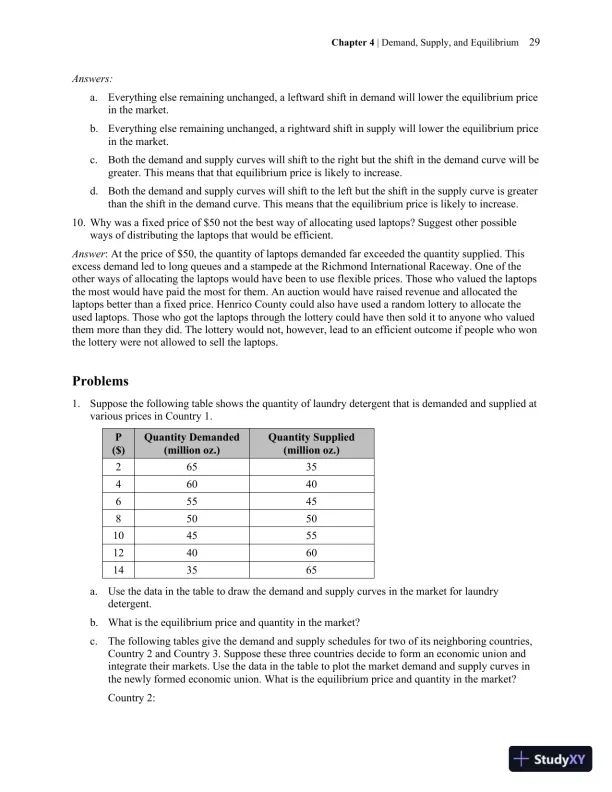
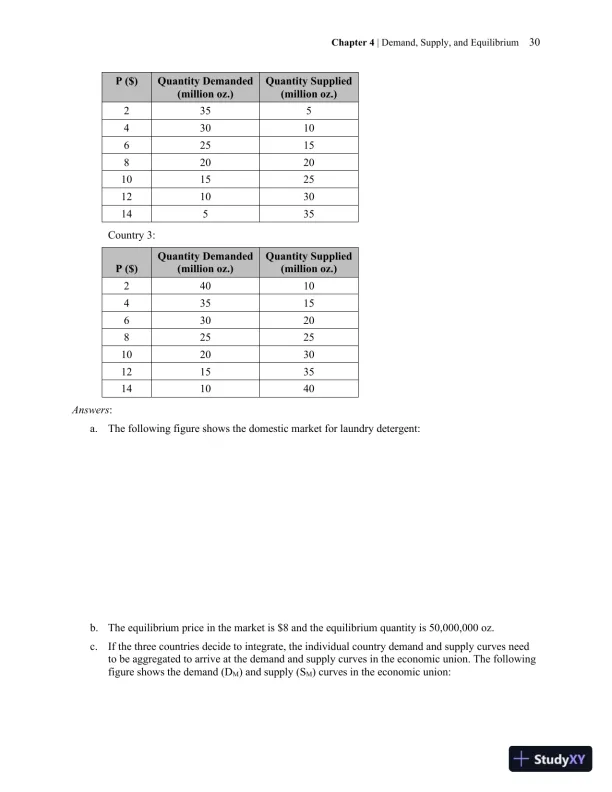
Chapter 4| Demand, Supply, and Equilibrium29Answers:a.Everything else remaining unchanged, a leftward shift in demand will lower the equilibrium pricein the market.b.Everything else remaining unchanged, a rightward shift in supply will lower the equilibrium pricein the market.c.Both the demand and supply curves will shift to the right but the shift in the demand curve will begreater. This means that that equilibrium price is likely to increase.d.Both the demand and supply curves will shift to the left but the shift in the supply curve is greaterthan the shift in the demand curve. This means that the equilibrium price is likely to increase.10.Why was a fixed price of $50 not the best way of allocating used laptops? Suggest other possibleways of distributing the laptops that would be efficient.Answer: At the price of $50, the quantity of laptops demanded far exceeded the quantity supplied. Thisexcess demand led to long queues and a stampede at the Richmond International Raceway. One of theother ways of allocating the laptops would have been to use flexible prices. Those who valued the laptopsthe most would have paid the most for them. An auction would have raised revenue and allocated thelaptops better than a fixed price. Henrico County could also have used a random lottery to allocate theused laptops. Those who got the laptops through the lottery could have then sold it to anyone who valuedthem more than they did. The lottery would not, however, lead to an efficient outcome if people who wonthe lottery were not allowed to sell the laptops.Problems1.Suppose the following table shows the quantity of laundry detergent that is demanded and supplied atvarious prices in Country 1.P($)Quantity Demanded(million oz.)Quantity Supplied(million oz.)26535460406554585050104555124060143565a.Use the data in the table to draw the demand and supply curves in the market for laundrydetergent.b.What is the equilibrium price and quantity in the market?c.The following tables give the demand and supply schedules for two of its neighboring countries,Country 2 and Country 3. Suppose these three countries decide to form an economic union andintegrate their markets. Use the data in the table to plot the market demand and supply curves inthe newly formed economic union. What is the equilibrium price and quantity in the market?Country 2:

Page 31

Solution Manual for Macroeconomics, 2nd Edition - Page 31 preview image

Loading page image...

Chapter 4| Demand, Supply, and Equilibrium30P ($)Quantity Demanded(million oz.)Quantity Supplied(million oz.)235543010625158202010152512103014535Country 3:P ($)Quantity Demanded(million oz.)Quantity Supplied(million oz.)24010435156302082525102030121535141040Answers:a.The following figure shows the domestic market for laundry detergent:b.The equilibrium price in the market is $8 and the equilibrium quantity is 50,000,000 oz.c.If the three countries decide to integrate, the individual country demand and supply curves needto be aggregated to arrive at the demand and supply curves in the economic union. The followingfigure shows the demand (DM) and supply (SM) curves in the economic union:
Preview Mode

This document has 210 pages. Sign in to access the full document!

Study Now!

XY-Copilot AI
Unlimited Access
Secure Payment
Instant Access
24/7 Support
Document Chat

Document Details

Subject
Economics

Related Documents

View all