Page 1
Loading page image...
Page 2

Loading page image...
Page 3
Loading page image...
Page 4
Loading page image...
Page 5
Loading page image...
Page 6
Loading page image...
Page 7
Loading page image...
Page 8
Loading page image...
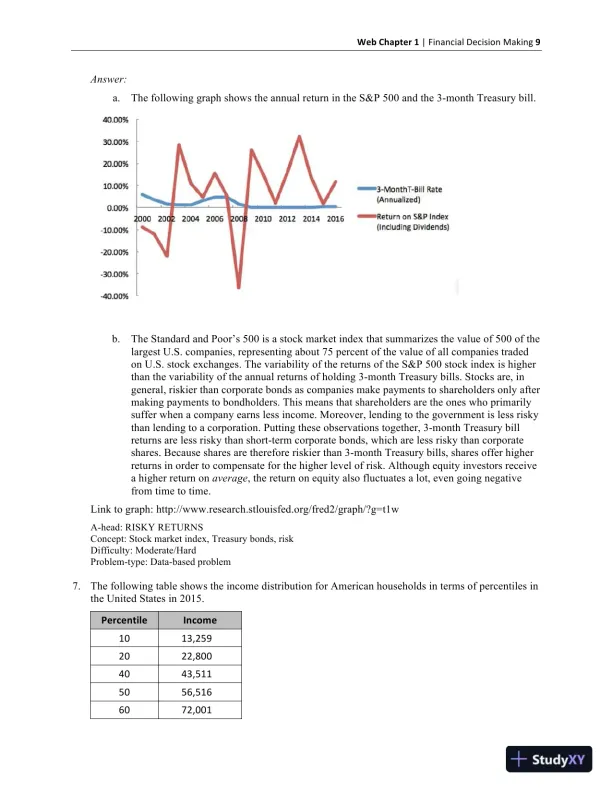
Page 9
Loading page image...
Page 10
Loading page image...
Page 11
Loading page image...
Page 12
Loading page image...
Page 13
Loading page image...