Solution Manual For Macroeconomics Ninth Edition

Ace your coursework with Solution Manual For Macroeconomics Ninth Edition, designed to simplify complex topics.

Victoria Lee
Contributor
4.8
116
9 months ago
Preview (31 of 202 Pages)
100%
Purchase to unlock

Page 1

Solution Manual For Macroeconomics Ninth Edition - Page 1 preview image

Loading page image...

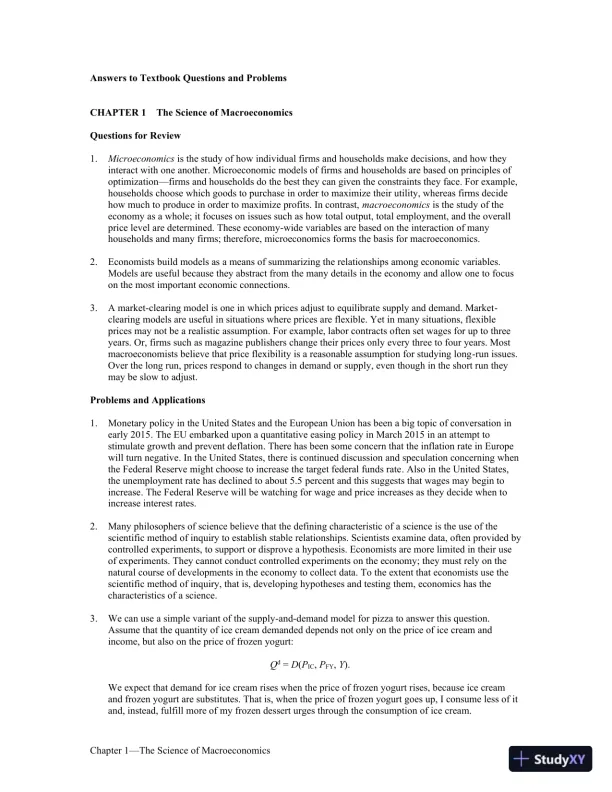
Chapter 1The Science of Macroeconomics1Answers to Textbook Questionsand ProblemsCHAPTER1The Science of MacroeconomicsQuestions for Review1.Microeconomicsis the study of how individual firms and households make decisions, and how theyinteract with one another. Microeconomic models of firms and households are based on principles ofoptimizationfirms and households do the best they can given the constraints they face. For example,households choose which goods to purchase in order to maximize their utility, whereas firms decidehow much to produce in order to maximize profits. In contrast,macroeconomicsis the study of theeconomy as a whole; it focuses on issues such as how total output, total employment, and the overallprice level are determined. These economy-wide variables are based on the interaction of manyhouseholds and many firms; therefore, microeconomics forms the basis for macroeconomics.2.Economists build models as a means of summarizing the relationships among economic variables.Models are useful because they abstract from the many details in the economy and allow one to focuson the most important economic connections.3.A market-clearing model is one in which prices adjust to equilibrate supply and demand. Market-clearing models are useful in situations where prices are flexible. Yet in many situations, flexibleprices may not be a realistic assumption. For example, labor contracts often set wages for up to threeyears. Or, firms such as magazine publishers change their prices only every three to four years. Mostmacroeconomists believe that price flexibility is a reasonable assumption for studying long-run issues.Over the long run, prices respond to changes in demand or supply, even though in the short run theymay be slow to adjust.Problems and Applications1.Monetary policy in the United States and the European Union has been a big topic of conversation inearly 2015.The EU embarked upon a quantitative easing policy in March 2015 in an attempt tostimulate growth and prevent deflation.There has been some concern that the inflation rate in Europewill turn negative.In the United States,there is continued discussion and speculation concerning whenthe Federal Reserve might choose to increase the target federal funds rate.Also in the United States,the unemployment rate has declined to about 5.5percentand this suggests that wages may begin toincrease.The Federal Reserve will be watching for wage and price increases as they decide when toincrease interest rates.2.Many philosophers of science believe that the defining characteristic of a science is the use of thescientific method of inquiry to establish stable relationships. Scientists examine data, often provided bycontrolled experiments, to support or disprove a hypothesis. Economists are more limited in their useof experiments. They cannot conduct controlled experiments on the economy; they must rely on thenatural course of developments in the economy to collect data. To the extent that economists use thescientific method of inquiry, that is, developing hypotheses and testing them, economics has thecharacteristics of a science.3.We can use a simple variant of the supply-and-demand model for pizza to answer this question.Assume that the quantity of ice cream demanded depends not only on the price of ice cream andincome, but also on the price of frozen yogurt:Qd=D(PIC,PFY,Y).We expect that demand for icecream rises when the price of frozen yogurt rises, because ice creamand frozen yogurt are substitutes. That is, when the price of frozen yogurt goes up, I consume less of itand, instead, fulfill more of my frozen dessert urges through the consumption of ice cream.

Page 2

Solution Manual For Macroeconomics Ninth Edition - Page 2 preview image

Loading page image...

Page 3

Solution Manual For Macroeconomics Ninth Edition - Page 3 preview image

Loading page image...

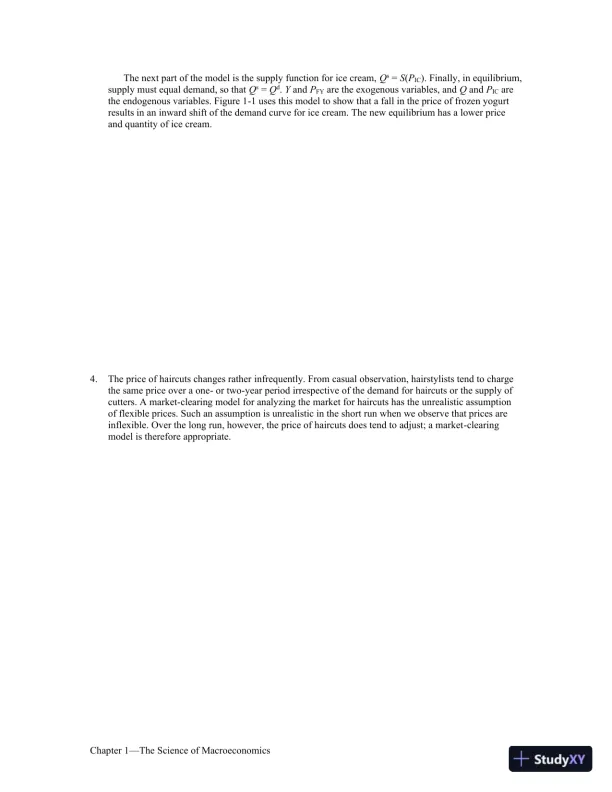
Chapter 1The Science of Macroeconomics2The next part of the model is the supply function for ice cream,Qs=S(PIC). Finally, in equilibrium,supply must equal demand, so thatQs=Qd.YandPFYare the exogenous variables, andQandPICarethe endogenous variables. Figure 1-1 uses this model to show that a fall in the price of frozen yogurtresults in an inward shift of the demand curve for ice cream. The new equilibrium has a lower priceand quantity of ice cream.4.The price of haircuts changes ratherinfrequently. From casual observation, hairstylists tend to chargethe same price over a one-or two-year period irrespective of the demand for haircuts or the supply ofcutters. A market-clearing model for analyzing the market for haircuts has the unrealistic assumptionof flexible prices. Such an assumption is unrealistic in the short run when we observe that prices areinflexible. Over the long run, however, the price of haircuts does tend to adjust; a market-clearingmodel is therefore appropriate.

Page 4

Solution Manual For Macroeconomics Ninth Edition - Page 4 preview image

Loading page image...

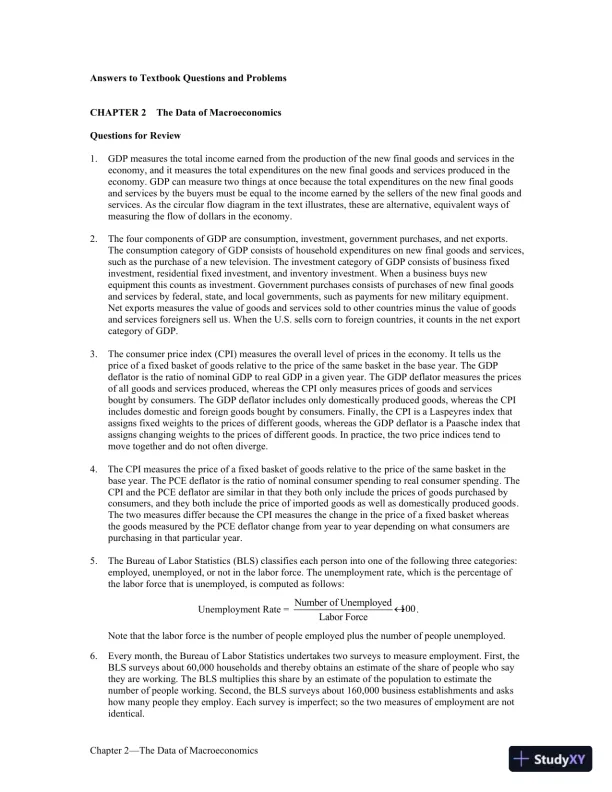
Chapter 2The Data of Macroeconomics3Answers to Textbook Questions and ProblemsCHAPTER2The Data of MacroeconomicsQuestions for Review1.GDP measures the total income earned from the production of the new final goods and services in theeconomy, and it measures the total expenditures on the new final goods and services produced in theeconomy. GDP can measure two things at once because the total expenditures on the new final goodsand services by the buyers must be equal to the income earned by the sellers of the new final goods andservices. As the circular flow diagram in the text illustrates, these are alternative, equivalent ways ofmeasuring the flow of dollars in the economy.2.The four components of GDP areconsumption, investment, government purchases, and net exports.The consumption category of GDP consists of household expenditures on new final goods and services,such asthe purchase of a new television.The investment category of GDP consists of business fixedinvestment, residential fixed investment, and inventory investment.When a business buys newequipment this counts as investment.Government purchases consists of purchases of new final goodsand services by federal, state, and local governments, such as payments for new military equipment.Net exports measures the value of goods and services sold to other countries minus the value of goodsand services foreigners sell us.When the U.S. sells corn to foreign countries,it counts in the net exportcategory of GDP.3.The consumer price index(CPI)measures the overall level of prices in the economy. It tells us theprice of a fixed basket of goods relative to the price of the same basket in the base year. The GDPdeflator is the ratio of nominal GDP to real GDP in a given year. The GDP deflator measures the pricesof all goods and services produced, whereas the CPI only measures prices of goods and servicesbought by consumers. The GDP deflator includes only domestically produced goods, whereas the CPIincludes domestic and foreign goods bought by consumers. Finally, the CPI is a Laspeyres index thatassigns fixed weights to the prices of different goods, whereas the GDP deflator is a Paasche index thatassigns changing weights to the prices of different goods. In practice, the two price indices tend tomove together and do not often diverge.4.The CPI measures the price of a fixed basket of goods relative to theprice of the same basket in thebase year.The PCE deflator is the ratio of nominal consumer spending to real consumer spending.TheCPI and the PCE deflator are similar in that they both only include the prices of goods purchased byconsumers, and they both include the price of imported goods as well as domestically produced goods.The two measures differ because the CPI measures the change in the price of a fixed basket whereasthe goods measured by the PCE deflator change from year to year depending on what consumers arepurchasing in that particular year.5.The Bureau of Labor Statistics(BLS)classifies each person into one of the following three categories:employed, unemployed, or not in the labor force. The unemployment rate, which is the percentage ofthe labor force that is unemployed, is computed as follows:Unemployment Rate =Number of UnemployedLabor Force´100.Note that the labor force is the number of people employed plus the number of people unemployed.6.Every month, the Bureau of Labor Statisticsundertakes two surveys to measure employment. First, theBLS surveys about 60,000 households and thereby obtains an estimate of the share of people who saythey are working. The BLS multiplies this share by an estimate of the population to estimate thenumber of people working. Second, the BLS surveys about 160,000 business establishments and askshow many people they employ. Each survey is imperfect; so the two measures of employment are notidentical.

Page 5

Solution Manual For Macroeconomics Ninth Edition - Page 5 preview image

Loading page image...

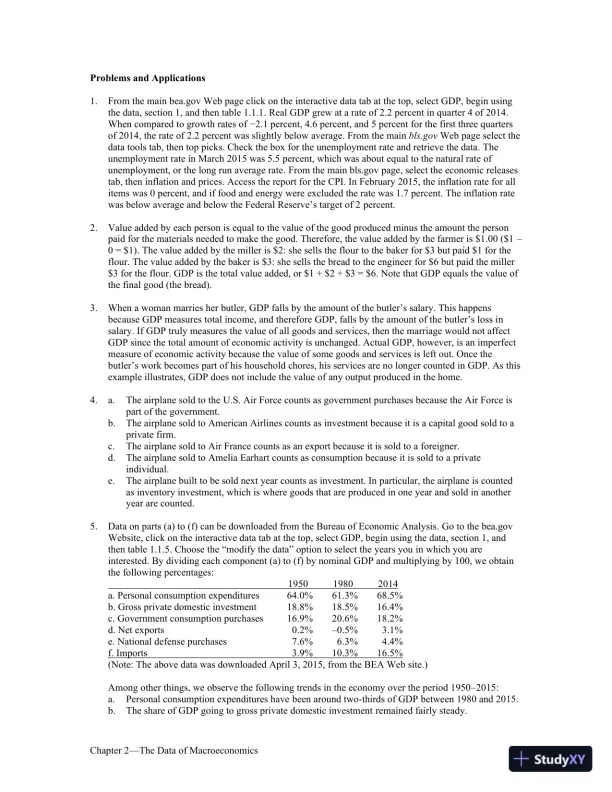
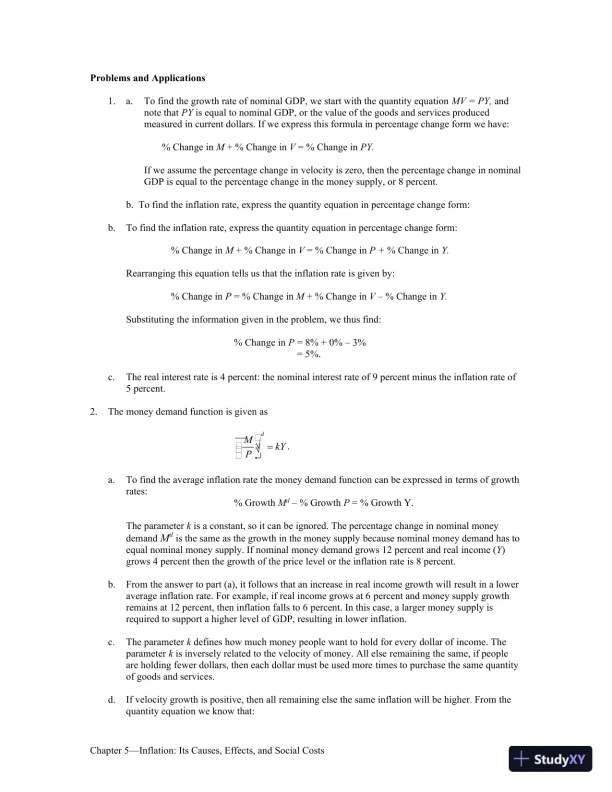
Chapter 2The Data of Macroeconomics4Problems and Applications1.From the main bea.govWebpage click on the interactive data tab at the top, select GDP, begin usingthe data, section 1, and then table 1.1.1.Real GDP grew at a rate of 2.2percentin quarter 4 of 2014.When comparedto growth rates of2.1percent, 4.6percent, and 5percentfor the first three quartersof 2014, the rate of 2.2percentwasslightly below average.From the mainbls.govWebpageselect thedata tools tab, then top picks.Check the box for the unemployment rate and retrieve the data.Theunemployment rate in March2015 was 5.5percent, which wasabout equal to the natural rate ofunemployment, or the long run average rate.From the main bls.gov page, select the economic releasestab, then inflation and prices.Access the report for theCPI.In February 2015, the inflation rate for allitems was 0percent,and if food and energy wereexcluded the rate was 1.7percent.The inflationratewasbelow average and below the Federal Reserve’s target of 2percent.2.Value added by each person isequal tothe value of the good produced minus the amount the personpaid for the materials needed to make the good. Therefore, the value added by the farmer is $1.00 ($10 = $1). The value added by the miller is $2: she sells the flour to the baker for $3 but paid $1 for theflour. The value added by the baker is $3: she sells the bread to the engineer for $6 but paid the miller$3 for the flour. GDP is the total value added, or $1 + $2 + $3 = $6. Note that GDP equals the value ofthe final good (the bread).3.When a woman marries her butler, GDP falls by the amount of the butler’s salary. This happensbecauseGDP measurestotal income, and therefore GDP, falls by the amount of the butler’s loss insalary. If GDP truly measuresthe value of all goods and services, then the marriage would not affectGDP since the total amount of economic activity is unchanged. Actual GDP, however, is an imperfectmeasure of economic activity because the value of some goods and services is left out. Once thebutler’s work becomes part of his household chores, his services are no longer counted in GDP. As thisexample illustrates, GDP does not include the value of any output produced in the home.4.a.The airplane sold to theU.S.Air Force counts as government purchases because the Air Force ispart of the government.b.The airplane sold to American Airlines counts as investment because it is a capital good sold to aprivate firm.c.The airplane sold to Air France counts as an export because it is sold to a foreigner.d.The airplane sold to Amelia Earhart counts as consumption because it is sold to a privateindividual.e.The airplane built to be sold next year counts as investment. In particular, the airplane is countedas inventory investment, which iswhere goods that are produced in one year and sold in anotheryear are counted.5.Data on parts (a) to (f) can be downloaded from the Bureau of Economic Analysis.Go to the bea.govWebsite, click on the interactive data tab at the top, select GDP, begin using the data, section 1, andthen table 1.1.5.Choose themodify the dataoption to select the years youin which you areinterested.By dividing each component (a) to (f) by nominal GDP and multiplying by 100, we obtainthe followingpercentages:195019802014a. Personal consumption expenditures64.0%61.3%68.5%b. Gross private domestic investment18.8%18.5%16.4%c. Government consumption purchases16.9%20.6%18.2%d. Net exports0.2%0.5%3.1%e. National defensepurchases7.6%6.3%4.4%f. Imports3.9%10.3%16.5%(Note: Theabovedata wasdownloadedApril 3, 2015, from the BEA Web site.)Among other things, we observe the following trends in the economy over the period 19502015:a.Personalconsumption expenditures havebeen around two-thirds of GDPbetween 1980 and 2015.b.The share of GDP going to gross private domestic investmentremained fairly steady.

Page 6

Solution Manual For Macroeconomics Ninth Edition - Page 6 preview image

Loading page image...

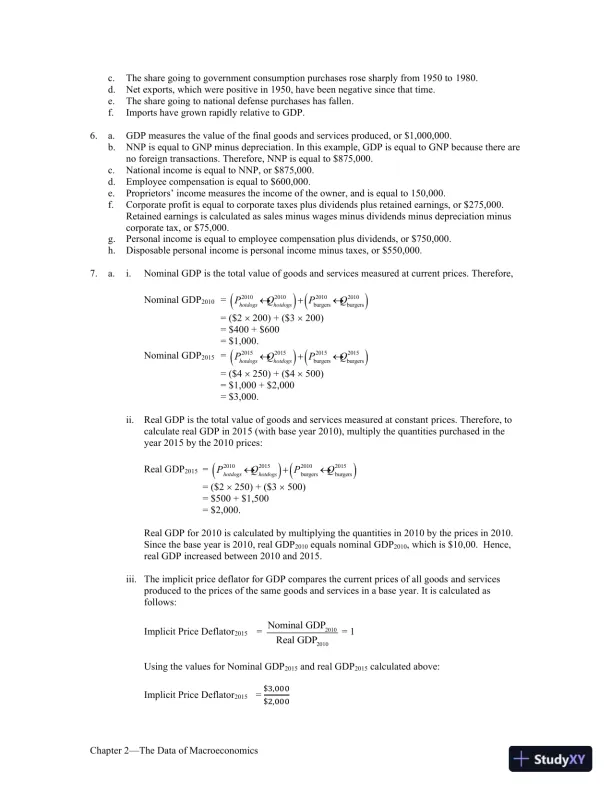
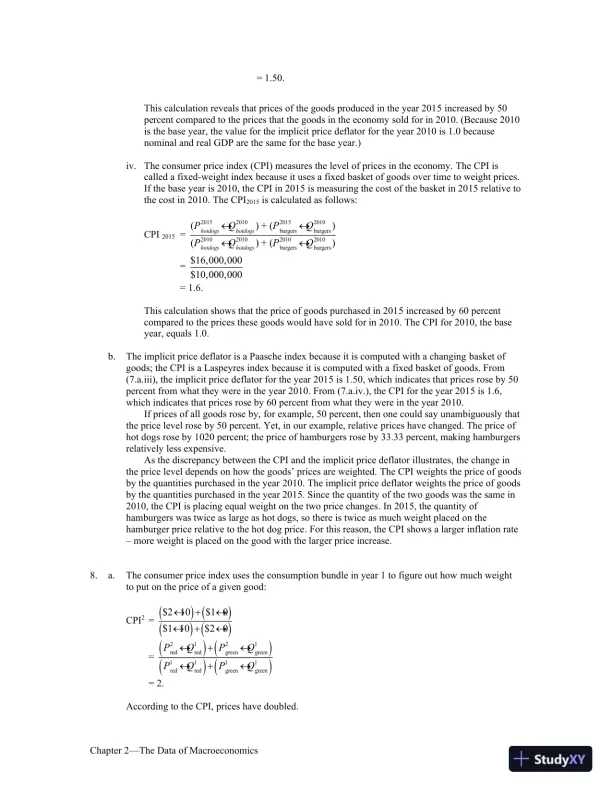
Chapter 2The Data of Macroeconomics5c.The share going to government consumption purchases rose sharply from 1950 to1980.d.Net exports, which were positive in 1950, have been negative since that time.e.The share going to national defense purchases has fallen.f.Imports have grown rapidly relative to GDP.6.a.GDP measures the value of the final goods and services produced, or $1,000,000.b.NNP is equal to GNP minus depreciation.In this example, GDP is equal to GNP because there arenoforeign transactions.Therefore, NNP is equal to $875,000.c.National income is equal to NNP, or $875,000.d.Employee compensation is equal to $600,000.e.Proprietorsincome measures the income ofthe owner,and is equal to150,000.f.Corporate profit is equal to corporate taxes plus dividends plus retained earnings, or $275,000.Retained earnings is calculated as sales minus wages minus dividends minus depreciation minuscorporate tax, or $75,000.g.Personal income is equal to employee compensation plus dividends, or $750,000.h.Disposable personal income is personal incomeminustaxes, or $550,000.7.a.i.Nominal GDP is the total value of goods and services measured at currentprices. Therefore,Nominal GDP2010=Photdogs2010´Qhotdogs2010()+Pburgers2010´Qburgers2010()= ($2200) + ($3200)= $400 + $600= $1,000.Nominal GDP2015=Photdogs2015´Qhotdogs2015()+Pburgers2015´Qburgers2015()= ($4250) + ($4500)= $1,000 + $2,000= $3,000.ii.Real GDP is the total value of goods and services measured at constantprices. Therefore, tocalculate real GDP in 2015(with base year 2010), multiplythequantities purchased in theyear 2015by the 2010 prices:Real GDP2015=P2010hotdogs´Q2015hotdogs()+P2010burgers´Q2015burgers()= ($2250) + ($3500)= $500 + $1,500= $2,000.Real GDP for 2010 is calculated by multiplying the quantities in 2010 by theprices in 2010.Since the base year is 2010, real GDP2010equals nominalGDP2010, which is $10,00.Hence,real GDPincreasedbetween2010 and 2015.iii.The implicit price deflator for GDP compares the current prices of all goodsand servicesproduced to the prices of the same goods and services in a baseyear. It is calculated asfollows:Implicit Price Deflator2015=Nominal GDP2010Real GDP2010= 1Using the values for Nominal GDP2015and real GDP2015calculated above:Implicit Price Deflator2015=$3,000$2,000

Page 7

Solution Manual For Macroeconomics Ninth Edition - Page 7 preview image

Loading page image...

Chapter 2The Data of Macroeconomics6=1.50.This calculation reveals that prices of the goods produced in the year 2015increased by 50percent compared to the prices that the goods in the economysold for in 2010. (Because 2010is the base year, the value for the implicitprice deflator for the year 2010 is 1.0 becausenominal and real GDP are thesame for the base year.)iv.The consumer price index (CPI) measures the level of prices in the economy.The CPI iscalled a fixed-weight index because it uses a fixed basket of goodsover time to weight prices.If the base year is 2010, the CPI in 2015ismeasuring the cost of the basket in 2015 relative tothe cost in 2010. The CPI2015is calculated as follows:CPI2015=(P2015hotdogs´Q2010hotdogs) + (P2015burgers´Q2010burgers)(P2010hotdogs´Q2010hotdogs) + (P2010burgers´Q2010burgers)=$16,000,000$10,000,000=1.6.This calculation shows that the price of goods purchased in 2015increased by 60percentcompared to the prices these goods would have sold for in 2010. The CPIfor 2010, the baseyear, equals 1.0.b.The implicit price deflator is a Paasche index because it is computed with a changingbasket ofgoods; the CPI is a Laspeyres index because it is computed with afixed basket of goods. From(7.a.iii), the implicit price deflator for the year 2015is1.50, which indicates that prices rose by 50percent from what they were in theyear 2010. From (7.a.iv.), the CPI for the year 2015is 1.6,which indicates thatprices rose by 60 percent from what they were in the year 2010.If prices of all goods rose by,for example,50 percent, then one could say unambiguouslythatthe price level rose by 50 percent. Yet, in our example, relativeprices have changed. The price ofhot dogsrose by1020 percent; the price ofhamburgersroseby33.33percent, makinghamburgersrelativelylessexpensive.As the discrepancy between the CPI and the implicit price deflator illustrates,the change inthe pricelevel depends on how the goods’ prices are weighted.The CPI weights the price of goodsby the quantities purchased in the year2010. The implicit price deflator weights the price of goodsby the quantities purchasedin the year 2015.Sincethe quantity of the two goods was the same in2010, the CPI is placing equal weight on the two price changes.In 2015, the quantity ofhamburgers was twice as large as hot dogs, so there is twice as much weight placed on thehamburger price relative to the hot dog price.For this reason, the CPI shows a larger inflation ratemore weight is placed on the good with the larger price increase.8.a.The consumer price index uses the consumption bundle in year 1 to figure out howmuch weightto put on the price of a given good:CPI2=$2´10()+$1´0()$1´10()+$2´0()=P2red´Q1red()+P2green´Q1green()P1red´Q1red()+P1green´Q1green()= 2.According to the CPI, prices have doubled.

Page 8

Solution Manual For Macroeconomics Ninth Edition - Page 8 preview image

Loading page image...

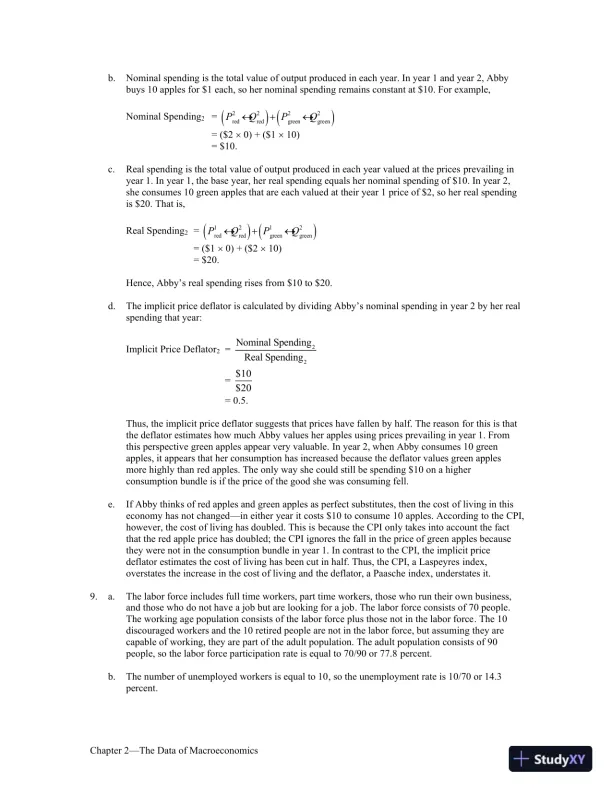
Chapter 2The Data of Macroeconomics7b.Nominal spending is the total value of output produced in each year. In year 1 and year 2, Abbybuys 10 apples for $1each, so her nominal spending remains constant at $10. For example,Nominal Spending2=P2red´Q2red()+P2green´Q2green()= ($20) + ($110)= $10.c.Real spending is the total value of output produced in each year valued at the pricesprevailing inyear 1. In year 1, the base year, her real spending equals her nominal spending of $10. In year 2,she consumes 10 green apples that are each valued at their year 1 price of $2, so her real spendingis $20. That is,Real Spending2=P1red´Q2red()+P1green´Q2green()= ($10) + ($210)= $20.Hence, Abby’s real spending rises from $10 to $20.d.The implicit price deflator is calculated by dividing Abby’s nominal spending inyear 2 by her realspending that year:ImplicitPrice Deflator2=Nominal Spending2Real Spending2=$10$20= 0.5.Thus, the implicit price deflator suggests that prices have fallen by half. The reasonfor this is thatthe deflator estimates how much Abby values her applesusingprices prevailing in year 1. Fromthis perspective green apples appear very valuable.In year 2, when Abby consumes 10 greenapples, it appears that her consumptionhas increased because the deflator values green applesmore highly thanred apples. The only way she could still be spending $10 on a higherconsumptionbundle is if the price of the good she was consuming fell.e.If Abby thinks of red apples and green apples as perfect substitutes, then the costof living in thiseconomy has not changedin either year it costs $10 to consume10 apples. According to the CPI,however, the cost of living has doubled. This isbecause the CPI only takes into account the factthat the red apple price has doubled;the CPI ignores the fall in the price of green apples becausethey were not inthe consumption bundle in year 1. In contrast to the CPI, the implicit pricedeflatorestimates the cost of living has been cut in half. Thus, the CPI, a Laspeyresindex,overstates the increase in the cost of living andthe deflator, a Paascheindex, understates it.9.a.The labor force includes full time workers, part time workers, those who run their own business,and those who do not have a job but are looking for a job.The labor force consistsof 70 people.The working age population consists of the labor force plus those not in the labor force.The 10discouraged workers and the 10 retired people are not in the labor force, but assuming they arecapable of working, they are part of theadult population.The adultpopulation consistsof 90people, so the labor force participation rate is equal to 70/90 or 77.8percent.b.The number of unemployed workers is equal to 10,so the unemployment rate is 10/70 or 14.3percent.

Page 9

Solution Manual For Macroeconomics Ninth Edition - Page 9 preview image

Loading page image...

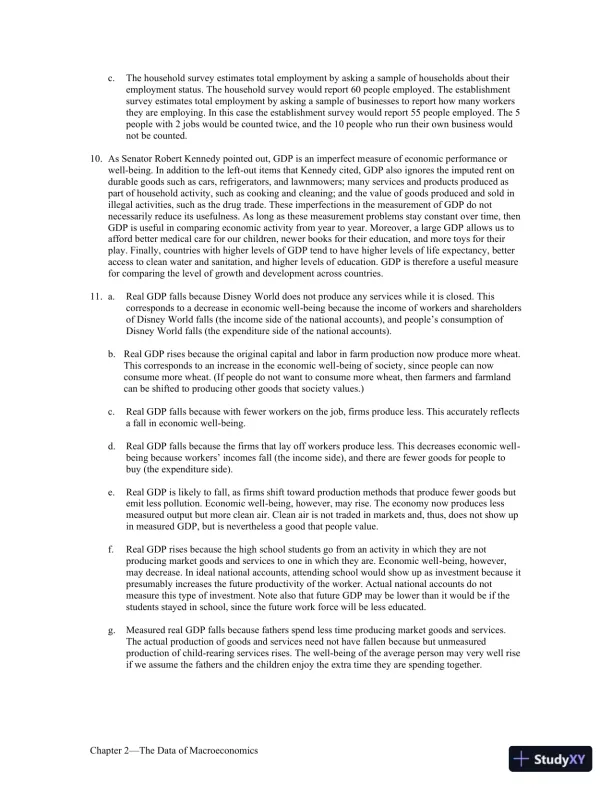
Chapter 2The Data of Macroeconomics8c.The household surveyestimates total employment by asking a sample of households about theiremployment status.The household survey would report 60 people employed.The establishmentsurvey estimates total employment by asking a sample of businesses to report how many workersthey are employing.In this case the establishment survey would report 55 people employed.The 5people with 2 jobs would be counted twice, and the 10 people who run their own business wouldnot be counted.10.As Senator Robert Kennedy pointed out, GDP is an imperfect measure of economic performanceorwell-being. In addition to the left-out items that Kennedy cited, GDP alsoignores the imputed rent ondurable goods such as cars, refrigerators, and lawnmowers;many services and products produced aspart of household activity, such as cooking andcleaning; and the value of goods produced and sold inillegal activities, such as the drugtrade. These imperfections in the measurement of GDP do notnecessarily reduce itsusefulness. As long as these measurement problems stay constant over time, thenGDPis useful in comparing economic activity from year to year. Moreover, a large GDPallows us toafford better medical care for our children, newer books for their education,and more toys for theirplay. Finally, countries with higher levels of GDP tend to havehigher levels of life expectancy, betteraccess to clean water and sanitation, and higherlevels of education. GDP is therefore a useful measurefor comparing the level ofgrowth and development across countries.11.a.Real GDP falls because DisneyWorlddoes not produce any services while it is closed. Thiscorresponds to a decrease in economic well-being because the income of workers and shareholdersof DisneyWorldfalls (the income side of the national accounts), and people’s consumption ofDisneyWorldfalls (the expenditure side of the national accounts).b.Real GDP rises because the original capital and labor in farm production now produce more wheat.This corresponds to an increase in the economic well-being of society, since people can nowconsume more wheat. (If people do not want to consume more wheat, then farmers and farmlandcan be shifted to producing other goods that society values.)c.Real GDP falls because with fewer workers on the job, firms produce less. This accurately reflectsa fall in economic well-being.d.Real GDP falls because the firms that lay off workers produce less. This decreases economic well-being because workers’ incomes fall (the income side), and there are fewer goods for people tobuy (the expenditure side).e.Real GDP is likely to fall, as firms shift toward production methods that produce fewer goods butemit less pollution. Economic well-being, however, may rise. The economy now produces lessmeasured output but more clean air. Clean air is not traded in markets and, thus, does not show upin measured GDP, but is nevertheless a good that people value.f.Real GDP rises because the highschool students go from an activity in which they are notproducing market goods and services to one in which they are. Economic well-being, however,may decrease. In ideal national accounts, attending school would show up as investment because itpresumably increases the future productivity of the worker. Actual national accounts do notmeasure this type of investment. Note also that future GDP may be lower than it would be if thestudents stayed in school, since the future work force will be less educated.g.Measured real GDP falls because fathers spend less time producing market goods and services.The actual production of goods and services need not have fallenbecausebut unmeasuredproduction of child-rearing services rises.The well-being of the average person may very well riseif we assume the fathers and the children enjoy the extra time they are spending together.

Page 10

Solution Manual For Macroeconomics Ninth Edition - Page 10 preview image

Loading page image...

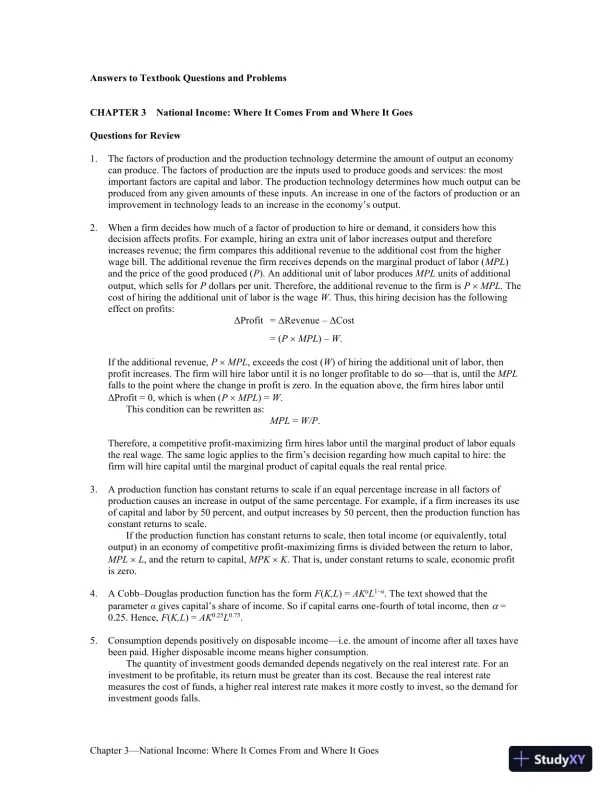
Chapter 3National Income: Where It Comes Fromand Where It Goes9Answers to Textbook Questions and ProblemsCHAPTER3National Income: Where It Comes Fromand Where It GoesQuestions for Review1.The factors of production and the production technology determine the amount of output an economycan produce. Thefactors of production are the inputs used to produce goods and services: the mostimportant factors are capital and labor. The production technology determines how much output can beproduced from any given amounts of these inputs. An increase in one of the factors of production or animprovement in technology leads to an increase in the economy’s output.2.When a firm decides how much of a factor of production to hire or demand, it considers how thisdecision affects profits. For example, hiring an extra unit of labor increases output and thereforeincreases revenue; the firm compares this additional revenue to the additional cost from the higherwage bill. The additional revenue the firm receives depends on the marginal product of labor (MPL)and the price of the good produced (P). An additional unit of labor producesMPLunits of additionaloutput, which sells forPdollars per unit. Therefore, the additional revenue to the firm isPMPL. Thecost of hiring the additional unit of labor is the wageW. Thus, this hiring decision has the followingeffect on profits:ΔProfit= ΔRevenueΔCost= (PMPL)W.If the additional revenue,PMPL, exceeds the cost (W) of hiring the additional unit of labor, thenprofit increases. The firm will hire labor until it is no longer profitable to dosothat is, until theMPLfalls to the point where the change in profit is zero. In the equation above, the firm hires labor untilΔProfit = 0, which is when (PMPL) =W.This condition can be rewritten as:MPL=W/P.Therefore, a competitive profit-maximizing firm hires labor until the marginal product of labor equalsthe real wage. The same logic applies to the firm’s decision regarding how much capital to hire: thefirm will hire capital until the marginal product of capital equals the real rental price.3.A production function has constant returns to scale if an equal percentage increase in all factors ofproduction causes an increase in output of the same percentage. For example, if a firm increases its useof capital and labor by 50 percent, and output increases by 50 percent, then the production function hasconstant returns to scale.If the production function has constant returns to scale, then total income (or equivalently, totaloutput) in an economy of competitive profit-maximizing firms is divided between the return to labor,MPLL, and the return to capital,MPKK. That is, under constant returns to scale, economic profitis zero.4.A CobbDouglas production function has the formF(K,L) =AKαL1α. The text showed that theparameterαgives capital’s share of income. So if capital earns one-fourth of total income, then=0.25. Hence,F(K,L) =AK0.25L0.75.5.Consumption depends positively on disposable incomei.e.the amount ofincome after alltaxes havebeen paid. Higher disposable incomemeans higher consumption.The quantity of investment goods demanded depends negatively on the real interestrate. For aninvestment to be profitable, its return must be greater than its cost.Because the real interest ratemeasures the cost of funds, a higher real interest ratemakes it more costly to invest, so the demand forinvestment goods falls.

Page 11

Solution Manual For Macroeconomics Ninth Edition - Page 11 preview image

Loading page image...

Chapter 3National Income: Where It Comes Fromand Where It Goes106.Government purchases are a measure of the value of goods and services purchased directly by thegovernment. For example, the government buys missiles and tanks, builds roads, and provides servicessuch as air traffic control. All of these activities are part of GDP. Transfer payments are governmentpayments to individuals that are not in exchange for goods or services. They are the opposite of taxes:taxes reduce household disposable income, whereas transfer payments increase it. Examples of transferpayments include Social Security payments to the elderly, unemployment insurance, and veterans’benefits.7.Consumption, investment, and government purchases determine demand for the economy’s output,whereas the factors of production and the production function determine the supply of output. The realinterest rate adjusts to ensure that the demand for the economy’s goods equals the supply. At theequilibrium interest rate, the demand for goods and services equals the supply.8.When the government increases taxes, disposable income falls, and therefore consumption falls as well.Thedecrease in consumption equals the amount that taxes increase multiplied by the marginalpropensity to consume (MPC). The higher theMPCis, the greater is the negative effect of the taxincrease on consumption. Because output is fixed by the factors of production and the productiontechnology, and government purchases have not changed, the decrease in consumption must be offsetby an increase in investment. For investment to rise, the real interest rate must fall. Therefore, a taxincrease leads to a decrease in consumption, an increase in investment, and a fall in the real interestrate.Problems and Applications1.a.According to the neoclassical theory of distribution, the real wage equals the marginal product oflabor. Because ofdiminishing returns to labor, an increase in the labor force causes the marginalproduct of labor to fall. Hence, the real wage falls.Given a CobbDouglas production function, the increase in the labor force will increase themarginal product of capital and will increase the real rental price of capital. With more workers,the capital will be used more intensively and will be more productive.b.The real rental price equals the marginal product of capital. If an earthquake destroys some of thecapital stock (yet miraculously does not kill anyone and lower the labor force), the marginalproduct of capital rises and, hence, the real rental price rises.Given a CobbDouglas production function, the decrease in the capital stock will decrease themarginal product of labor and will decrease the real wage. With less capital, each worker becomesless productive.c.If a technological advance improves the production function, this is likely to increase the marginalproducts of both capital and labor. Hence, the real wage and the real rental price both increase.d.High inflation that doubles the nominal wage and the price level will have no impact on the realwage. Similarly, high inflation that doubles the nominal rental price of capital and the price levelwill have no impact on the real rental price of capital.2.a.To find the amount of output produced, substitute the given values for labor and land into theproduction function:Y= 1000.51000.5= 100.b.According to the text, theformulas for the marginal product of labor and the marginal product ofcapital (land) are:MPL= (1α)AKαLα.MPK=αAKα1L1α.

Page 12

Solution Manual For Macroeconomics Ninth Edition - Page 12 preview image

Loading page image...

Chapter 3National Income: Where It Comes Fromand Where It Goes11In this problem,αis 0.5 andAis 1. Substitute in the given values for labor and land to find themarginalproduct of labor is 0.5 and marginal product of capital (land) is 0.5. We know that thereal wage equals the marginal product of labor and the real rental price of land equals the marginalproduct of capital (land).c.Labor’s share of the output is given by the marginal product of labor times the quantity of labor, or50.d.The new level of output is 70.71.e.The new wage is 0.71. The new rental price of land is 0.35.f.Labor now receives35.36.3.A production function has decreasing returns to scale if an equal percentage increase in all factors ofproduction leads to a smaller percentage increase in output. For example, if we double the amounts ofcapital and labor outputincreases by less than double, then the production function has decreasingreturns to scale. This may happen if there is a fixed factor such as land in the production function, andthis fixed factor becomes scarce as the economy grows larger.A production function has increasing returns to scale if an equal percentage increase in all factorsof production leads to a larger percentage increase in output. For example, if doublingthe amountofcapital and laborincreases the output by more than double, then the production function has increasingreturns to scale. This may happen if specialization of labor becomes greater as the population grows.For example, if only one worker builds a car, then it takes him a long time because he has to learnmany different skills, and he must constantly change tasks and tools. But if many workers build a car,then each one can specialize in a particular task and becomemore productive.4.a.A CobbDouglas production function has the formY=AKαL1α. The text showed that the marginalproducts for the CobbDouglas production function are:MPL= (1α)Y/L.MPK=αY/K.Competitive profit-maximizing firms hire labor until its marginal productequals the real wage,and hire capital until its marginal product equals the realrental rate. Using these facts and theabove marginal products for theCobbDouglas production function, we find:W/P=MPL= (1α)Y/L.R/P=MPK=αY/K.Rewriting this:(W/P)L=MPLL= (1α)Y.(R/P)K=MPKK=αY.Note that the terms (W/P)Land (R/P)Kare the wage bill and total return to capital,respectively.Given that the value ofα= 0.3, then the above formulas indicatethat labor receives 70 percent oftotal output (or income) andcapital receives 30 percent of total output (orincome).b.To determine what happens to total output when the labor force increases by 10percent, considerthe formula for the CobbDouglas production function:Y=AKαL1α.

Page 13

Solution Manual For Macroeconomics Ninth Edition - Page 13 preview image

Loading page image...

Chapter 3National Income: Where It Comes Fromand Where It Goes12LetY1equal the initial value of output andY2equal final output. We know thatα = 0.3. We alsoknow that laborLincreases by 10 percent:Y1=AK0.3L0.7.Y2=AK0.3(1.1L)0.7.Note that we multipliedLby 1.1 to reflect the 10-percent increase in the laborforce.To calculate the percentage change in output, divideY2byY1:Y2Y1=AK0.31.1L()0.7AK0.3L0.7=1.1()0.7=1.069.That is, output increases by 6.9 percent.To determine how the increase in the labor force affects the rental price of capital, considerthe formula for the real rental price of capitalR/P:R/P=MPK=αAKα1L1α.We know thatα= 0.3. We also know that labor (L) increases by 10 percent. Let (R/P)1equal theinitial value of the rental price of capital, andlet(R/P)2equal the final rental price of capital afterthe labor force increases by 10 percent. To find (R/P)2, multiplyLby 1.1 to reflect the 10-percentincrease in the labor force:(R/P)1= 0.3AK0.7L0.7.(R/P)2= 0.3AK0.7(1.1L)0.7.The rentalprice increases by the ratioR/P()2R/P()1=0.3AK-0.71.1L()0.70.3AK-0.7L0.7=1.1()0.7=1.069So the rental price increases by 6.9 percent.To determine how the increase in the labor forceaffects the real wage, consider the formula for the real wageW/P:W/P=MPL= (1α)AKαLα.We know thatα= 0.3. We also know that labor (L) increases by 10 percent. Let (W/P)1equal theinitial value of the real wage,andlet(W/P)2equal the final value of the real wage. To find (W/P)2,multiplyLby 1.1 to reflect the 10-percent increase in the labor force:(W/P)1= (10.3)AK0.3L0.3.(W/P)2= (10.3)AK0.3(1.1L)0.3.To calculate the percentage change in the real wage, divide (W/P)2by (W/P)1:

Page 14

Solution Manual For Macroeconomics Ninth Edition - Page 14 preview image

Loading page image...

Chapter 3National Income: Where It Comes Fromand Where It Goes13W/P()2W/P()1=1-0.3()AK0.31.1L()-0.31-0.3()AK0.3L-0.3=1.1()-0.3=0.972That is, the real wage falls by 2.8 percent.c.We can use the same logic as in part (b) to setY1=AK0.3L0.7.Y2=A(1.1K)0.3L0.7.Therefore, we have:Y2Y1=A1.1K()0.3L0.7AK0.3L0.7=1.1()0.3=1.029This equation shows that output increases by about 3 percent. Notice thatα< 0.5 means thatproportional increases to capital will increase output by less than the same proportional increase tolabor.Again using the same logic as in part (b) for the change in the real rental price of capital:R/P()2R/P()1=0.3A1.1K()-0.7L0.70.3AK-0.7L0.7=1.1()-0.7=0.935The real rental price of capital falls by 6.5 percent because there are diminishingreturns to capital;that is, when capital increases, its marginal product falls.Finally, the change in the realwage is:W/P()2W/P()1=0.7A1.1K()0.3L-0.30.7AK0.3L-0.3=1.1()0.3=1.029Hence, real wages increase by 2.9 percent because the added capital increases themarginalproductivity of the existing workers. (Notice that the wage and outputhave both increased by thesame amount, leaving the labor share unchangedafeature of CobbDouglas technologies.)d.Using the same formula, we find that the change in output is:Y2Y1=1.1A()K0.3L0.7AK0.3L0.7=1.1

Page 15

Solution Manual For Macroeconomics Ninth Edition - Page 15 preview image

Loading page image...

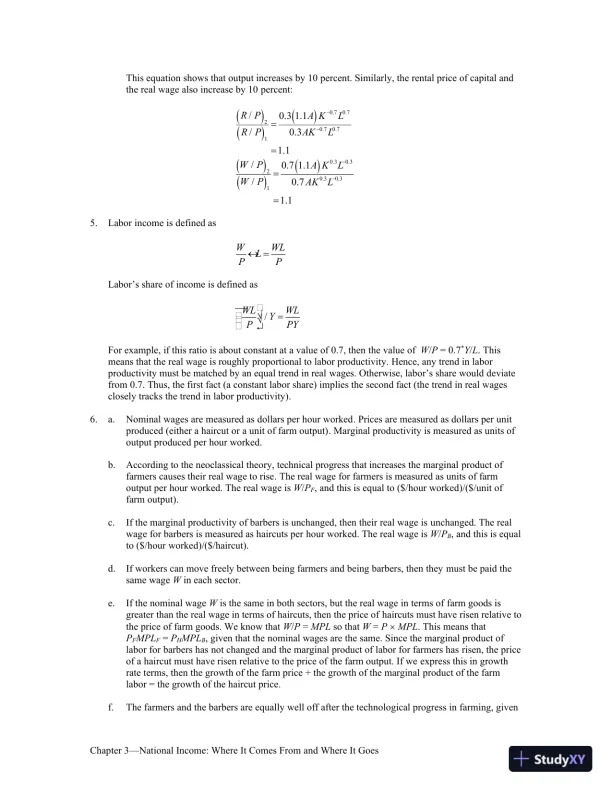
Chapter 3National Income: Where It Comes Fromand Where It Goes14This equation shows that output increases by 10 percent. Similarly, the rental price of capital andthe real wage also increase by 10percent:R/P()2R/P()1=0.3 1.1A()K-0.7L0.70.3AK-0.7L0.7=1.1W/P()2W/P()1=0.7 1.1A()K0.3L-0.30.7AK0.3L-0.3=1.15.Labor income is defined asWP´L=WLPLabor’s share of income is defined asWLPæèççöø÷÷/Y=WLPYFor example,if this ratio is about constant ata value of 0.7, thenthe value ofW/P=0.7*Y/L. Thismeans that the real wage is roughlyproportional to labor productivity.Hence, any trend in laborproductivity must be matched by an equal trend in realwages. Otherwise, labor’s share would deviatefrom 0.7. Thus, the first fact (a constantlabor share) implies the second fact (the trend in real wagesclosely tracks the trend inlabor productivity).6.a.Nominal wages are measured as dollars per hour worked.Prices are measured as dollars per unitproduced (either a haircut or a unit of farm output).Marginal productivity is measured as units ofoutput produced per hour worked.b.According to the neoclassical theory, technical progress that increases the marginalproduct offarmers causes their real wage to rise.The real wage for farmers is measured as units of farmoutput perhourworked. Thereal wage isW/PF, and this is equal to ($/hourworked)/($/unit offarm output).c.If the marginal productivity of barbers is unchanged, then their real wage isunchanged.The realwage for barbers is measured as haircuts perhourworked. The real wage isW/PB, and this is equalto ($/hourworked)/($/haircut).d.If workers can move freely between being farmers and being barbers, then theymust be paid thesame wageWin each sector.e.If the nominal wageWis the same in both sectors, but the real wage in terms offarm goods isgreater than the real wage in terms of haircuts, then the price ofhaircuts must have risen relative tothe price of farm goods. We know thatW/P=MPLso thatW=PMPL. This means thatPFMPLF=PHMPLB, given that thenominal wages are the same. Since the marginal product oflabor for barbers hasnot changed and the marginal product of labor for farmers hasrisen, the priceof ahaircut must have risen relative to the price of the farm output. If weexpressthisingrowthrate terms, then the growth of the farm price + the growth of the marginalproduct of the farmlabor = the growth of the haircut price.f.The farmers and the barbers are equally well off after the technological progress in farming, given

Page 16

Solution Manual For Macroeconomics Ninth Edition - Page 16 preview image

Loading page image...

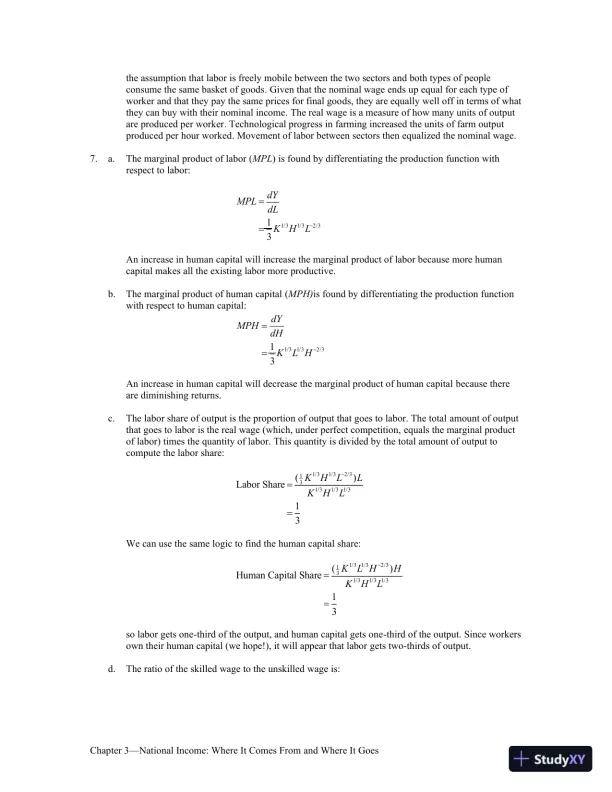
Chapter 3National Income: Where It Comes Fromand Where It Goes15the assumption that labor is freely mobile between the two sectors and both types of peopleconsume the same basket of goods.Giventhatthe nominal wage ends up equal for each type ofworkerandthatthey pay the same prices for final goods, they are equally well off in terms of whatthey canbuy with their nominal income.The real wage is a measure of how many units of outputare produced per worker.Technological progress in farming increased the units of farm outputproduced perhour worked.Movement of labor between sectors then equalized the nominal wage.7.a.The marginal product of labor(MPL)is found by differentiating the productionfunction withrespect to labor:MPL=dYdL=13K1/3H1/3L-2/3An increase in human capital will increase the marginal product of labor because more humancapital makes all the existing labor more productive.b.The marginal product of human capital(MPH)is found by differentiating the production functionwith respect to human capital:MPH=dYdH=13K1/3L1/3H-2/3An increase in human capital will decrease the marginal product of human capitalbecause thereare diminishingreturns.c.The labor share of output is the proportion of output that goes to labor. The totalamount of outputthat goes to labor is the real wage (which, under perfect competition,equals the marginal productof labor) times the quantity of labor. Thisquantity is divided by the total amount of output tocompute the labor share:Labor Share=(13K1/3H1/3L-2/3)LK1/3H1/3L1/3=13We can use the same logic to find the human capital share:Human Capital Share=(13K1/3L1/3H-2/3)HK1/3H1/3L1/3=13so labor gets one-third of the output, and human capital gets one-third of the output.Sinceworkersown their human capital (we hope!), it will appear that laborgets two-thirds of output.d.The ratio of the skilled wage to the unskilled wage is:

Page 17

Solution Manual For Macroeconomics Ninth Edition - Page 17 preview image

Loading page image...

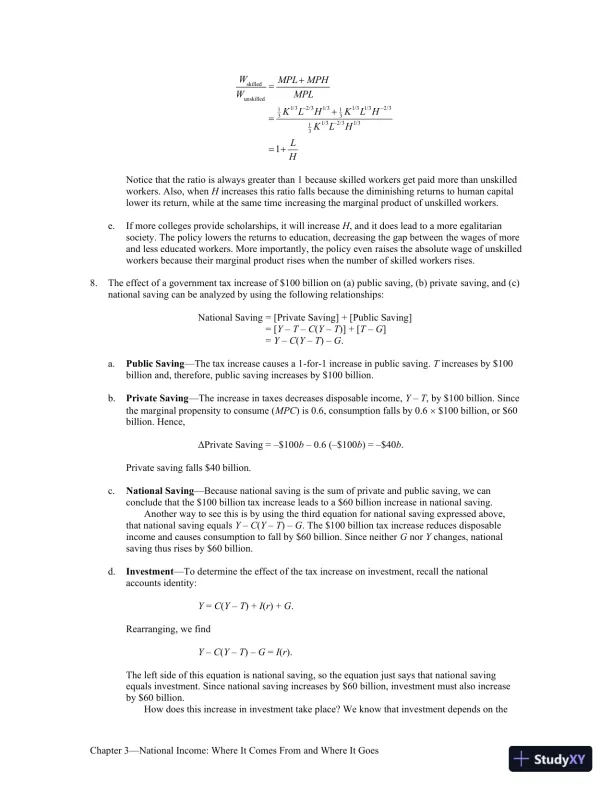
Chapter 3National Income: Where It Comes Fromand Where It Goes16WskilledWunskilled=MPL+MPHMPL=13K1/3L-2/3H1/3+13K1/3L1/3H-2/313K1/3L-2/3H1/3=1+LHNotice that the ratio is always greater than 1 because skilled workers get paidmore than unskilledworkers. Also, whenHincreases this ratio falls because thediminishing returns to human capitallower its return, while at the same timeincreasing the marginal product of unskilled workers.e.If more colleges providescholarships, it willincreaseH,andit does lead to a more egalitariansociety. The policy lowers the returns to education, decreasing the gap betweenthe wages of moreand less educated workers. More importantly, the policy evenraises the absolute wage of unskilledworkers because their marginal productrises when the number of skilled workers rises.8.The effect of a government tax increase of $100 billion on (a) public saving, (b) privatesaving, and (c)national saving can be analyzed by using the following relationships:National Saving= [Private Saving] + [Public Saving]= [YTC(YT)] + [TG]=YC(YT)G.a.Public SavingThe tax increase causes a 1-for-1 increase in public saving.Tincreases by $100billion and, therefore, public saving increases by $100 billion.b.Private SavingThe increase in taxes decreases disposable income,YT, by $100 billion. Sincethe marginal propensity to consume (MPC) is 0.6, consumption falls by 0.6$100 billion, or $60billion. Hence,ΔPrivate Saving =$100b0.6 ($100b) =$40b.Private saving falls $40 billion.c.National SavingBecause national saving is the sum of private and public saving, we canconclude that the $100 billion tax increase leads to a $60 billion increase in national saving.Another way to see this is by using the third equation for national saving expressed above,that national saving equalsYC(YT)G. The $100 billion tax increase reduces disposableincome and causes consumption to fall by $60 billion. Since neitherGnorYchanges, nationalsaving thus rises by $60 billion.d.InvestmentTo determine the effect of the tax increase on investment, recall the nationalaccounts identity:Y=C(YT) +I(r) +G.Rearranging, we findYC(YT)G=I(r).The leftside of this equation is national saving, so the equation just says that national savingequals investment. Since national saving increases by $60 billion, investment must also increaseby $60 billion.How does this increase ininvestment take place? We know that investment depends on the

Page 18

Solution Manual For Macroeconomics Ninth Edition - Page 18 preview image

Loading page image...

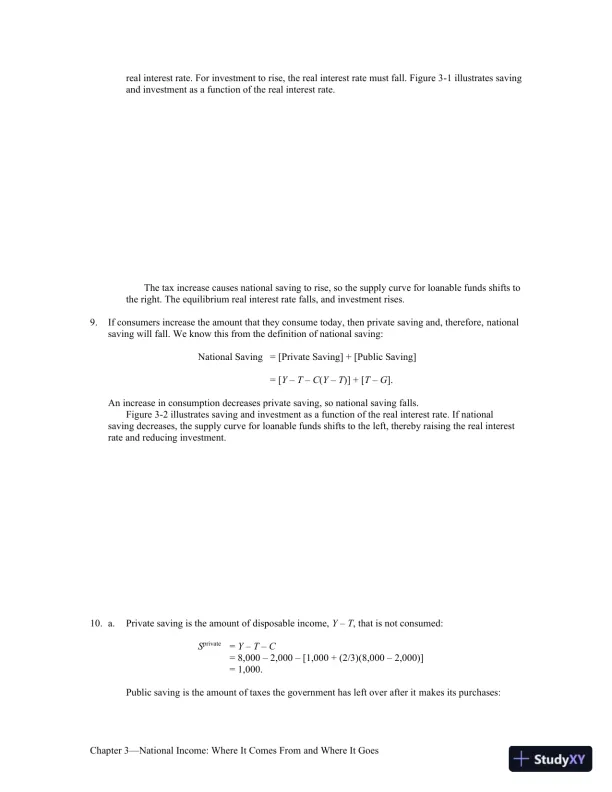
Chapter 3National Income: Where It Comes Fromand Where It Goes17real interest rate. For investment to rise, the real interest rate must fall. Figure 3-1 illustrates savingand investment as a function of the real interest rate.The tax increase causes national saving to rise, so the supply curve for loanable funds shifts tothe right. The equilibrium real interest rate falls, and investment rises.9.If consumers increase the amount that they consume today, then private saving and, therefore,nationalsaving will fall. We know this from the definition of national saving:National Saving= [Private Saving] + [Public Saving]= [YTC(YT)] + [TG].An increase in consumption decreases private saving, so national saving falls.Figure 3-2 illustrates saving and investment as a function of the real interest rate. If nationalsaving decreases, the supply curve for loanable funds shifts to the left, thereby raising the real interestrate and reducing investment.10.a.Private saving is the amount of disposable income,YT, that is not consumed:Sprivate=YTC=8,0002,000[1,000 +(2/3)(8,0002,000)]=1,000.Public saving is the amount of taxes the government has left over after itmakesits purchases:

Page 19

Solution Manual For Macroeconomics Ninth Edition - Page 19 preview image

Loading page image...

Chapter 3National Income: Where It Comes Fromand Where It Goes18Spublic=TG=2,0002,500=500.Nationalsaving is the sum of private saving and public saving:Snational=Sprivate+ Spublic=1,000 +(500)= 500.b.The equilibrium interest rate is the value ofrthat clears the market for loanablefunds. We alreadyknow that national saving is500, so we just need to set it equalto investment:Snational=I500= 1,200100rSolving this equation forr, we find:r=0.07 or 7%.c.When the government increases its spending, private saving remains the same asbefore (noticethatGdoes not appear in theSprivateequationabove) while government savingdecreases. Puttingthe newGinto the equations above:Sprivate=1,000Spublic=TG=2,0002,000= 0.Thus,Snational=Sprivate+ Spublic=1,000 + (0)=1,000.d.Once again the equilibrium interest rate clears the market for loanable funds:Snational=I1,000= 1,200100rSolving this equation forr, we find:r=0.02 or 2%.11.To determine the effect on investment of an equal increase in both taxes and governmentspending,consider the national income accounts identity fornational saving:National Saving= [Private Saving] + [Public Saving]= [YTC(YT)] + [TG].We know thatYis fixed by the factors of production. We also know that the change inconsumptionequals the marginal propensity to consume (MPC)times the change indisposable income. This tells usthatΔNational Saving={ΔT[MPC(ΔT)]}+ [ΔTΔG]= [ΔT+ (MPCΔT)] + 0

Page 20

Solution Manual For Macroeconomics Ninth Edition - Page 20 preview image

Loading page image...

Chapter 3National Income: Where It Comes Fromand Where It Goes19= (MPC1) ΔT.The above expression tells us that the impact onnationalsaving of an equal increase inTandGdepends on the size of the marginal propensity to consume. The closer theMPCis to 1, the smaller isthe fall in saving. For example, if theMPCequals 1, then the fallin consumption equals the rise ingovernment purchases, so national saving [YC(YT)G] is unchanged. The closer theMPCis to 0(and therefore the larger is theamount saved rather than spent for a one-dollar change in disposableincome), the greater is the impact on saving. Because we assume that theMPCis less than 1, weexpect that national saving falls in response to an equal increase in taxes and government spending.The reduction in saving means that the supply of loanable funds curvewill shiftto the left inFigure 3-3. The real interest rate rises, and investment falls.12.a.The demand curve for business investment shifts out to the right because thesubsidy increases thenumber of profitable investment opportunities for any given interest rate. The demand curve forresidential investment remains unchanged.b.The total demand curve for investment in the economy shifts out to the right since it represents thesum of business investment, which shifts out to the right, and residential investment, which isunchanged. As a result the real interest rate rises as in Figure 3-4.c.The total quantity of investment does not change because it is constrained by the inelastic supplyof savings. The investment tax credit leads to a rise in business investment, but an offsetting fall inresidential investment. That is, the higher interest rate means that residential investment falls (amovement along the curve), whereas the rightward shift of the business investment curve leadsbusinessinvestment to rise by an equal amount. Figure 3-5 shows this change. NotethatI1B+I1R+I2B+I2R=S.

Page 21

Solution Manual For Macroeconomics Ninth Edition - Page 21 preview image

Loading page image...

Chapter 3National Income: Where It Comes Fromand Where It Goes2013.In this chapter, we concluded that an increase in government expenditures reducesnational saving andraises the interest rate. The increase in government expendituretherefore crowds out investment bythefull amount of the increase. Similarly, a tax cut increasesdisposable income and hence consumption.This increase in consumption translates intoa fall in national saving,and the increase in consumptioncrowds out investment by the full amount of theincrease.If consumption depends on the interest rate, thensavingwill also depend on it. The higher theinterest rate, thegreater the return to saving. Hence, itseems reasonable to think that an increase in theinterest rate might increase savingand reduce consumption. Figure 3-6 shows saving as an increasingfunction of theinterest rate.Consider what happens whengovernment purchases increase. At any given levelof the interestrate, national saving falls by the change in government purchases, asshown in Figure 3-7. The figureshows that if the saving function slopes upward,investment falls by less than the amount thatgovernment purchases rises by. This happensbecause consumption falls and saving increases inresponse to the higher interestrate. Hence, the more responsive consumption is to the interest rate, thelessinvestment is crowded out bygovernmentpurchases.

Page 22

Solution Manual For Macroeconomics Ninth Edition - Page 22 preview image

Loading page image...

Chapter 3National Income: Where It Comes Fromand Where It Goes2114.a.Figure 3-8 shows the case where the demand for loanable funds is stable but the supply of funds(the saving schedule) fluctuates perhaps reflecting temporary shocks to income, changes ingovernment spending, or changes in consumerconfidence. In this case, when interest rates fall,investment rises; when interest rates rise, investment falls. We would expect a negative correlationbetween investment and interest rates.b.Figure 3-9 shows the case where the supply of loanable funds (saving) is stable, whereas thedemand for loanable funds fluctuates, perhaps reflecting changes in firms’ expectations about themarginal product of capital. We would now find a positive correlation between investment and theinterest ratewhen demand for funds rises,itpushes up the interest rate, so weobserve thatinvestment and the real interest rate increase at the same time.c.If both curves shift, we might generate a scatter plot as in Figure 3-10, where the economyfluctuates among points A, B, C, and D. Depending on how often the economy is at each of thesepoints, we might find little clear relationship between investment and interest rates.d.Situation (c) seems fairly reasonableasboth the supply of and demand forloanable fundsfluctuate over time in response to changes in the economy.

Page 23

Solution Manual For Macroeconomics Ninth Edition - Page 23 preview image

Loading page image...

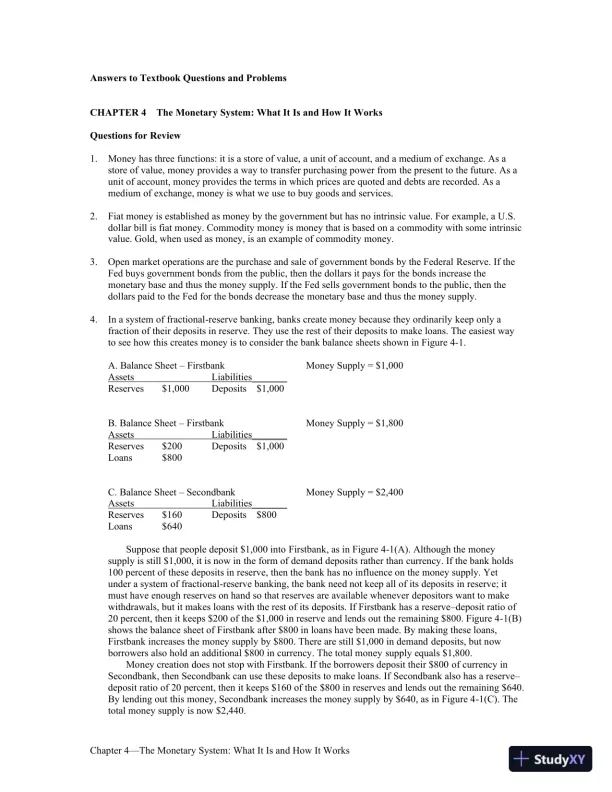
Chapter 4The Monetary System: What It Is and How It Works22Answers to Textbook Questions and ProblemsCHAPTER4The Monetary System: What It Is and How It WorksQuestions for Review1.Money has three functions: it is a store of value, a unit of account, and a medium ofexchange. As astore of value,money provides a way to transfer purchasing power fromthe present to the future. As aunit of account, money provides the terms in whichprices are quoted and debts are recorded. As amedium of exchange, money is what weuse to buy goods and services.2.Fiat money is established as money by the government but has no intrinsic value. Forexample, a U.S.dollar bill is fiat money. Commodity money is money that is based on acommodity with some intrinsicvalue. Gold, when used as money, is an example of commoditymoney.3.Open market operations are the purchase and sale of government bonds by the FederalReserve. If theFed buys government bonds from the public, then the dollars it pays forthe bonds increase themonetary base and thus the money supply. If the Fed sells governmentbonds to the public, then thedollars paid to the Fed for the bonds decrease themonetary base and thus the money supply.4.In a system of fractional-reserve banking, banks create money because they ordinarilykeep only afraction of their deposits in reserve. They use the rest of their deposits tomake loans. The easiest wayto see how this creates money is to consider the bank balancesheets shown in Figure 4-1.A. Balance SheetFirstbankMoney Supply = $1,000AssetsLiabilities_______Reserves$1,000Deposits$1,000B. Balance SheetFirstbankMoney Supply = $1,800AssetsLiabilities_______Reserves$200Deposits$1,000Loans$800C. Balance SheetSecondbankMoney Supply = $2,400AssetsLiabilities_______Reserves$160Deposits$800Loans$640Suppose that people deposit $1,000 intoFirstbank, as in Figure 4-1(A). Although the moneysupply is still $1,000, it is now inthe form of demand deposits rather thancurrency. If the bank holds100 percent ofthese deposits in reserve, then the bank has no influence on the money supply. Yetunder a system of fractional-reserve banking, the bank need not keep all of its depositsin reserve; itmust have enough reserves on hand so that reserves are available wheneverdepositors want to makewithdrawals, but it makes loans with the rest of itsdeposits. If Firstbank has a reservedeposit ratio of20 percent, then it keeps $200 ofthe $1,000 in reserve and lends out the remaining $800. Figure 4-1(B)shows the balancesheet of Firstbank after $800 in loans have been made. By making these loans,Firstbank increases the money supply by $800. There are still $1,000 in demanddeposits, but nowborrowers also hold an additional $800 in currency. The total moneysupply equals $1,800.Money creation does not stop with Firstbank. If the borrowers deposit their $800of currency inSecondbank, then Secondbank can use these deposits to make loans. IfSecondbank also has a reservedeposit ratio of 20 percent, then it keeps $160 of the$800 in reserves and lends out the remaining $640.By lending out this money, Secondbankincreases the money supply by $640, as in Figure 4-1(C). Thetotal money supplyis now $2,440.

Page 24

Solution Manual For Macroeconomics Ninth Edition - Page 24 preview image

Loading page image...

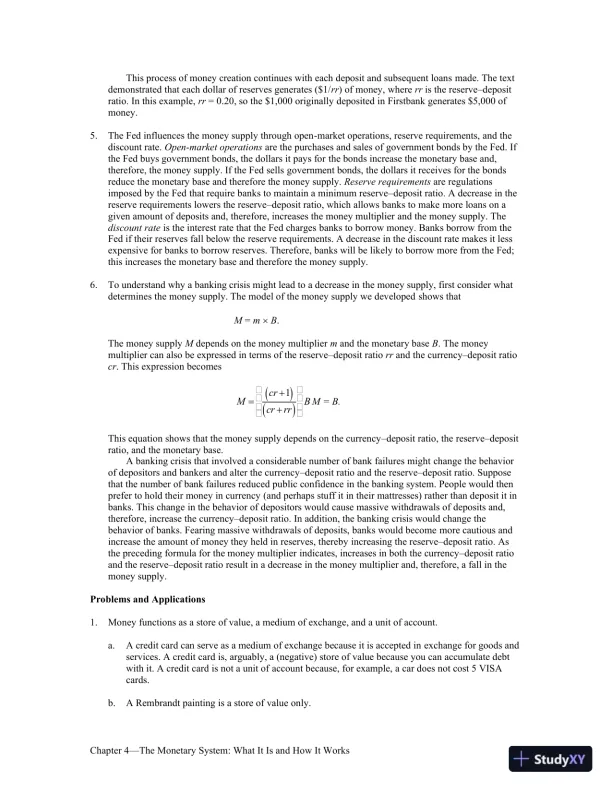
Chapter 4The Monetary System: What It Is and How It Works23This process of money creation continues with each deposit and subsequent loansmade. The textdemonstrated that each dollar of reserves generates ($1/rr) of money,whererris the reservedepositratio. In this example,rr= 0.20, so the $1,000 originallydeposited in Firstbank generates $5,000 ofmoney.5.The Fed influences the money supply through open-market operations, reserve requirements,and thediscount rate.Open-market operationsare the purchases and sales ofgovernment bonds by the Fed. Ifthe Fed buys government bonds, the dollars it pays forthe bonds increase the monetary base and,therefore, the money supply. If the Fed sellsgovernment bonds, the dollars it receives for the bondsreduce the monetary base andtherefore the money supply.Reserve requirementsare regulationsimposed by the Fedthat require banks to maintain a minimum reservedeposit ratio. A decrease in thereserve requirements lowers the reservedeposit ratio, which allows banks to makemore loans on agiven amount of deposits and,therefore, increases the money multiplierand the money supply. Thediscount rateis the interest rate that the Fed chargesbanks to borrow money. Banks borrow from theFed if their reserves fall below thereserve requirements. A decrease in the discount rate makes it lessexpensive for banksto borrow reserves. Therefore, banks will be likely to borrow more from the Fed;thisincreases the monetary base and therefore the money supply.6.To understand why a banking crisis might lead to a decrease inthe money supply, firstconsider whatdetermines the money supply. The model of the money supply we developedshows thatM=mB.The money supplyMdepends on the money multipliermand the monetary baseB. Themoneymultiplier can also be expressed in terms of the reservedeposit ratiorrand thecurrencydeposit ratiocr. This expression becomesM = B.This equation shows that the money supply depends on the currencydeposit ratio, thereservedepositratio, and the monetary base.Abanking crisis that involved a considerable number of bank failures mightchange the behaviorof depositors and bankers and alter the currencydeposit ratio andthe reservedeposit ratio. Supposethat the number of bank failures reduced public confidencein the banking system. People would thenprefer to hold their money in currency(and perhaps stuff it in their mattresses) rather than deposit it inbanks. This changein the behavior of depositors would cause massive withdrawals of deposits and,therefore,increase the currencydeposit ratio. In addition, the banking crisis would changethebehavior of banks. Fearing massive withdrawals of deposits, banks would becomemore cautious andincrease the amount of money they held in reserves, therebyincreasing the reservedeposit ratio. Asthe preceding formula for the money multiplierindicates, increases in both the currencydeposit ratioand the reservedeposit ratioresult in a decrease in the money multiplier and, therefore, a fall in themoney supply.Problems and Applications1.Money functions as a store of value, a medium of exchange, and a unit of account.a.A credit card can serve as a medium of exchange because it is accepted inexchange for goods andservices. A credit card is,arguably, a (negative) store ofvalue because you can accumulate debtwith it. A credit card is not a unit ofaccountbecause,for example,a cardoes not cost 5 VISAcards.b.A Rembrandt painting is a store of value only.M=cr+1()cr+rr()éëêêùûúúB

Page 25

Solution Manual For Macroeconomics Ninth Edition - Page 25 preview image

Loading page image...

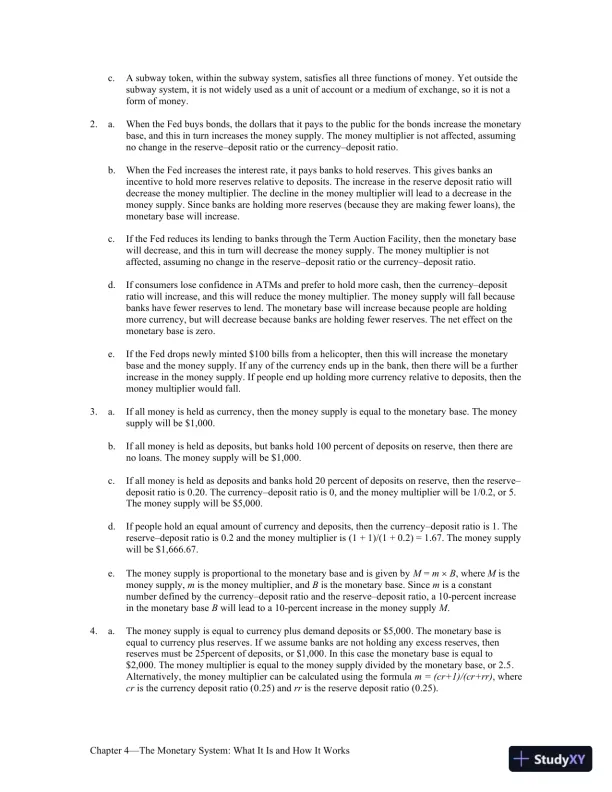
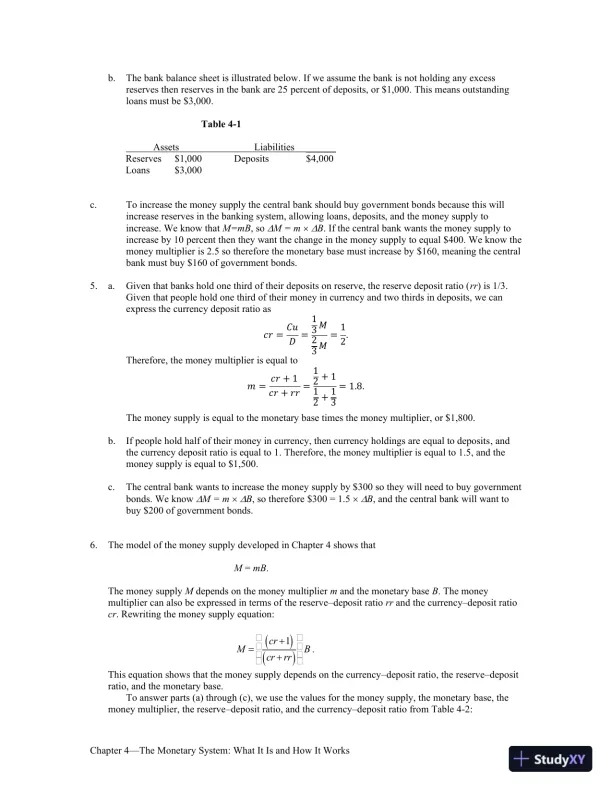
Chapter 4The Monetary System: What It Is and How It Works24c.A subway token, within the subway system, satisfies all three functions of money.Yet outside thesubway system, it is not widely used as a unit of account or amedium of exchange, so it is not aform of money.2.a.When the Fed buys bonds, the dollars that it pays to the public for the bondsincrease the monetarybase, and this in turn increases the money supply. Themoney multiplier is not affected, assumingno change in the reservedeposit ratioor the currencydeposit ratio.b.When the Fed increases the interest rate,it pays banksto hold reserves. Thisgives banks anincentive to hold more reserves relative to deposits. The increasein the reserve deposit ratio willdecrease the money multiplier. The decline in themoney multiplier will lead to a decrease in themoney supply. Since banks areholding more reserves (because they are making fewer loans), themonetary basewill increase.c.If the Fed reduces its lending to banks through the Term Auction Facility, thenthe monetary basewill decrease, and this in turn will decrease the money supply.The money multiplier is notaffected, assuming no change in the reservedepositratio or the currencydeposit ratio.d.If consumers lose confidence in ATMs and prefer to hold more cash, then thecurrencydepositratio will increase, and this will reduce the money multiplier. Themoney supply will fall becausebanks have fewer reserves to lend. The monetary basewill increase because people are holdingmore currency, but will decrease becausebanks are holding fewer reserves. The net effect on themonetary base is zero.e.If the Fed drops newly minted $100 bills from a helicopter, then this will increasethe monetarybase and the money supply. If any of the currency ends up in thebank, then there will be a furtherincrease in the money supply. If people end upholding more currency relative to deposits, then themoney multiplier would fall.3.a.If all money is held as currency, then the money supply is equal to the monetarybase. The moneysupply will be $1,000.b.If all money is held as deposits, but banks hold 100 percent of deposits on reserve,then there areno loans. The money supply will be $1,000.c.If all money is held as deposits and banks hold 20 percent of deposits on reserve,then the reservedeposit ratio is 0.20. The currencydeposit ratio is 0, and themoney multiplier will be 1/0.2, or 5.The money supply will be $5,000.d.If people hold an equal amount of currency and deposits, then the currencydeposit ratio is 1. Thereservedeposit ratio is 0.2 and the money multiplier is(1 + 1)/(1 + 0.2) = 1.67. The money supplywill be $1,666.67.e.The money supply is proportional to the monetary base and is given byM=mB,whereMis themoney supply,mis the money multiplier, andBis the monetarybase. Sincemis a constantnumber defined by the currencydeposit ratio and thereservedeposit ratio, a 10-percent increasein the monetary baseBwill lead to a10-percent increase in the money supplyM.4.a.The money supply is equal tocurrency plus demand deposits or $5,000.The monetary base isequal to currency plus reserves.If we assume banks are not holding any excess reserves, thenreserves must be 25percentof deposits, or $1,000.In this case the monetary base is equal to$2,000.The money multiplier is equal to the money supply divided by the monetary base, or 2.5.Alternatively, the money multiplier can be calculated using the formulam = (cr+1)/(cr+rr), wherecris the currency deposit ratio (0.25) andrris the reserve deposit ratio (0.25).

Page 26

Solution Manual For Macroeconomics Ninth Edition - Page 26 preview image

Loading page image...

Chapter 4The Monetary System: What It Is and How It Works25b.The bank balance sheet is illustrated below.If we assume the bank is not holding any excessreserves then reserves in the bank are 25percentof deposits, or $1,000.This means outstandingloans must be $3,000.Table 4-1AssetsLiabilities______Reserves$1,000Deposits$4,000Loans$3,000c.To increase the money supply the central bank should buy government bonds because this willincrease reserves in the banking system, allowing loans, deposits, and the money supply toincrease.We know thatM=mB, soM = mB.If the central bank wants the money supply toincrease by 10percentthen they want the change in the money supply to equal$400.We know themoney multiplier is 2.5 so therefore the monetary base must increase by$160, meaning the centralbank must buy $160 of government bonds.5.a.Giventhatbanks hold one third of their deposits on reserve, the reserve deposit ratio (rr) is 1/3.Giventhat people hold one third of their money in currency and two thirds in deposits, we canexpress thecurrency deposit ratio as𝑐𝑟=𝐶𝑢𝐷=13𝑀23𝑀=12.Therefore, the money multiplier is equal to𝑚=𝑐𝑟+1𝑐𝑟+𝑟𝑟=12+112+13=1.8.Themoney supply is equal to the monetary base times the money multiplier, or $1,800.b.If people hold half of their money in currency, then currency holdings are equal to deposits,andthe currency deposit ratio is equal to 1.Therefore,the money multiplier is equal to 1.5,and themoney supply is equal to $1,500.c.The central bank wants to increase the money supply by $300 so they will need to buy governmentbonds.We knowM = mB, so therefore$300 = 1.5B, and the central bankwill want tobuy $200 of government bonds.6.The model of the money supply developed in Chapter 4 shows thatM=mB.The money supplyMdepends on the money multipliermand the monetary baseB. Themoneymultiplier can also be expressed in terms of the reservedeposit ratiorrand thecurrencydeposit ratiocr. Rewriting the money supply equation:.This equation shows that the money supply depends on the currencydeposit ratio, thereservedepositratio, and the monetary base.To answer parts (a) through (c), we use the values for the money supply, the monetarybase, themoney multiplier, the reservedeposit ratio, and the currencydepositratio fromTable 4-2:M=cr+1()cr+rr()éëêêùûúúB

Page 27

Solution Manual For Macroeconomics Ninth Edition - Page 27 preview image

Loading page image...

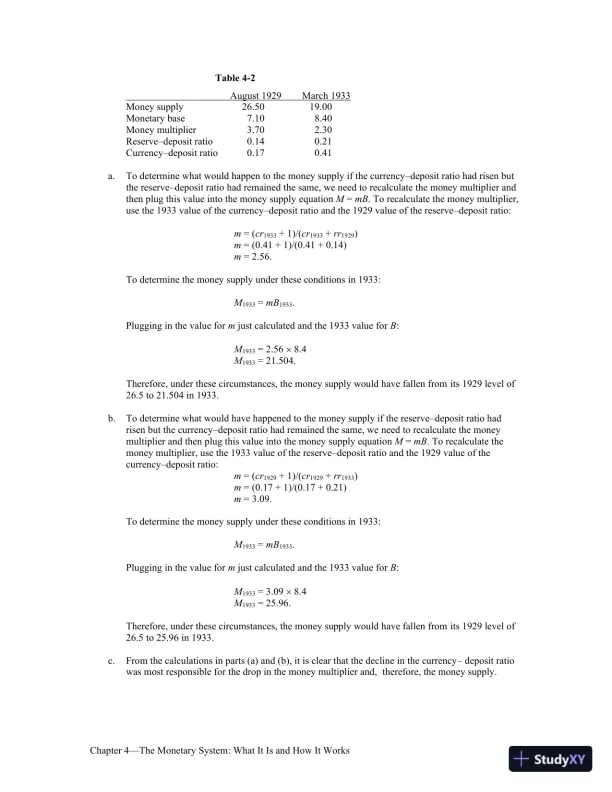
Chapter 4The Monetary System: What It Is and How It Works26Table 4-2August 1929March 1933Money supply26.5019.00Monetary base7.108.40Money multiplier3.702.30Reservedeposit ratio0.140.21Currencydeposit ratio0.170.41a.To determine what would happen to themoney supply if the currencydepositratio had risen butthe reservedeposit ratio had remained the same, we need torecalculate the money multiplier andthen plug this value into the money supplyequationM=mB. To recalculate the money multiplier,use the 1933 value of thecurrencydeposit ratio and the 1929 value of the reservedeposit ratio:m= (cr1933+ 1)/(cr1933+rr1929)m= (0.41 + 1)/(0.41 + 0.14)m= 2.56.To determine the money supply under these conditions in 1933:M1933=mB1933.Plugging in the value formjust calculated and the 1933 value forB:M1933= 2.568.4M1933= 21.504.Therefore, under these circumstances, the money supply would have fallen fromits 1929 level of26.5 to 21.504 in 1933.b.Todetermine what would have happened to the money supply if the reservedeposit ratio hadrisen but the currencydeposit ratio had remained the same, weneed to recalculate the moneymultiplier and then plug this value into the moneysupply equationM=mB. To recalculate themoney multiplier, use the 1933 valueof the reservedeposit ratio and the 1929 value of thecurrencydeposit ratio:m= (cr1929+ 1)/(cr1929+rr1933)m= (0.17 + 1)/(0.17 + 0.21)m= 3.09.To determine the money supply under these conditions in 1933:M1933=mB1933.Plugging in the value formjust calculated and the 1933 value forB:M1933= 3.098.4M1933= 25.96.Therefore, under these circumstances, the money supply would have fallen fromits 1929 level of26.5to 25.96 in 1933.c.From the calculations in parts (a) and (b), it is clear that the decline in the currencydeposit ratiowas most responsible for the drop in the money multiplier and,therefore, the money supply.

Page 28

Solution Manual For Macroeconomics Ninth Edition - Page 28 preview image

Loading page image...

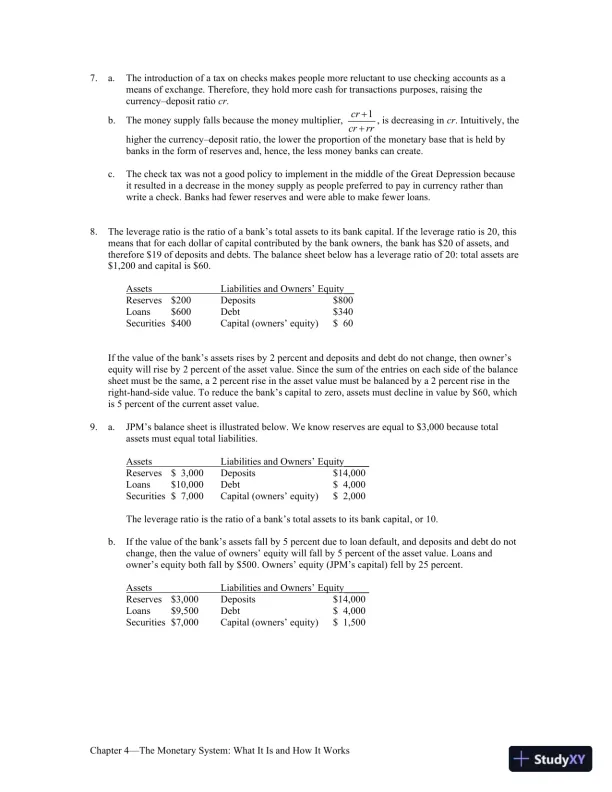
Chapter 4The Monetary System: What It Is and How It Works277.a.Theintroduction of a tax on checks makes people more reluctant to use checkingaccounts as ameans of exchange. Therefore, they hold more cash for transactionspurposes, raising thecurrencydeposit ratiocr.b.The money supply falls because the money multiplier,cr+1cr+rr, is decreasing incr.Intuitively, thehigher the currencydeposit ratio, the lower the proportion of themonetary base that is held bybanks in the form of reserves and, hence, the lessmoney banks can create.c.The check tax was not a good policy to implement in the middle of the GreatDepression becauseit resultedin a decrease in the money supply as people preferredto pay in currency rather thanwrite a check. Banks had fewer reserves andwere able to make fewer loans.8.The leverage ratio is the ratio of a bank’s total assets to its bank capital. If the leverageratio is20, thismeans that for each dollar of capital contributed by the bank owners,the bank has $20of assets, andtherefore $19 of deposits and debts. The balancesheet below has a leverage ratio of20: total assets are$1,200 and capital is $60.AssetsLiabilities and OwnersEquity__Reserves$200Deposits$800Loans$600Debt$340Securities$400Capital (ownersequity)$60If the value of the bank’s assets rises by2percent and deposits and debt do not change,then owner’sequity will rise by2percentof the asset value. Since the sum of the entries on eachside of the balancesheet must be the same, a2percent rise in the asset value must bebalanced by a2percent rise in theright-hand-side value. To reduce the bank’s capitalto zero, assets must decline in value by $60, whichis5percent of thecurrent assetvalue.9.a.JPM’s balance sheet is illustrated below.We know reserves are equal to $3,000 because totalassets must equal total liabilities.AssetsLiabilities and OwnersEquity_____Reserves$ 3,000Deposits$14,000Loans$10,000Debt$4,000Securities$ 7,000Capital (ownersequity)$2,000The leverage ratio is the ratio of a bank’s total assets to its bank capital, or 10.b.If thevalue of the bank’s assets fallby5percentdue to loan default,and deposits and debt do notchange, thenthe value ofownersequity willfallby5percentof the asset value.Loans andowner’s equity both fall by $500.Ownersequity (JPM’s capital) fell by 25 percent.AssetsLiabilities and OwnersEquity_____Reserves$3,000Deposits$14,000Loans$9,500Debt$4,000Securities$7,000Capital (ownersequity)$1,500

Page 29

Solution Manual For Macroeconomics Ninth Edition - Page 29 preview image

Loading page image...

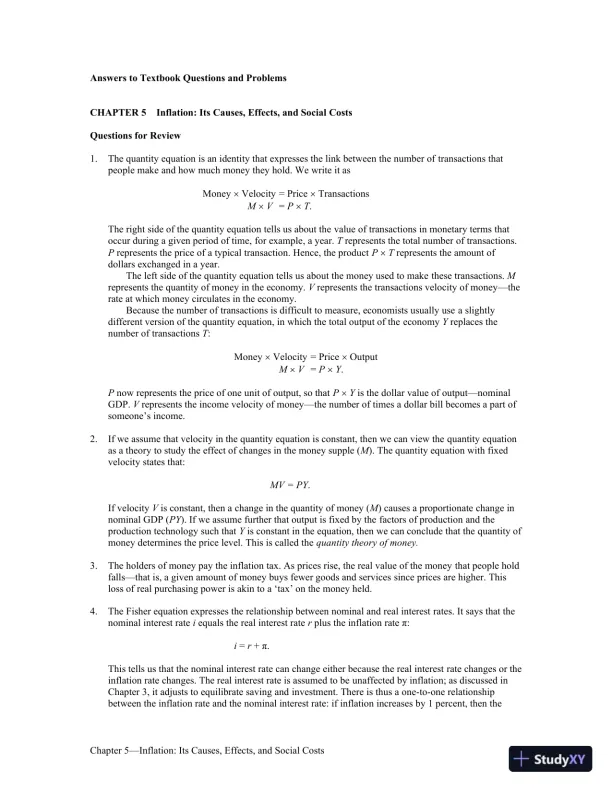
Chapter 5Inflation: Its Causes, Effects, and Social Costs28Answers to Textbook Questions and ProblemsCHAPTER5Inflation: Its Causes, Effects, and Social CostsQuestions for Review1.The quantity equation is an identity that expresses the link between the number oftransactions thatpeople make and howmuch money they hold. We write it asMoneyVelocity= PriceTransactionsMV=PT.The rightside of the quantity equation tells us about thevalueof transactionsin monetary termsthatoccur during a given period of time,for example, a year.Trepresents the total numberof transactions.Prepresents the price of a typical transaction. Hence, the productPTrepresents theamountofdollars exchanged in a year.The leftside of the quantity equation tells us about the money used to makethese transactions.Mrepresents the quantity of money in the economy.Vrepresentsthe transactions velocity of moneytherate at which money circulates in the economy.Because the number of transactions is difficult to measure, economists usually usea slightlydifferent version of the quantity equation, in which the total output of theeconomyYreplaces thenumber of transactionsT:MoneyVelocity= PriceOutputMV=PY.Pnow represents the price of one unit of output, so thatPYis the dollar value of outputnominalGDP.Vrepresents the income velocity of moneythe number of times adollar bill becomes a part ofsomeone’s income.2.If we assume that velocity in the quantity equation is constant, then we can view thequantity equationas a theoryto study the effect of changes in the money supple (M). The quantity equation with fixedvelocitystates that:MV = PY.If velocityVis constant, then achange in the quantity of money (M) causes a proportionatechange innominal GDP (PY). If we assume further that output is fixed by thefactors of productionand theproduction technology such thatYis constant in the equation,then we can conclude that thequantity ofmoney determines the price level. This is called thequantity theory ofmoney.3.The holders of money pay the inflation tax. As prices rise, the real value of the moneythat people holdfallsthat is, a given amount of money buys fewer goods and servicessince prices are higher.Thisloss of real purchasing power is akin to a ‘tax’ on the money held.4.The Fisher equation expresses the relationship between nominal and real interestrates. It says that thenominal interest rateiequals the real interest raterplus theinflation rate π:i=r+ π.This tells us that the nominal interest rate can change either because the real interestrate changes or theinflation rate changes. The real interest rate is assumed to beunaffectedby inflation; as discussed inChapter 3, it adjusts to equilibrate saving andinvestment. There is thus a one-to-one relationshipbetween the inflation rate and thenominal interest rate: if inflation increases by 1 percent, then the

Page 30

Solution Manual For Macroeconomics Ninth Edition - Page 30 preview image

Loading page image...

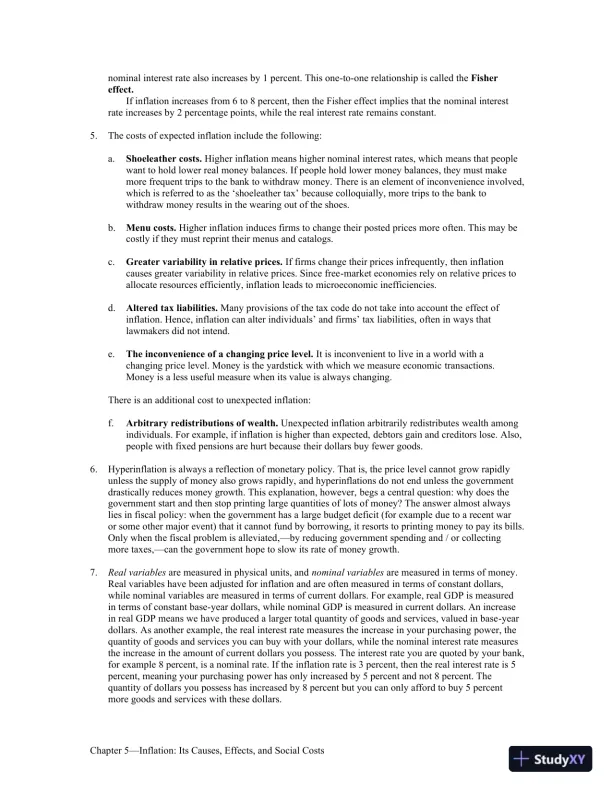
Chapter 5Inflation: Its Causes, Effects, and Social Costs29nominal interest ratealso increases by 1 percent. This one-to-one relationship is called theFishereffect.If inflation increases from 6 to 8 percent, then the Fisher effect implies that thenominal interestrate increases by 2 percentage points, while the real interest rateremains constant.5.The costs of expected inflation include the following:a.Shoeleather costs.Higher inflation means higher nominal interest rates, whichmeansthat peoplewant to hold lower real money balances. If people hold lowermoney balances, they must makemore frequent trips to the bank to withdrawmoney.There is an element of inconvenience involved,which is referred to as the ‘shoeleather tax’because colloquially, more trips to the bank towithdraw money results in the wearing out of the shoes.b.Menu costs.Higher inflation induces firms to change their posted prices moreoften. This may becostly if they must reprint their menus and catalogs.c.Greater variability in relative prices.If firms change their prices infrequently,then inflationcauses greater variability in relative prices. Since free-marketeconomies rely on relative prices toallocate resources efficiently, inflation leads tomicroeconomic inefficiencies.d.Altered tax liabilities.Many provisions of the tax code do not take into account theeffect ofinflation. Hence, inflation can alter individuals’ and firms’ tax liabilities,often in ways thatlawmakers did not intend.e.The inconvenience of a changing price level.It is inconvenient to live in a worldwith achanging price level. Money is the yardstick with which we measure economictransactions.Money is a less useful measure when its value is alwayschanging.There is an additional cost to unexpected inflation:f.Arbitrary redistributions of wealth.Unexpected inflation arbitrarily redistributeswealth amongindividuals. For example, if inflation is higher than expected,debtors gain and creditors lose.Also,people with fixed pensions are hurt becausetheir dollars buy fewer goods.6.Hyperinflation is always a reflection of monetary policy. That is, the price level cannotgrow rapidlyunless the supply of money also grows rapidly,and hyperinflations do notend unless the governmentdrastically reduces money growth. This explanation, however,begs a central question: why does thegovernment start and then stop printinglarge quantities oflotsof money? The answer almostalwayslies in fiscal policy: when the government has alarge budget deficit (for exampledue to a recent waror some other major event) that it cannotfund by borrowing, it resorts to printing money to pay its bills.Only when thefiscal problem is alleviated,by reducing government spending and/ orcollectingmoretaxes,can the government hope to slow its rate of money growth.7.Real variablesare measured in physical units, andnominal variablesare measured interms of money.Real variables have been adjusted for inflation and are often measuredin terms of constant dollars,while nominal variables are measured in terms of currentdollars. For example, real GDP is measuredin terms of constant base-year dollars,while nominal GDP is measured in current dollars. An increasein real GDP means wehave produced a larger total quantity of goods and services, valued in base-yeardollars.As another example, the real interest rate measures the increase in your purchasingpower, thequantity of goods and services you can buy with yourdollars, while the nominalinterest rate measuresthe increase in the amount of current dollars you possess.The interest rate you are quoted by your bank,for example8percent, is a nominal rate. If theinflation rate is 3 percent, then the real interest rate is 5percent, meaning your purchasingpower has only increased by 5 percent and not 8 percent. Thequantity of dollarsyou possess has increased by 8 percent but you can only afford to buy 5 percentmore goods and services with these dollars.

Page 31

Solution Manual For Macroeconomics Ninth Edition - Page 31 preview image

Loading page image...

Chapter 5Inflation: Its Causes, Effects, and Social Costs30Problems and Applications1.a.To find the growth rate of nominal GDP, we start with the quantity equationMV = PY,andnote thatPYis equal to nominal GDP, or the value of the goods and services producedmeasured in current dollars. If we express this formula in percentage change form we have:% Change inM+ % Change inV= % Change inPY.If we assume the percentage change invelocity is zero, then the percentage change in nominalGDP is equal to the percentage change in the money supply, or 8 percent.b. To find the inflation rate, express the quantity equation in percentage change form:b.To find the inflation rate, express the quantity equation in percentage change form:% Change inM+ % Change inV= % Change inP +% Change inY.Rearranging this equation tells us that the inflation rate is given by:% Change inP= % Change inM+ % Change inV% Change inY.Substituting theinformationgiven in the problem, we thus find:% Change inP=8% + 0%3%=5%.c.Thereal interest rate is4percent: the nominal interest rate of9percent minusthe inflation rate of5percent.2.Themoney demand function is given asMPæèççöø÷÷d=kY.a.To find the average inflation rate the money demand function can be expressed interms of growthrates:% GrowthMd% GrowthP= % Growth Y.The parameterkis a constant, so it can be ignored. The percentage change innominal moneydemandMdis the same as the growth in the money supplybecause nominal money demand has toequal nominal money supply. If nominalmoney demand grows 12 percent and realincome (Y)grows 4 percent then thegrowth of the price levelor the inflation rateis 8 percent.b.From the answer to part (a), it follows that an increase in real income growth willresult in a loweraverage inflation rate. For example, if real income grows at 6percent and money supply growthremains at 12 percent, then inflation falls to 6percent. In this case, a larger money supply isrequired to support a higher level ofGDP, resulting in lower inflation.c.The parameterkdefines how much money people want to hold for every dollar ofincome. Theparameterkis inversely related to the velocity of money. All elseremainingthesame, if peopleare holding fewer dollars, then each dollar must be used moretimes to purchase the samequantityof goods and services.d.If velocity growth is positive, then allremainingelse the same inflation will be higher. Fromthequantity equation we know that:
Preview Mode

This document has 202 pages. Sign in to access the full document!

Study Now!

XY-Copilot AI
Unlimited Access
Secure Payment
Instant Access
24/7 Support
Document Chat

Document Details

Subject
Economics

Related Documents

View all