Solution Manual for Mathematics in Action: Algebraic, Graphical, and Trigonometric Problem Solving, 6th Edition

Get ahead in your studies with Solution Manual for Mathematics in Action: Algebraic, Graphical, and Trigonometric Problem Solving, 6th Edition, offering the solutions and explanations needed to understand your textbook.

Julian Cooper
Contributor
4.0
52
5 months ago
Preview (16 of 63 Pages)
100%
Purchase to unlock

Page 1

Solution Manual for Mathematics in Action: Algebraic, Graphical, and Trigonometric Problem Solving, 6th Edition - Page 1 preview image

Loading page image...

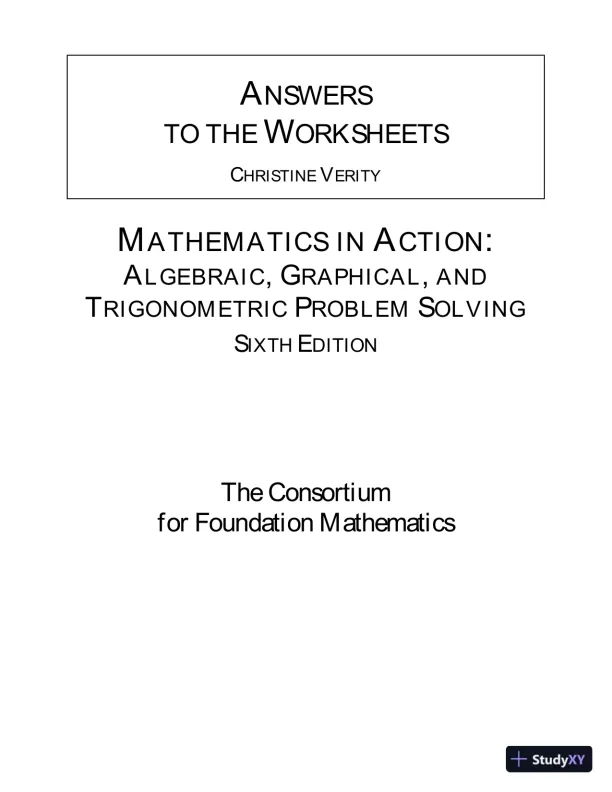
ANSWERSTO THEWORKSHEETSCHRISTINEVERITYMATHEMATICS INACTION:ALGEBRAIC,GRAPHICAL,ANDTRIGONOMETRICPROBLEMSOLVINGSIXTHEDITIONThe Consortiumfor Foundation Mathematics

Page 2

Solution Manual for Mathematics in Action: Algebraic, Graphical, and Trigonometric Problem Solving, 6th Edition - Page 2 preview image

Loading page image...

Page 3

Solution Manual for Mathematics in Action: Algebraic, Graphical, and Trigonometric Problem Solving, 6th Edition - Page 3 preview image

Loading page image...

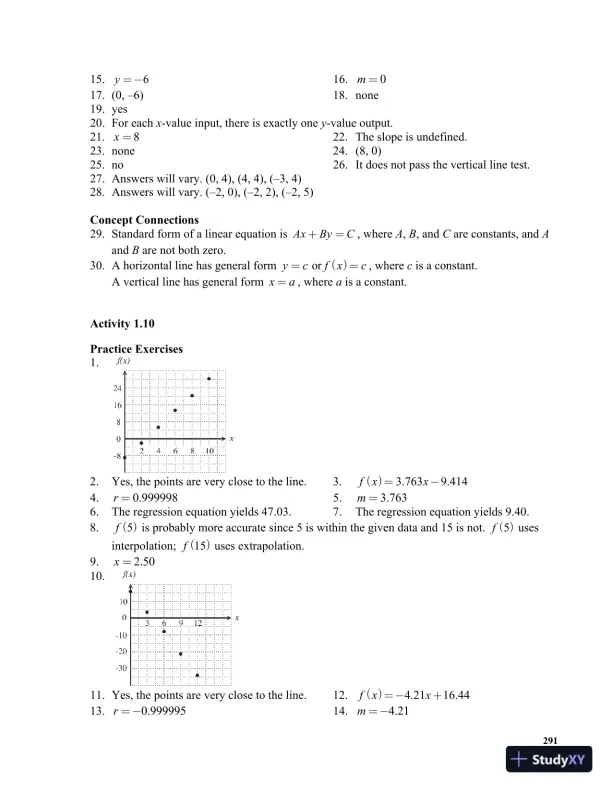
283Complete AnswersChapter 1 FUNCTION SENSEActivity 1.1Key Terms1.ordered pair2.dependent3.variable4.independent5.functionPractice Exercises6.The input isx.7.The output ish(x) ory.8.The function name ish.9.yequalshofx.10. The input is 7.11.The output is 6.931.12. The function name isg.13.gof 7 equals 6.931.14. The input ist.15.The output is 762.16. The function name isf.17.762 equalsfoft.18. The input is hours.19.The output is salary.20. The function name iss.21.Salary is a function of hours, orsalary equalssof hours.22.()pricecommissionC=23.(6000, 20)24. Yes25.Each input has only one output.26. No27.The input 2 has two different outputs.28. The input 9 is paired with three different outputs.Concept Connections29. Answers may vary. One example is the output is the wages received.30. No. The input, number of hours worked, is paired with 4 different outputs, wages received.Activity 1.2Key Terms1.Practical range2.Practical domainPractice Exercises3.()39f=4.()2.719.5f-= -5.( )56fcc=-6.( )490.2g= -7.()5.1226.7g-= -8.()286.213g bbb= -++9.()611h=10.()14.711h-=11.()11h d=12.()22.5p-= -13.()0.510p=14.( )5p aa=

Page 4

Solution Manual for Mathematics in Action: Algebraic, Graphical, and Trigonometric Problem Solving, 6th Edition - Page 4 preview image

Loading page image...

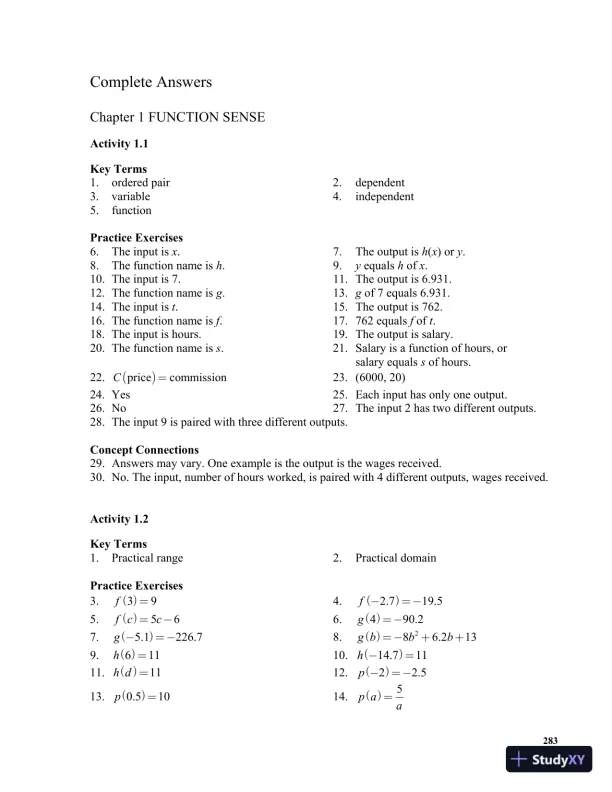
28415.()720.1r-=16.()8.415.32r= -17.( )42.3r cc=-18. The amount of reimbursement is 0.51 times the number of miles traveled.19. miles20. the amount of reimbursement21.()0.51R mm=22.R23.()74$37.74R=24.Domain: all real numbers25. Range: all real numbers26. Practical domain may vary and is probably the real numbers from 0 to 100 miles.27. Using the domain from Exercise #26, the range is $0 to $51.28. Domain {–3, 9, 7, 4}; range: {6, 0, 4, 17}Concept Connections29. The domain of the function is the collection of all possible replacement values for theindependent variable. The practical domain is the collection of replacement values of theindependent variable that makes practical sense in the context of the situation.30. A real number is any rational or irrational number.Activity 1.3Key Terms1.discrete2.continuous3.graphicallyPractice Exercises4.20.5yx=5.20.5yx= -6.20.52yx=+7.20.52yx=-

Page 5

Solution Manual for Mathematics in Action: Algebraic, Graphical, and Trigonometric Problem Solving, 6th Edition - Page 5 preview image

Loading page image...

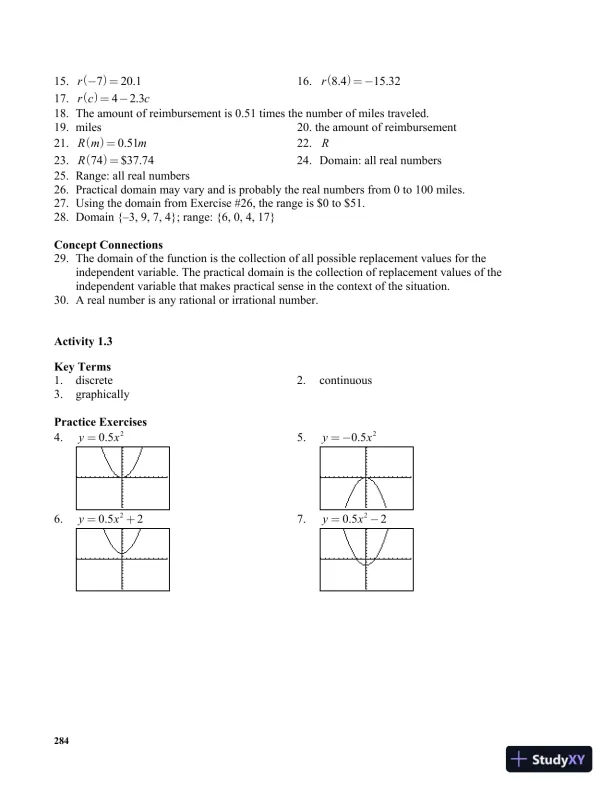
2858.9.{1, 2, 3, 4, 5}10. {44, 61, 59, 82, 98}11.Yes12. Since a particular day of the week is the input, the only input values that are defined areintegers from 1 through 5.13. No14. The number of student make-up tests cannot be predicted.15. The employee discount on an item of food is calculated by multiplying the price of the fooditem by 0.25.16. Ifdrepresents the discount amount on an item priced atpdollars, thend= 0.25p.17. Answers may vary.Item price48121620Amount of discount1234518.19. No20. Since the function is defined for all values between the input values in the table, it isappropriate to connect the data points with a smooth, continuous curve.21.20.0005yx=(no graph appears on screen)22.32101230.00450.0020.000500.00050.0020.0045xy---23. Theyvalues are very small. Therefore, you need to have Ymax = 0.01and Ymin = –0.01.

Page 6

Solution Manual for Mathematics in Action: Algebraic, Graphical, and Trigonometric Problem Solving, 6th Edition - Page 6 preview image

Loading page image...

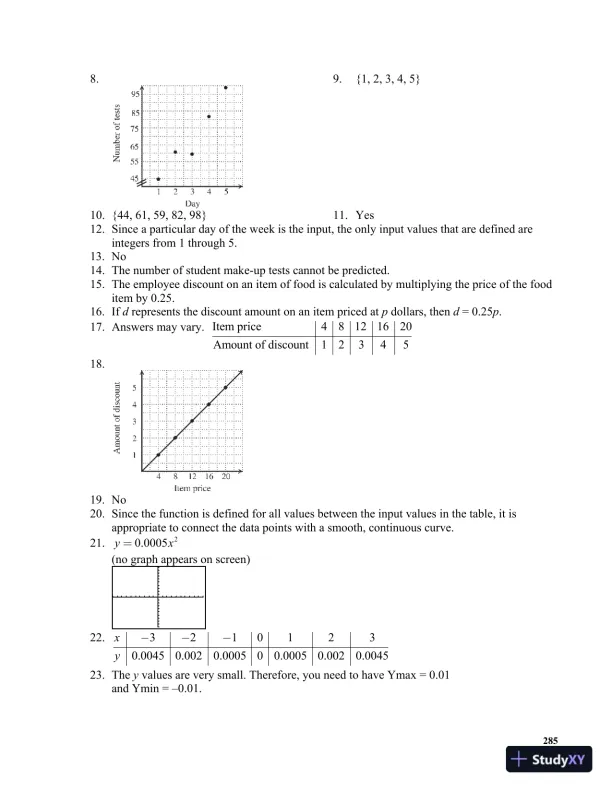
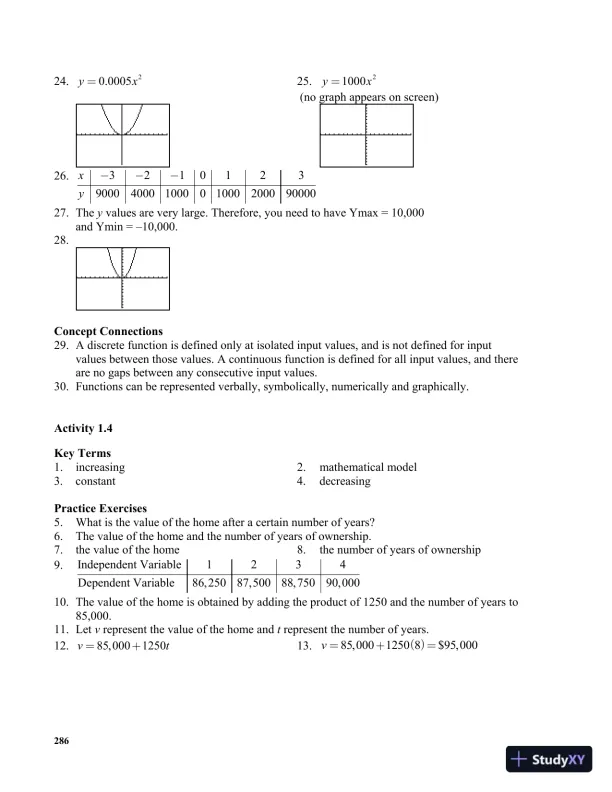
28624.20.0005yx=25.21000yx=(no graph appears on screen)26.321012390004000100001000200090000xy---27. Theyvalues are very large. Therefore, you need to have Ymax = 10,000and Ymin = –10,000.28.Concept Connections29. A discrete function is defined only at isolated input values, and is not defined for inputvalues between those values. A continuous function is defined for all input values, and thereare no gaps between any consecutive input values.30. Functions can be represented verbally, symbolically, numerically and graphically.Activity 1.4Key Terms1.increasing2.mathematical model3.constant4.decreasingPractice Exercises5.What is the value of the home after a certain number of years?6.The value of the home and the number of years of ownership.7.the value of the home8.the number of years of ownership9.Independent Variable1234Dependent Variable86, 25087,50088,75090,00010. The value of the home is obtained by adding the product of 1250 and the number of years to85,000.11. Letvrepresent the value of the home andtrepresent the number of years.12.85,0001250vt=+13.( )85,0001250 8$95,000v=+=

Page 7

Solution Manual for Mathematics in Action: Algebraic, Graphical, and Trigonometric Problem Solving, 6th Edition - Page 7 preview image

Loading page image...

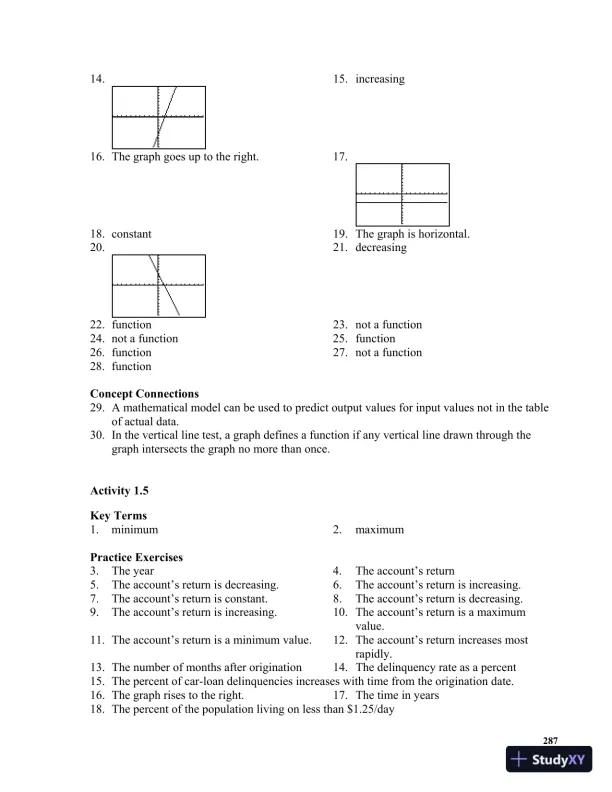
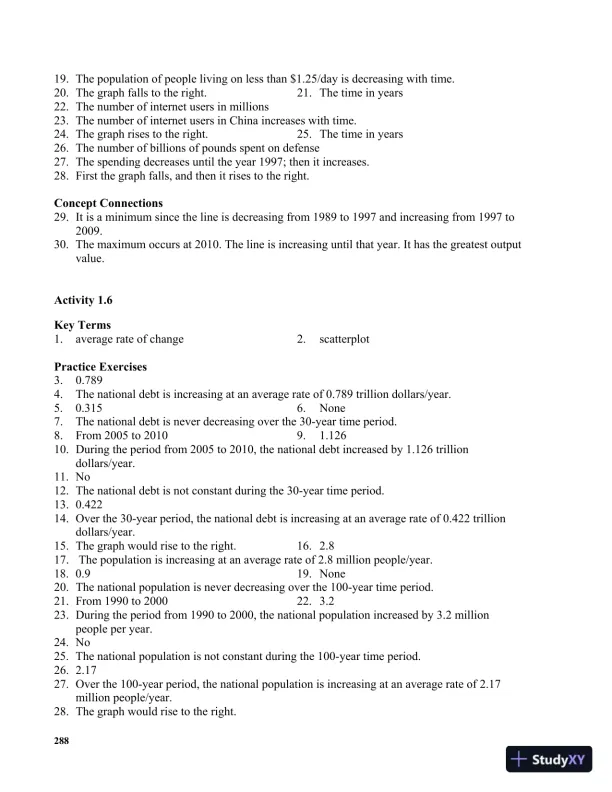
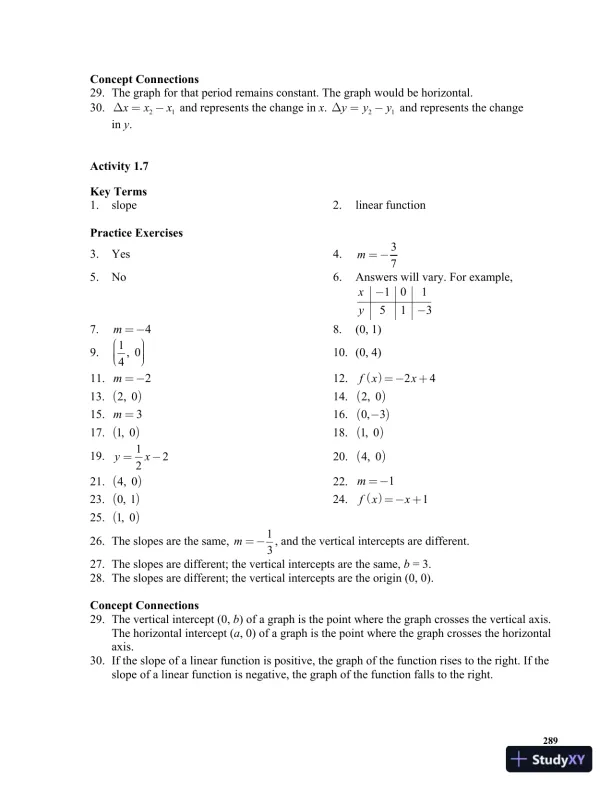
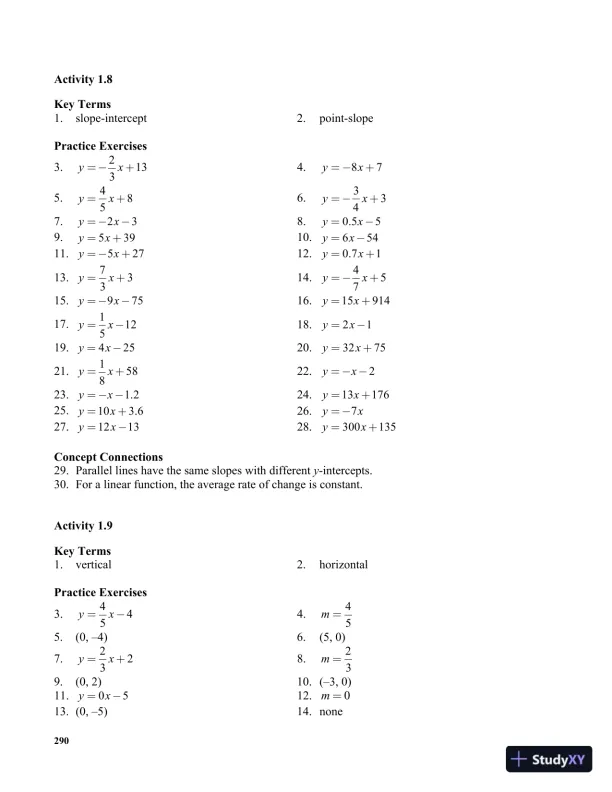
28714.15.increasing16. The graph goes up to the right.17.18. constant19.The graph is horizontal.20.21.decreasing22. function23.not a function24. not a function25.function26. function27.not a function28. functionConcept Connections29. A mathematical model can be used to predict output values for input values not in the tableof actual data.30. In the vertical line test, a graph defines a function if any vertical line drawn through thegraph intersects the graph no more than once.Activity 1.5Key Terms1.minimum2.maximumPractice Exercises3.The year4.The account’s return5.The account’s return is decreasing.6.The account’s return is increasing.7.The account’s return is constant.8.The account’s return is decreasing.9.The account’s return is increasing.10.The account’s return is a maximumvalue.11. The account’s return is a minimum value.12.The account’s return increases mostrapidly.13. The number of months after origination14.The delinquency rate as a percent15. The percent of car-loan delinquencies increases with time from the origination date.16. The graph rises to the right.17.The time in years18. The percent of the population living on less than $1.25/day

Page 8

Solution Manual for Mathematics in Action: Algebraic, Graphical, and Trigonometric Problem Solving, 6th Edition - Page 8 preview image

Loading page image...

28819. The population of people living on less than $1.25/day is decreasing with time.20. The graph falls to the right.21.The time in years22. The number of internet users in millions23. The number of internet users in China increases with time.24. The graph rises to the right.25.The time in years26. The number of billions of pounds spent on defense27. The spending decreases until the year 1997; then it increases.28. First the graph falls, and then it rises to the right.Concept Connections29. It is a minimum since the line is decreasing from 1989 to 1997 and increasing from 1997 to2009.30. The maximum occurs at 2010. The line is increasing until that year. It has the greatest outputvalue.Activity 1.6Key Terms1.average rate of change2.scatterplotPractice Exercises3.0.7894.The national debt is increasing at an average rate of 0.789 trillion dollars/year.5.0.3156.None7.The national debt is never decreasing over the 30-year time period.8.From 2005 to 20109.1.12610. During the period from 2005 to 2010, the national debt increased by 1.126 trilliondollars/year.11. No12. The national debt is not constant during the 30-year time period.13. 0.42214. Over the 30-year period, the national debt is increasing at an average rate of 0.422 trilliondollars/year.15. The graph would rise to the right.16.2.817.The population is increasing at an average rate of 2.8 million people/year.18. 0.919.None20. The national population is never decreasing over the 100-year time period.21. From 1990 to 200022.3.223. During the period from 1990 to 2000, the national population increased by 3.2 millionpeople per year.24. No25. The national population is not constant during the 100-year time period.26. 2.1727. Over the 100-year period, the national population is increasing at an average rate of 2.17million people/year.28. The graph would rise to the right.

Page 9

Solution Manual for Mathematics in Action: Algebraic, Graphical, and Trigonometric Problem Solving, 6th Edition - Page 9 preview image

Loading page image...

289Concept Connections29. The graph for that period remains constant. The graph would be horizontal.30.21xxxD=-and represents the change inx.21yyyD=-and represents the changeiny.Activity 1.7Key Terms1.slope2.linear functionPractice Exercises3.Yes4.37m= -5.No6.Answers will vary. For example,101513xy--7.4m= -8.(0, 1)9.1 , 04æö÷ç÷ç÷çèø10.(0, 4)11.2m= -12.( )24fxx= -+13.()2, 014.()2, 015.3m=16.()0,3-17.()1, 018.()1, 019.122yx=-20.()4, 021.()4, 022.1m= -23.()0, 124.()1fxx= -+25.()1, 026. The slopes are the same,13m= -, and the vertical intercepts are different.27. The slopes are different; the vertical intercepts are the same,b= 3.28. The slopes are different; the vertical intercepts are the origin (0, 0).Concept Connections29. The vertical intercept (0,b) of a graph is the point where the graph crosses the vertical axis.The horizontal intercept (a, 0) of a graph is the point where the graph crosses the horizontalaxis.30. If the slope of a linear function is positive, the graph of the function rises to the right. If theslope of a linear function is negative, the graph of the function falls to the right.

Page 10

Solution Manual for Mathematics in Action: Algebraic, Graphical, and Trigonometric Problem Solving, 6th Edition - Page 10 preview image

Loading page image...

290Activity 1.8Key Terms1.slope-intercept2.point-slopePractice Exercises3.2133yx= -+4.87yx= -+5.485yx=+6.334yx= -+7.23yx= --8.0.55yx=-9.539yx=+10.654yx=-11.527yx= -+12.0.71yx=+13.733yx=+14.457yx= -+15.975yx= --16.15914yx=+17.1125yx=-18.21yx=-19.425yx=-20.3275yx=+21.1588yx=+22.2yx= --23.1.2yx= --24.13176yx=+25.103.6yx=+26.7yx= -27.1213yx=-28.300135yx=+Concept Connections29. Parallel lines have the same slopes with differenty-intercepts.30. For a linear function, the average rate of change is constant.Activity 1.9Key Terms1.vertical2.horizontalPractice Exercises3.445yx=-4.45m=5.(0, –4)6.(5, 0)7.223yx=+8.23m=9.(0, 2)10.(–3, 0)11.05yx=-12.0m=13. (0, –5)14.none

Page 11

Solution Manual for Mathematics in Action: Algebraic, Graphical, and Trigonometric Problem Solving, 6th Edition - Page 11 preview image

Loading page image...

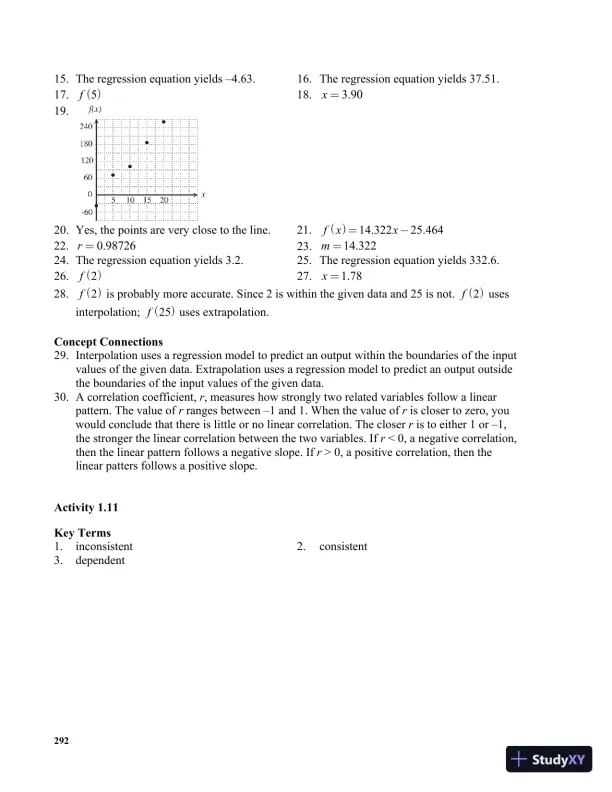
29115.6y= -16.0m=17. (0, –6)18.none19. yes20. For eachx-value input, there is exactly oney-value output.21.8x=22.The slope is undefined.23. none24.(8, 0)25. no26.It does not pass the vertical line test.27. Answers will vary. (0, 4), (4, 4), (–3, 4)28. Answers will vary. (–2, 0), (–2, 2), (–2, 5)Concept Connections29. Standard form of a linear equation isAxByC+=, whereA,B, andCare constants, andAandBare not both zero.30. A horizontal line has general form()orycfxc==, wherecis a constant.A vertical line has general formxa=, whereais a constant.Activity 1.10Practice Exercises1.2.Yes, the points are very close to the line.3.()3.7639.414fxx=-4.0.999998r=5.3.763m=6.The regression equation yields 47.03.7.The regression equation yields 9.40.8.()5fis probably more accurate since 5 is within the given data and 15 is not.()5fusesinterpolation;()15fuses extrapolation.9.2.50x=10.11. Yes, the points are very close to the line.12.()4.2116.44fxx= -+13.0.999995r= -14.4.21m= -

Page 12

Solution Manual for Mathematics in Action: Algebraic, Graphical, and Trigonometric Problem Solving, 6th Edition - Page 12 preview image

Loading page image...

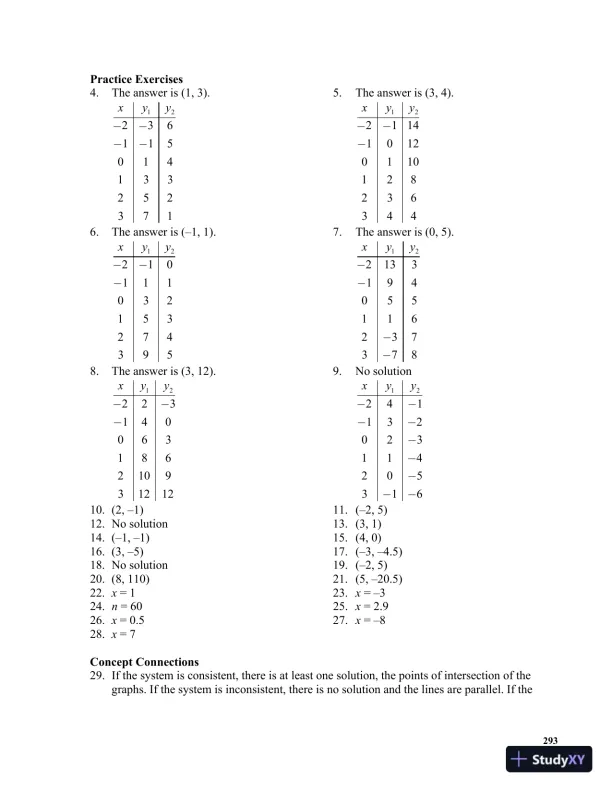
29215. The regression equation yields –4.63.16.The regression equation yields 37.51.17.()5f18.3.90x=19.20. Yes, the points are very close to the line.21.()14.32225.464fxx=-22.0.98726r=23.14.322m=24. The regression equation yields 3.2.25.The regression equation yields 332.6.26.()2f27.1.78x=28.()2fis probably more accurate. Since 2 is within the given data and 25 is not.()2fusesinterpolation;()25fuses extrapolation.Concept Connections29. Interpolation uses a regression model to predict an output within the boundaries of the inputvalues of the given data. Extrapolation uses a regression model to predict an output outsidethe boundaries of the input values of the given data.30. A correlation coefficient,r, measures how strongly two related variables follow a linearpattern. The value ofrranges between –1 and 1. When the value ofris closer to zero, youwould conclude that there is little or no linear correlation. The closerris to either 1 or –1,the stronger the linear correlation between the two variables. Ifr< 0, a negative correlation,then the linear pattern follows a negative slope. Ifr> 0, a positive correlation, then thelinear patters follows a positive slope.Activity 1.11Key Terms1.inconsistent2.consistent3.dependent

Page 13

Solution Manual for Mathematics in Action: Algebraic, Graphical, and Trigonometric Problem Solving, 6th Edition - Page 13 preview image

Loading page image...

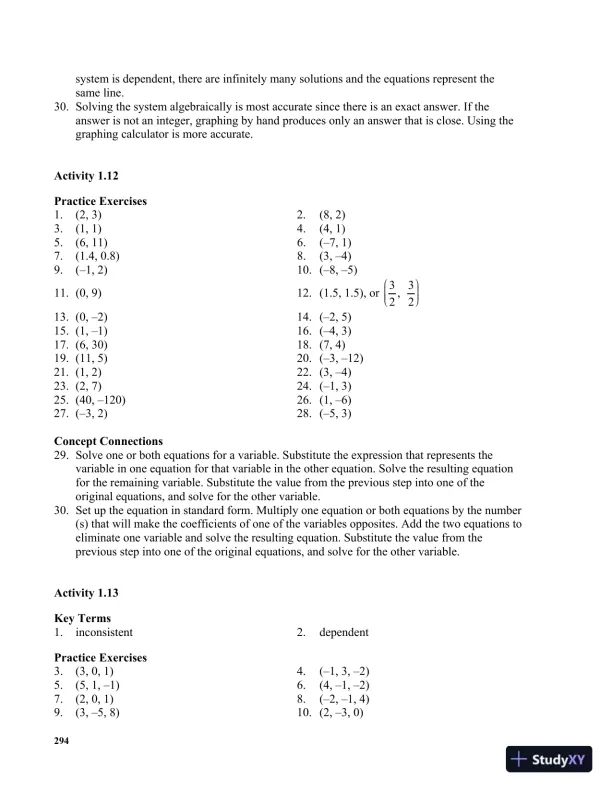
293Practice Exercises4.The answer is (1, 3).5.The answer is (3, 4).12236115014133252371xyy----12211410120110128236344xyy---6.The answer is (–1, 1).7.The answer is (0, 5).12210111032153274395xyy---122133194055116237378xyy----8.The answer is (3, 12).9.No solution12223140063186210931212xyy---12241132023114205316xyy---------10. (2, –1)11.(–2, 5)12. No solution13.(3, 1)14. (–1, –1)15.(4, 0)16. (3, –5)17.(–3, –4.5)18. No solution19.(–2, 5)20. (8, 110)21.(5, –20.5)22.x= 123.x= –324.n= 6025.x= 2.926.x= 0.527.x= –828.x= 7Concept Connections29. If the system is consistent, there is at least one solution, the points of intersection of thegraphs. If the system is inconsistent, there is no solution and the lines are parallel. If the

Page 14

Solution Manual for Mathematics in Action: Algebraic, Graphical, and Trigonometric Problem Solving, 6th Edition - Page 14 preview image

Loading page image...

294system is dependent, there are infinitely many solutions and the equations represent thesame line.30. Solving the system algebraically is most accurate since there is an exact answer. If theanswer is not an integer, graphing by hand produces only an answer that is close. Using thegraphing calculator is more accurate.Activity 1.12Practice Exercises1.(2, 3)2.(8, 2)3.(1, 1)4.(4, 1)5.(6, 11)6.(–7, 1)7.(1.4, 0.8)8.(3, –4)9.(–1, 2)10.(–8, –5)11. (0, 9)12.(1.5, 1.5), or33,22æö÷ç÷ç÷çèø13. (0, –2)14.(–2, 5)15. (1, –1)16.(–4, 3)17. (6, 30)18.(7, 4)19. (11, 5)20.(–3, –12)21. (1, 2)22.(3, –4)23. (2, 7)24.(–1, 3)25. (40, –120)26.(1, –6)27. (–3, 2)28.(–5, 3)Concept Connections29. Solve one or both equations for a variable. Substitute the expression that represents thevariable in one equation for that variable in the other equation. Solve the resulting equationfor the remaining variable. Substitute the value from the previous step into one of theoriginal equations, and solve for the other variable.30. Set up the equation in standard form. Multiply one equation or both equations by the number(s) that will make the coefficients of one of the variables opposites. Add the two equations toeliminate one variable and solve the resulting equation. Substitute the value from theprevious step into one of the original equations, and solve for the other variable.Activity 1.13Key Terms1.inconsistent2.dependentPractice Exercises3.(3, 0, 1)4.(–1, 3, –2)5.(5, 1, –1)6.(4, –1, –2)7.(2, 0, 1)8.(–2, –1, 4)9.(3, –5, 8)10.(2, –3, 0)

Page 15

Solution Manual for Mathematics in Action: Algebraic, Graphical, and Trigonometric Problem Solving, 6th Edition - Page 15 preview image

Loading page image...

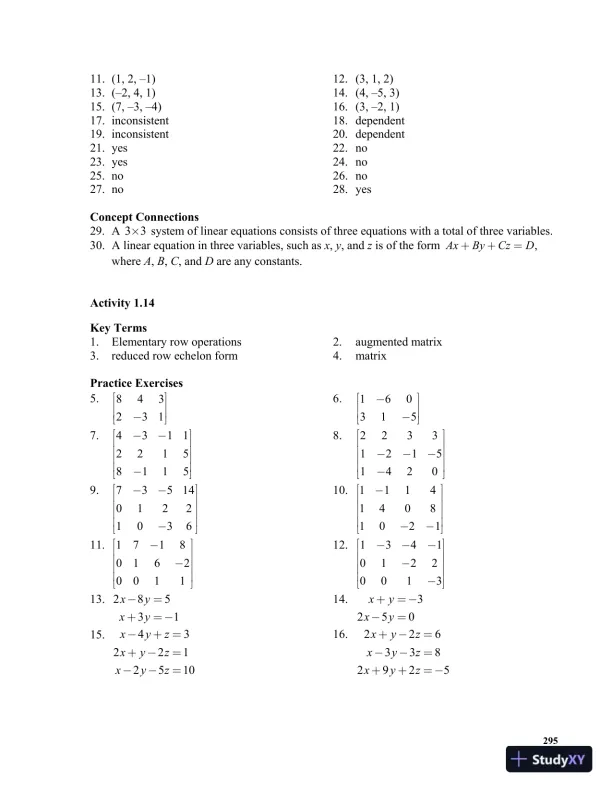
29511. (1, 2, –1)12.(3, 1, 2)13. (–2, 4, 1)14.(4, –5, 3)15. (7, –3, –4)16.(3, –2, 1)17. inconsistent18.dependent19. inconsistent20.dependent21. yes22.no23. yes24.no25. no26.no27. no28.yesConcept Connections29. A33´system of linear equations consists of three equations with a total of three variables.30. A linear equation in three variables, such asx,y, andzis of the form,AxByCzD++=whereA,B,C, andDare any constants.Activity 1.14Key Terms1.Elementary row operations2.augmented matrix3.reduced row echelon form4.matrixPractice Exercises5.843231éùêúêú-ëû6.160315éù-êúêú-ëû7.431122158115éù--êúêúêúêú-ëû8.223312151420éùêúêú---êúêú-ëû9.7351401221036éù--êúêúêúêú-ëû10.111414081021éù-êúêúêúêú--ëû11.171801620011éù-êúêú-êúêúëû12.134101220013éù---êúêú-êúêú-ëû13.28531xyxy-=+= -14.3250xyxy+= --=15.432212510xyzxyzxyz-+=+-=--=16.2263382925xyzxyzxyz+-=--=++= -

Page 16

Solution Manual for Mathematics in Action: Algebraic, Graphical, and Trigonometric Problem Solving, 6th Edition - Page 16 preview image

Loading page image...

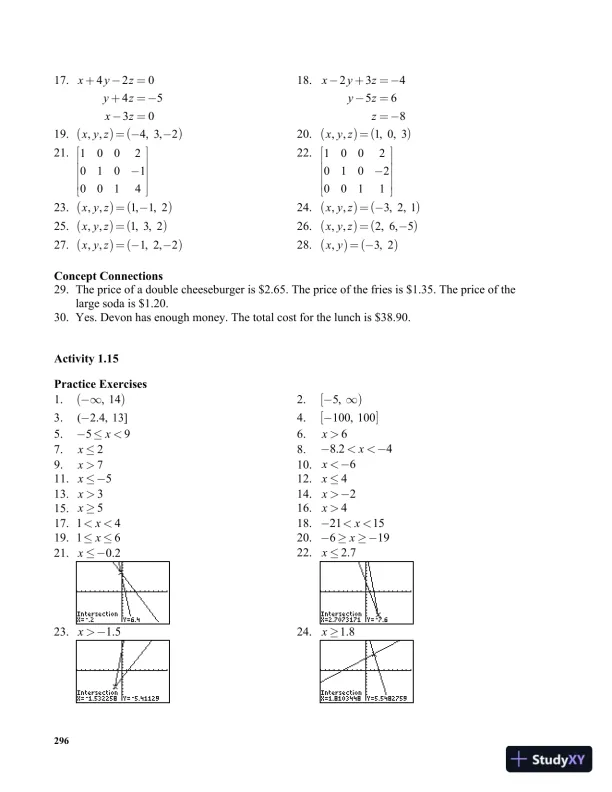
29617.4204530xyzyzxz+-=+= --=18.234568xyzyzz-+= --== -19.()(),,4, 3,2x y z= --20.()(),,1, 0, 3x y z=21.100201010014éùêúêú-êúêúëû22.100201020011éùêúêú-êúêúëû23.()(),,1,1, 2x y z=-24.()(),,3, 2, 1x y z= -25.()(),,1, 3, 2x y z=26.()(),,2, 6,5x y z=-27.()(),,1, 2,2x y z= --28.()(),3, 2x y= -Concept Connections29. The price of a double cheeseburger is $2.65. The price of the fries is $1.35. The price of thelarge soda is $1.20.30. Yes. Devon has enough money. The total cost for the lunch is $38.90.Activity 1.15Practice Exercises1.(), 142.[)5,-¥3.(2.4, 13]-4.[]100, 100-5.59x-£<6.6x>7.2x£8.8.24x-<<-9.7x>10.6x<-11.5x£-12.4x£13.3x>14.2x> -15.5x³16.4x>17.14x<<18.2115x-<<19.16x££20.619x-³³ -21.0.2x£ -22.2.7x£23.1.5x> -24.1.8x³
Preview Mode

This document has 63 pages. Sign in to access the full document!

Study Now!

XY-Copilot AI
Unlimited Access
Secure Payment
Instant Access
24/7 Support
Document Chat

Document Details

Related Documents

View all