STAT/167 Version 2 Distribution, Hypothesis Testing, and Error Worksheet University of Phoenix Material Tiffany Bush

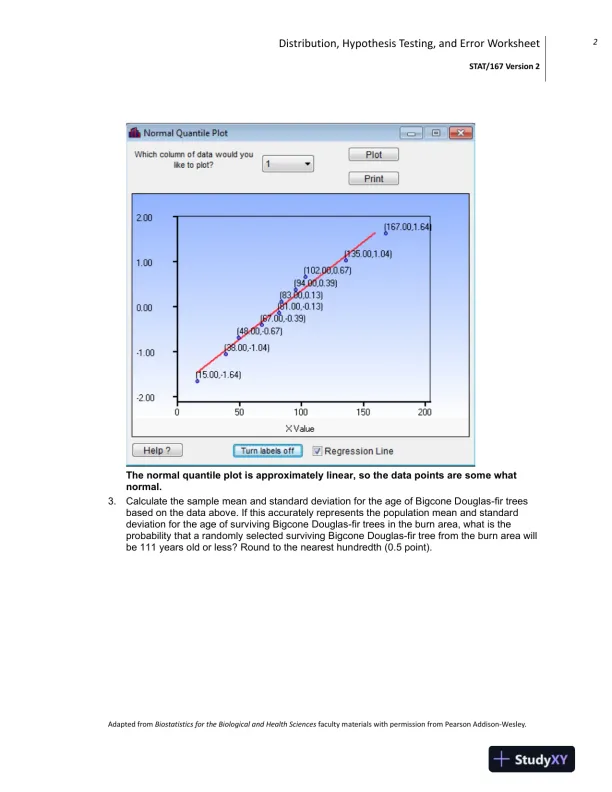
This document is a worksheet on distribution, hypothesis testing, and error, likely used in a statistics course at the University of Phoenix.

Sophia Johnson
Contributor
4.7
49
5 months ago
Preview (3 of 8 Pages)
100%
Purchase to unlock

Page 1

STAT/167 Version 2 Distribution, Hypothesis Testing, and Error Worksheet University of Phoenix Material Tiffany Bush - Page 1 preview image

Loading page image...

Distribution, Hypothesis Testing, and Error WorksheetSTAT/167 Version 21Adapted fromBiostatistics for the Biological and Health Sciencesfaculty materialswith permission from PearsonAddison-Wesley.STAT/167 Version 2Distribution, Hypothesis Testing, and Error WorksheetUniversity of Phoenix Material Tiffany BushDistribution, Hypothesis Testing, and Error WorksheetAnswer the following questions. For questions requiring material from Statdisk, make sure to turnlabels on, take a screen capture (CTRL-Print Screen on most Windows-based computers), andpaste the image into the worksheet. Crop the image as appropriate.1.Describe a normal distribution in no more than 100 words (0.5 point).A normal distribution isa continuous random variable distributionwhich has the meanand median same and the standard deviations are apart from the mean in theprobabilities that go with the empirical rule. The normal distribution is continuous, andhas only two parameters-mean and variance. The mean can be any positive numberand variance can be any positive number (can't be negative-the mean and variance),so there are an infinite number of normal distributions.The shape of the distribution issymmetrical and bell-shaped (bell curve).Use this information to answer questions 2-4. Following a brushfire, a forester takes coresamples from the ten surviving Bigcone Douglas-fir trees in a test plot within the burn area,and a dendrochronologist determines the age of the source trees to be as follows (in years):153848678183941021351672.Construct a normal quantile plot in Statdisk, show the regression line, and paste the imageinto your response. Based on the normal quantile plot, does the data above appear to comefrom a population of Bigcone Douglas-fir tree ages that has a normal distribution? Explain(0.5 point).

Page 2

STAT/167 Version 2 Distribution, Hypothesis Testing, and Error Worksheet University of Phoenix Material Tiffany Bush - Page 2 preview image

Loading page image...

Page 3

STAT/167 Version 2 Distribution, Hypothesis Testing, and Error Worksheet University of Phoenix Material Tiffany Bush - Page 3 preview image

Loading page image...

Distribution, Hypothesis Testing, and Error WorksheetSTAT/167 Version 22Adapted fromBiostatistics for the Biological and Health Sciencesfaculty materialswith permission from PearsonAddison-Wesley.The normal quantile plot is approximately linear, so the data points are some whatnormal.3.Calculate the sample mean and standard deviation for the age of Bigcone Douglas-fir treesbased on the data above. If this accurately represents the population mean and standarddeviation for the age of surviving Bigcone Douglas-fir trees in the burn area, what is theprobability that a randomly selected surviving Bigcone Douglas-fir tree from the burn area willbe 111 years old or less? Round to the nearest hundredth(0.5 point).
Preview Mode

This document has 8 pages. Sign in to access the full document!

Study Now!

XY-Copilot AI
Unlimited Access
Secure Payment
Instant Access
24/7 Support
Document Chat

Document Details

Related Documents

View all