Student Exploration Distance Time Graphs
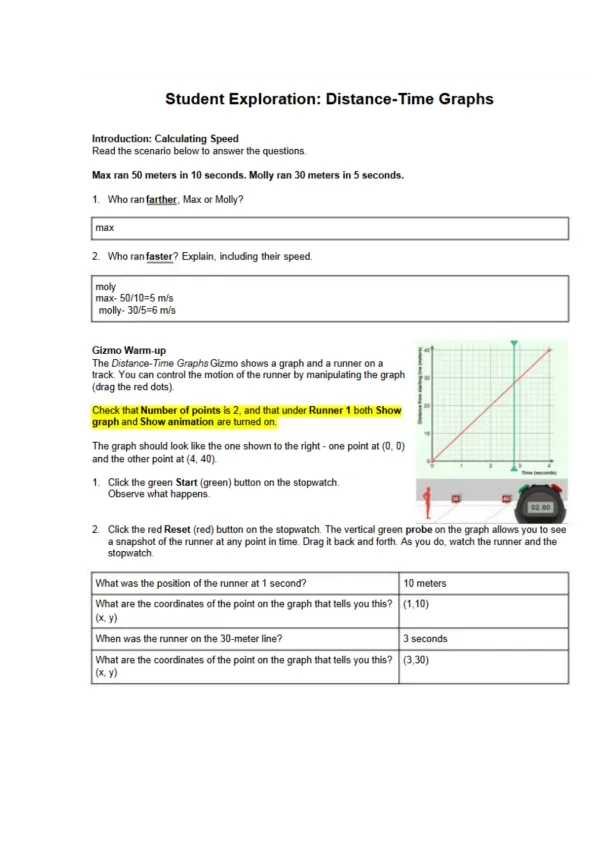
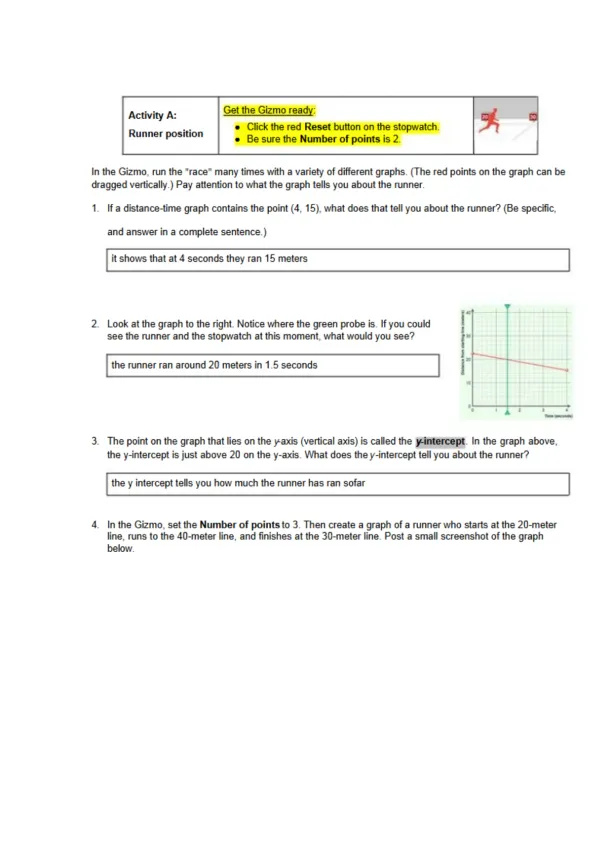
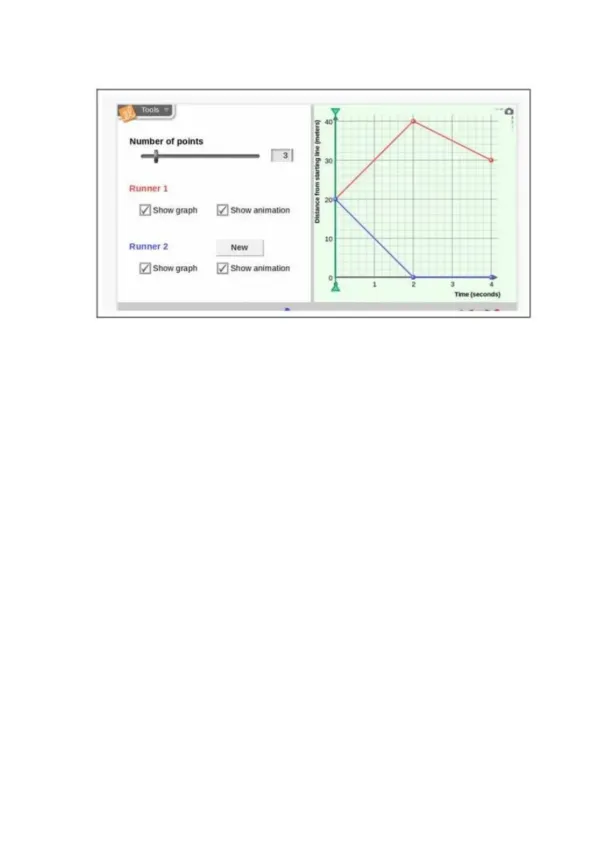
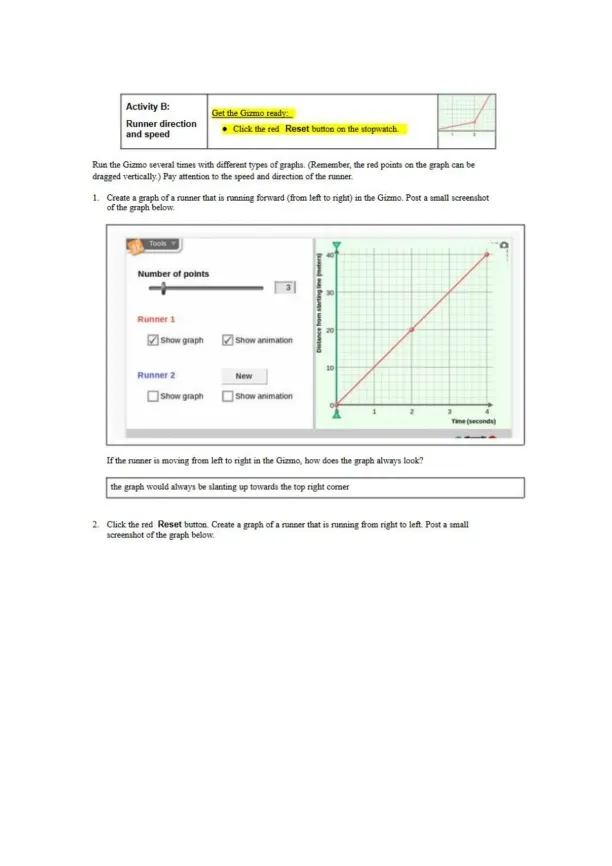
Explore distance-time graphs and runner motion with interactive Gizmo. Manipulate points to see how position changes over time, understand speed, and compare runners’ performance. Perfect for learning basic physics concepts visually and actively.
Daniel Miller
Contributor
4.8
54
26 days ago
Preview (4 of 12)
Sign in to access the full document!
Student Exploration: Distance-Time Graphs
Introduction: Calculating Speed
Read the scenario below to answer the questions.
Max ran 50 meters in 1 0 seconds. Molly ran 30 meters i n 5 seconds.
1. Wh o ran farther , Max or Molly?
max
2. V/ho ran faster? Explain, including their speed.
moly
max- 50/10=5 m/s
molly- 30/5=6 m/s
Gizmo Warm-up
The Distance-Time Graphs Gizmo shows a graph and a runner on a
track. You can control the motion of the runner by manipulating the graph
(drag the red dots).
Check that Number o f points is 2, and that under Runner 1 both Show
graph and Show animation are turned on.
The graph should look like the one shown to the right - one point at (0, 0)
and the other point at (4, 40).
1. Click the green Start (green) button on the stopwatch.
Observe what happens.
Click the red Reset (red) button on the stopwatch. The vertical green probe on the graph allows you to see
a snapshot of the runner at any point in time. Drag it back and forth. As you do; watch the runner and the
stopwatch.
2.
What was the position of the runner at 1 second? 10 meters
What are the coordinates of the point on the graph that tells you this?
(x: y)
( H O )
When was the runner on the 30 -meter line? 3 seconds
What are the coordinates of the point on the graph that tells you this?
(x: y)
(3,30)
Preview Mode
Sign in to access the full document!
100%
Study Now!
XY-Copilot AI
Unlimited Access
Secure Payment
Instant Access
24/7 Support
Document Chat
Document Details
Subject
Physics