Page 1
Loading page image...
Page 2

Loading page image...
Page 3

Loading page image...
Page 4
Loading page image...
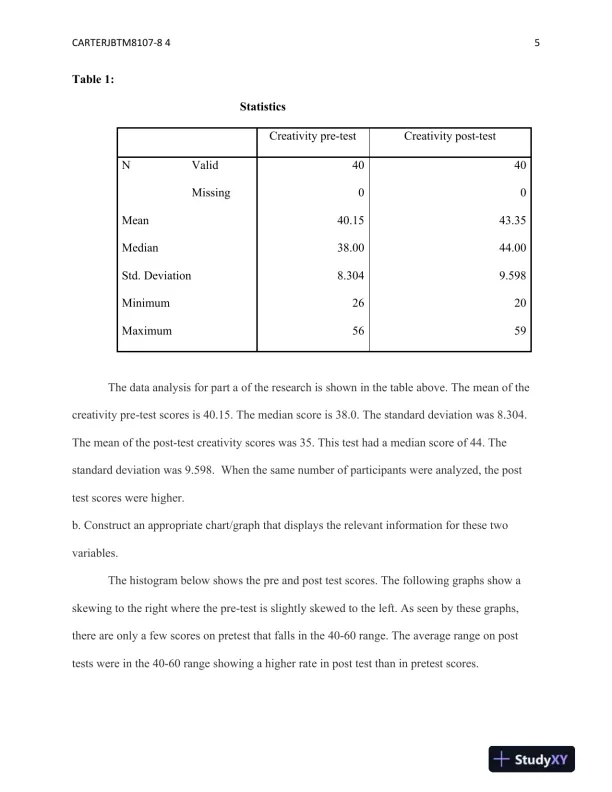
Page 5
Loading page image...
Page 6
Loading page image...
Page 7
Loading page image...
An official assignment submission template for business courses.
Loading page image...
Loading page image...
Loading page image...
Loading page image...
Loading page image...
Loading page image...
Loading page image...
This document has 22 pages. Sign in to access the full document!